July 20, 2026
When Chokepoints Become Flashpoints: Understanding the Hormuz Oil Crisis
Every few years, global energy markets are reminded of a foundational truth: the world's oil supply infrastructure is not a resilient web of redundant pathways. It is, in critical places, a single thread. The Strait of Hormuz is that thread. When military conflict transforms it from a shipping corridor into a contested war zone, as Brent oil tops $90 on US Iran attacks in West Asia, the consequences ripple outward through every refinery, fuel pump, and central bank balance sheet on the planet.
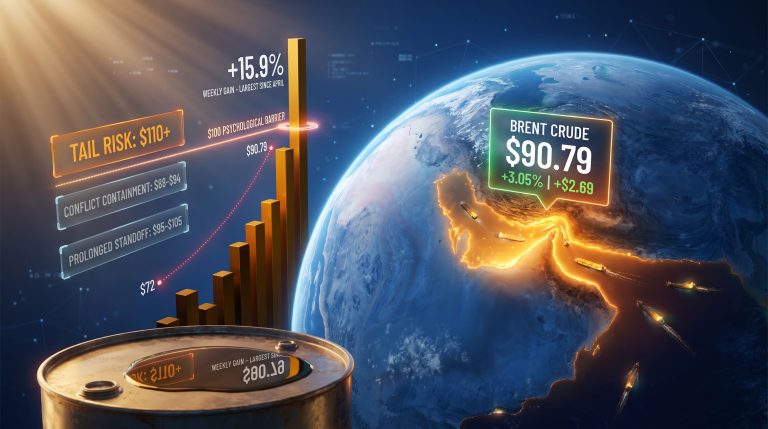
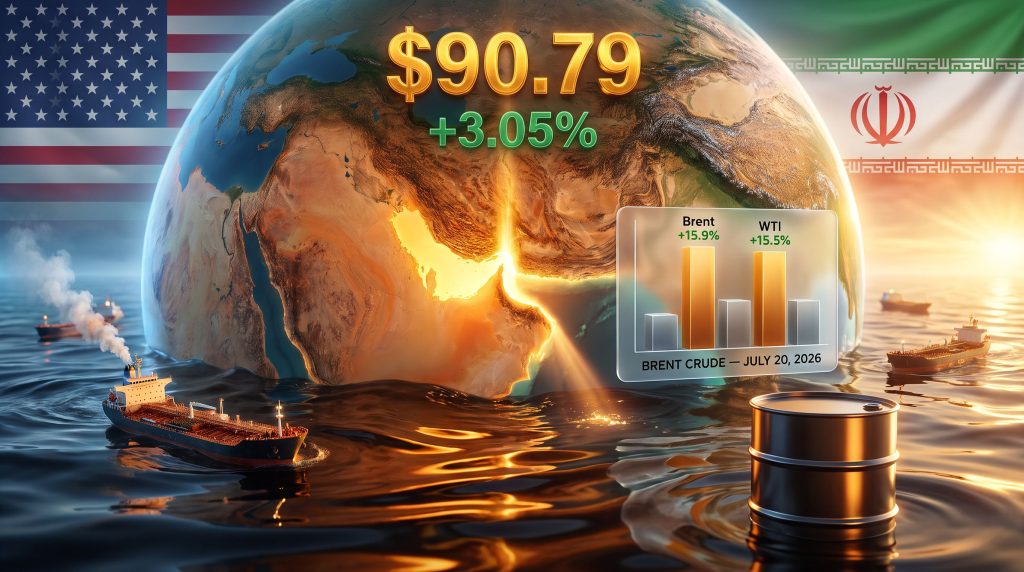
The events of mid-July 2026 provided a stark demonstration of this vulnerability. Brent crude surpassed $90 per barrel on July 20, 2026, driven by an intensifying military confrontation between the United States and Iran, with vessel transits through the world's most consequential energy chokepoint collapsing to historically low levels in real time.
When big ASX news breaks, our subscribers know first
The Strait of Hormuz: Geography as Destiny
To understand why Brent oil tops $90 on US Iran attacks in West Asia represents more than a headline price event, it is necessary to grasp what the Strait of Hormuz actually means to the global energy system at a structural level.
Under normal operating conditions, the strait handles roughly one-fifth of all global oil trade. At its narrowest navigable point, the waterway measures just 33 kilometres across, divided into two-kilometre shipping lanes in each direction separated by a two-kilometre buffer zone. The physical geometry alone creates extraordinary concentration risk. There is simply no viable large-scale alternative for Gulf oil producers to move product to Asian and European markets at comparable speed or cost.
Which Nations Face the Greatest Exposure?
The nations most directly exposed to any sustained reduction in Hormuz throughput are concentrated in Asia:
- India sources a large proportion of its crude from Persian Gulf exporters and has limited short-term diversification options
- China, the world's largest crude importer, relies heavily on Gulf supply chains and would face expensive rerouting costs if disruptions persisted
- Japan and South Korea maintain strategic petroleum reserves but face meaningful logistical strain if disruptions extend beyond 60 to 90 days
- European markets face indirect pressure through global benchmark repricing even where direct Gulf dependency is lower
Historical episodes of Hormuz tension, including the 2011 to 2012 period when Iranian threats to close the strait intensified, and the 2019 tanker attacks, produced price spikes in the range of 10 to 20 percent before diplomatic cooling provided relief. The trajectory in July 2026 had already exceeded that range within a single week. Furthermore, the geopolitical oil price tensions driving the current crisis appear considerably more entrenched than in prior episodes.
Price Movement Anatomy: What the Numbers Reveal
The scale of the price movement leading into July 20, 2026 deserves careful examination, because the weekly gain figures are arguably more significant than the single-day print.
| Metric | Value | Context |
|---|---|---|
| Brent Crude (July 20, 2026) | $90.79/barrel | Highest since June 11, 2026 |
| Single-Session Gain | +$2.69 (+3.05%) | Driven by escalating military exchange |
| Weekly Brent Gain (prior week) | +15.9% | Largest weekly gain since April 2026 |
| WTI Crude Price | $84.68/barrel (+2.65%) | Highest since June 12, 2026 |
| WTI Weekly Gain | +15.5% | Largest weekly gain since early March 2026 |
| Intraweek Brent Peak | ~$92.69/barrel | Highest Brent level since 2023 |
A weekly gain of nearly 16 percent in a single benchmark commodity of this systemic importance is not merely a price event. It represents a fundamental reassessment of supply risk probability by traders managing physical delivery exposure, not just financial speculation. When physical market participants re-price crude this aggressively, it signals that the disruption is being treated as structurally real rather than diplomatically transient. These oil price volatility trends highlight just how rapidly sentiment can shift when physical infrastructure is threatened.
Real-Time Shipping Data: The Most Honest Market Signal
While price charts capture sentiment, vessel transit data captures physical reality. LSEG shipping data for the Strait of Hormuz provided a sobering picture during the weekend of July 19 to 20, 2026.
- Only 4 vessels completed the strait passage on Sunday July 20
- That figure had already halved from 8 transits recorded the previous day
- At least 3 oil product tankers and 1 Very Large Crude Carrier (VLCC) had entered the strait since Friday to load oil
- Under normal operating conditions, daily transits through the Hormuz corridor typically range between 15 and 20 vessels
- The United Kingdom Maritime Trade Operations agency confirmed that a vessel was on fire northwest of Oman's Kumzar, providing direct physical evidence of active maritime threat
The daily Hormuz transit count is arguably the single most reliable leading indicator of physical supply disruption severity. Diplomatic statements can be walked back. Vessels either move or they do not.
A reduction from a normal baseline of 15 to 20 daily transits down to 4 represents a throughput collapse of approximately 75 to 80 percent. At that level, the downstream inventory consequences for Asian refineries begin to materialise within days, not weeks. Refineries operating on just-in-time inventory management models, which is standard practice across much of the Asia-Pacific region, have limited capacity to absorb even brief supply gaps.
The Dual Blockade Structure: An Unprecedented Risk Configuration
The escalation timeline leading to July 20 introduced a structural risk configuration that has no clear precedent in modern energy market history. The United States announced enforcement of a naval blockade on Iranian ports. Iran simultaneously declared the right to intercept vessels it deemed in violation of its own navigation rules within the strait. The result was a situation in which commercial shipping faced potential interdiction from both directions simultaneously.
How Did the Escalation Unfold?
The operational sequence included:
- The United States conducting its ninth consecutive night of strikes against Iranian targets, including coastal surveillance infrastructure and missile launch systems
- Iran executing retaliatory strikes targeting US personnel and commercial shipping across the broader West Asia region
- US allies Kuwait and Bahrain reporting direct Iranian strikes on their territory, expanding the geographic scope of the conflict
- Both parties formally asserting interdiction authority over Hormuz traffic, creating the dual blockade dynamic
Prior Hormuz conflict episodes involved one party disrupting shipping while the other attempted to protect it. A configuration in which both major parties actively threaten transit creates a qualitatively different risk environment that standard geopolitical risk models have not historically been calibrated to price. Consequently, the oil market disruption risks are considerably more complex than in previous regional standoffs.
Inventory Tightness: The Structural Amplifier
The timing of this disruption carries additional significance because of where global oil inventories stood at the onset of the conflict. A Barclays analyst assessment published around the time of the escalation noted that global oil inventories had reached their tightest levels in five years, and further observed that markets appeared to be underestimating the potential inventory fallout from sustained dual blockades compared to what earlier conflict episodes had implied.
This context matters enormously for understanding the price sensitivity of the current disruption:
- When inventory buffers are large, markets can absorb a temporary supply shock by drawing on stockpiles while diplomatic resolution is sought
- When inventories are at multi-year lows, the same volume disruption produces a faster and larger price response because the cushion has been eroded
- The combination of OPEC+ production discipline over preceding years, post-pandemic demand recovery, and earlier supply chain disruptions contributed progressively to drawing down strategic reserves
The practical implication is that the market's price elasticity to supply disruption is materially higher in mid-2026 than it would have been during earlier Hormuz tension episodes. In addition, OPEC's market influence through sustained production discipline in prior years has directly contributed to this tightened inventory environment.
The next major ASX story will hit our subscribers first
Scenario Modelling: Where Prices Go From Here
Four credible scenarios frame the potential trajectory for Brent crude, depending on how the military and diplomatic situation evolves:
| Scenario | Condition | Projected Brent Range |
|---|---|---|
| Rapid De-escalation | Ceasefire within 1 to 2 weeks, shipping resumes | $60 to $70/barrel |
| Prolonged Standoff | Dual blockade persists 4 to 8 weeks | $95 to $105/barrel |
| Infrastructure Damage | Major port or pipeline struck | $105+/barrel |
| Broader Regional Expansion | Additional state actors drawn in | $110+ possible, highly unpredictable |
The $95 to $105 range becomes increasingly probable if shipping disruptions extend beyond a month. The rerouting cost premium adds a secondary layer: vessels diverting around the Cape of Good Hope add approximately 15 to 20 additional transit days per voyage, increasing per-barrel landed costs by an estimated $3 to $8/barrel depending on vessel class and prevailing fuel prices. Tanker day rates surge simultaneously as available vessel capacity compresses.
Consumer and Macroeconomic Transmission Effects
The consequences of sustained crude prices above $90 per barrel extend well beyond fuel pump prices. The transmission mechanism operates across multiple layers:
- A Brent price above $90/barrel typically translates to retail fuel price increases of 8 to 15 percent in price-sensitive markets within 4 to 6 weeks of sustained elevation
- Jet fuel and diesel face proportionally larger cost pressures given refinery margin dynamics that favour middle distillate pricing during supply shocks
- Energy-intensive industries including petrochemicals, agriculture, shipping, and aviation face compounding input cost increases that feed into broader goods inflation
- Producer Price Indices (PPI) absorb the crude price signal first, then transmit into Consumer Price Indices (CPI) with a typical 6 to 10 week lag
For central banks in economies that had recently achieved meaningful disinflation progress, including India, several EU member states, and Southeast Asian nations, a renewed energy-driven inflation impulse creates a particularly difficult policy environment. Supply-side inflation originating from a geopolitical supply shock cannot be resolved through interest rate policy, which operates through demand suppression.
Currency depreciation in oil-importing emerging markets adds a further amplification layer. As the dollar-denominated crude price rises and local currencies weaken in response to worsening trade balances, the domestic price impact of the disruption exceeds what the raw crude price movement alone would imply.
Key Variables to Monitor
For market participants tracking the trajectory of this disruption, five variables carry the highest informational value:
- Daily Hormuz vessel transit counts as reported by LSEG and other shipping data providers, representing the most direct real-time measure of physical supply disruption
- Weekly inventory data from the EIA and IEA, which will quantify how rapidly the physical market is tightening as disruption persists
- Diplomatic signalling channels, where any credible back-channel communication between Washington and Tehran would likely trigger a rapid price correction
- OPEC+ spare capacity utilisation, specifically whether Gulf producers outside Iran can meaningfully increase output to partially offset disrupted Iranian volumes
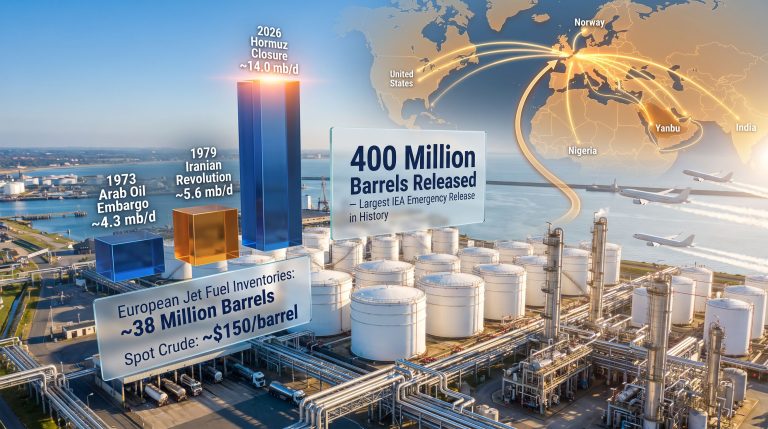
- Coordinated IEA Strategic Petroleum Reserve releases, which have historically acted as a temporary price ceiling mechanism during supply shocks
For a broader perspective on current conditions, the crude oil market overview provides useful context on how these variables have behaved in recent months. Furthermore, live Brent crude data offers real-time tracking of how the market continues to respond as events unfold.
Disclaimer: The scenario price projections and market analysis contained in this article are based on publicly available data and analyst commentary as of July 20, 2026. Crude oil markets are subject to rapid change driven by geopolitical developments, and nothing in this article constitutes financial or investment advice. Past price behaviour during geopolitical events is not a reliable predictor of future outcomes.
Three Structural Takeaways
Several structural observations distinguish the July 2026 Hormuz episode from prior conflict-driven oil price spikes.
First, the inventory buffer that previously allowed markets to absorb short-term supply shocks has been substantially eroded. Five-year-low inventory levels mean that any given volume reduction produces a faster and larger price response than historical averages would suggest.
Second, the dual blockade configuration is genuinely novel in the modern energy era. Unlike prior episodes where one party disrupted shipping and the other attempted protection, simultaneous interdiction authority claimed by both sides creates a compounding uncertainty that standard geopolitical risk premiums are not designed to capture.
Third, and perhaps most importantly for traders and risk managers, the daily vessel transit count through the Strait of Hormuz is the leading indicator that matters most. At four transits per day against a normal baseline of 15 to 20, the physical market is already experiencing a supply shock of significant magnitude. Whether that figure recovers toward normalcy or deteriorates further will determine whether the $95 to $105 scenario or the de-escalation scenario defines the second half of 2026's energy market narrative.
Want to Stay Ahead of the Market Opportunities That Geopolitical Shocks Create?
When energy crises reshape commodity markets at speed, the investors who act on real-time intelligence gain the most decisive edge. Discovery Alert's proprietary Discovery IQ model continuously scans ASX announcements to deliver instant alerts on significant mineral discoveries — including those in commodities directly influenced by global supply disruptions — so subscribers can identify actionable opportunities ahead of the broader market, or explore how historic discoveries have generated substantial returns before starting their 14-day free trial today.