May 15, 2026
When the Crisis That Should Lift Gold Is the Same One Dragging It Down
There is a counterintuitive dynamic sitting at the heart of global commodity markets right now, and most investors misread it every time it appears. The conventional instinct is straightforward: geopolitical crisis erupts, investors flee to safety, gold rises. That logic has held across decades of market history, from Middle Eastern conflicts to financial system shocks. However, the mechanism breaks down in a specific and important way when the crisis in question is an oil supply disruption, because the same shock that triggers safe-haven demand simultaneously ignites inflationary forces that make central banks tighten, yields rise, and the dollar strengthen. All three of those outcomes are structurally bearish for gold.
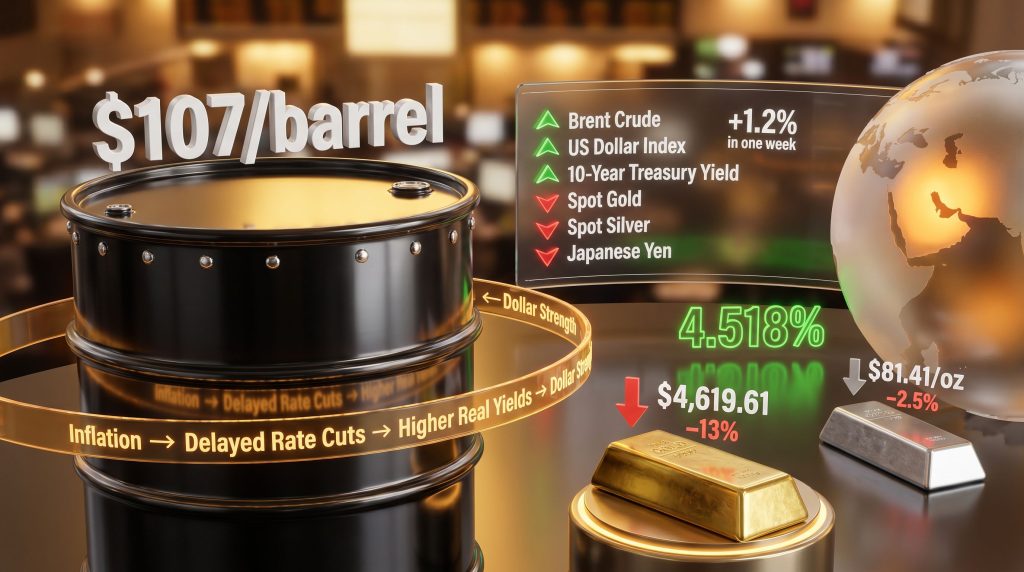
This is precisely the environment that has unfolded as Brent crude surged 5.7% to $107 per barrel following Strait of Hormuz disruptions, and it explains the story of Brent oil above $100 pressures gold prices — with spot gold declining approximately 13% from its late-February peak to reach $4,619.61 per ounce, its lowest level since early May 2026. Understanding the multi-step transmission mechanism from an oil barrel to a gold price move is not just academically interesting. It is essential for any investor trying to navigate what comes next.
When big ASX news breaks, our subscribers know first
The Strait of Hormuz: Why Supply Shocks Are More Inflationary Than Demand Rallies
Not all oil price rallies are created equal. When crude rises because global demand is accelerating, it is typically accompanied by stronger economic growth, rising corporate earnings, and expanding employment. That demand-driven environment can coexist with modest gold gains because economic confidence is rising broadly.
A geopolitically-driven supply shock operates entirely differently. When shipping lanes through the Strait of Hormuz are disrupted by vessel seizures and regional conflict, the price of oil rises without any corresponding increase in economic output. There is no demand surge to validate higher prices. Instead, the cost of energy simply becomes more expensive for every manufacturer, logistics provider, and consumer globally, compressing margins and raising prices simultaneously.
That is the definition of an inflationary supply shock, and it is considerably more damaging to central bank rate-cutting ambitions than a demand-driven price rally. Furthermore, understanding crude oil price trends helps contextualise why these shocks carry such significant downstream consequences for precious metals.
The Hormuz chokepoint handles roughly 20% of global oil and gas trade, making it one of the most consequential geographic features in the global economy. When that passage becomes unreliable, the insurance premiums, rerouting costs, and supply uncertainty embed themselves into energy pricing for weeks or months, not days.
"The inflationary pressure from a supply-driven oil shock is not limited to the petrol station. It cascades through freight rates, food production costs, chemical feedstocks, and manufactured goods pricing across every import-dependent economy."
The Four-Part Transmission: How Brent Oil Above $100 Pressures Gold Prices
The Real Yield Channel
Gold is a non-yielding asset. It generates no income, pays no dividend, and offers no coupon. Its attractiveness as an asset class is therefore deeply sensitive to the opportunity cost of holding it. When income-generating alternatives offer competitive real returns, capital rotates away from gold toward those alternatives.
Real yields, defined as nominal Treasury yields minus inflation expectations, are the single most powerful driver of this dynamic. Historically, periods where real yields sustained levels above 1.5% to 2% have coincided with meaningful gold corrections. With 10-year US Treasury yields at 4.518% (up 6 basis points in a single week as of mid-May 2026) and inflation expectations being revised upward by institutions including UOB, whose senior economist Alvin Liew raised the bank's 2026 US inflation forecast and indicated that rate cuts may not arrive before 2027, the opportunity cost argument against gold is operating at full force.
In addition, the gold and bond dynamics at play during this period illustrate precisely how rising Treasury yields suppress non-yielding assets with particular severity when inflation expectations are simultaneously climbing.
The US Dollar Amplification Effect
The dollar's relationship with gold is one of the most reliable inverse correlations in financial markets. Historically, a 1% rise in the US Dollar Index has tended to suppress XAU/USD by approximately 0.8% to 1.2%, depending on the broader macro context. With the dollar index gaining 1.2% in a single week, that currency headwind is substantial.
The mechanism behind dollar strength during oil shocks is less intuitive than it appears. The United States has transitioned from a net oil importer to a significant net crude exporter over the past decade, meaning that when Brent surges above $100, the US economy benefits relative to oil-importing peers in Europe and Asia. That relative advantage supports the dollar against currencies like the euro, yen, and sterling, widening interest rate differentials and pulling capital toward US dollar assets.
For foreign gold buyers, this creates a compounding headwind. Both the gold price in dollar terms and the exchange rate are moving against them simultaneously, meaning the effective cost of gold in local currency terms rises faster than the dollar price alone suggests.
The Federal Reserve Rate Expectations Channel
Perhaps the most mechanically significant pressure on gold right now comes from the repricing of Federal Reserve rate expectations. CME FedWatch data shows the probability of a December 2026 Fed rate hike rising from 22.5% to 40% within a single week, a dramatic shift in market expectations that directly affects how investors value non-yielding assets.
The logic is linear: if oil stays above $100, inflation stays elevated; if inflation stays elevated, the Fed cannot cut rates; if the Fed cannot cut rates, Treasury yields stay high; if Treasury yields stay high, the opportunity cost of holding gold remains punishing. ANZ's response to this chain was to cut its year-end gold price target by $200 to $5,600, citing the combination of dollar strength and elevated yields as the primary constraint on gold's recovery potential.
The Safe-Haven Paradox
The fourth pressure mechanism is the most paradoxical. Gold is traditionally the asset that benefits from geopolitical crises. The Hormuz disruption is unambiguously a geopolitical crisis. Yet gold has declined roughly 2% in a single session as Brent surged past $100 on conflict-related news, with silver falling approximately 3.5% in the same window.
The resolution to this apparent contradiction lies in the gold safe-haven dynamics that determine when geopolitical risk supports or suppresses the metal. Geopolitical crises only support gold when they do not simultaneously trigger inflation expectations that force central banks into a hawkish posture. When both conditions exist at once, the rate channel dominates the safe-haven channel.
"The conditions that define whether geopolitical risk supports or suppresses gold come down to one question: does the crisis trigger inflation expectations aggressive enough to shift central bank behavior? If yes, the rate channel wins. If no, safe-haven demand wins."
Mapping the Decline: Gold, Silver, and Currency Pressure Points
The timeline of gold's decline illustrates how each escalation in oil pricing corresponded to a new leg lower in precious metals valuations.
| Period | Key Event | Market Impact |
|---|---|---|
| February 28, 2026 | US-Iran conflict escalation begins | Gold starts multi-week decline from peak |
| Early March 2026 | Brent surges past $100, approaches $110 | Gold drops ~2%, silver falls ~3.5% |
| April 23, 2026 | Brent briefly above $101 | Gold stabilizes near $4,725/oz |
| Mid-May 2026 | Brent at $107, Treasury yields at 4.518% | Gold at $4,619.61, ~13% off peak |
Silver's parallel decline to $81.41 per ounce, down 2.5% in the most recent session, confirms the pattern is not idiosyncratic to gold. Silver occupies a dual role in markets as both a monetary metal and an industrial commodity, which means its industrial demand provides some support during normal economic expansions. In the current environment, however, the monetary headwinds from rising yields and a stronger dollar are overwhelming that industrial demand floor.
Furthermore, gold-silver ratio analysis reveals that silver's higher price volatility relative to gold — a characteristic known as its higher beta — means it tends to amplify gold's directional moves in both directions.
Currency markets are experiencing an equally pronounced impact. The Japanese yen has remained below 158 per dollar as the yield differential between US Treasuries and Japanese government bonds continues to widen. Sterling fell to a one-month low following domestic political developments in the UK, compounding the pressure from the global dollar strength trend. According to Henry Cook, senior Europe economist at MUFG Bank, the British economic outlook carries meaningful downside risk given the combination of global rate pressures and domestic political uncertainty.
Asset Class Performance Under $100+ Oil: A Structured Comparison
| Asset Class | Direction | Primary Driver |
|---|---|---|
| Brent Crude | Upward | Supply disruption premium |
| US Dollar Index | Upward | Inflation divergence, net export advantage |
| 10-Year Treasury Yield | Upward | Inflation expectations repricing |
| Spot Gold | Downward | Opportunity cost, dollar strength |
| Spot Silver | Downward | Mirrors gold with higher volatility |
| Japanese Yen | Downward | Yield differential widening |
| Free Cash Flow Equities | Outperforming | Pricing power, income generation |
| Leveraged/Rate-Sensitive Equities | Underperforming | Debt servicing cost sensitivity |
The rotation away from precious metals toward companies with strong free cash flow and genuine pricing power is not a marginal repositioning. Padhraic Garvey, ING's regional head of research for the Americas, has noted that persistent inflation is likely to push Treasury yields higher, which structurally advantages businesses capable of passing cost increases onto consumers and generating income regardless of interest rate direction. Highly leveraged businesses that rely on cheap debt to sustain their operating models sit at the opposite end of that spectrum.
What Breaks the Pressure: Three Scenarios for Gold Recovery
Scenario 1: Hormuz Reopens and Brent Falls Below $100
A verified diplomatic agreement that physically reopens Gulf shipping lanes would initiate a cascade in the opposite direction from what is currently unfolding. Lower oil would reduce inflation expectations, which would reduce pressure on the Fed to maintain or raise rates, which would allow Treasury yields to fall, which would weaken the dollar and simultaneously reduce gold's opportunity cost. The critical word here is verified. Diplomatic announcements without physical confirmation of resumed safe passage have historically produced only temporary price reactions.
If Brent were to fall back to the $80 to $85 per barrel range, a meaningful reversal of gold's 13% decline would be achievable, though the pace of recovery would depend on how quickly inflation expectations adjusted and whether the Fed signalled a renewed willingness to cut.
Scenario 2: US Labor Market Data Forces a Fed Pivot
The second path to gold recovery does not require geopolitical resolution at all. If US employment data deteriorates materially, specifically sustained monthly job losses exceeding 100,000, the Federal Reserve faces a policy conflict between fighting inflation and preventing recessionary damage to the labor market. Historically, the Fed has pivoted toward labor market support in those scenarios, even at the cost of tolerating above-target inflation.
A decline in the 40% December 2026 rate hike probability back toward the 15% to 20% range would signal that markets are repricing the rate trajectory lower, which would be constructive for gold regardless of oil prices. Gold has historically front-run Fed rate cuts by three to six months as investors position ahead of the formal policy shift.
Scenario 3: Stagflation Emerges
The third scenario is the most historically favourable for gold but currently carries the lowest probability of the three. If oil sustains above $100 while economic growth simultaneously decelerates, the resulting stagflationary environment removes the rationale for maintaining high yields, because a weakening economy cannot sustain aggressive monetary tightening without triggering a recession.
The 1970s provide the clearest historical template. Gold's strongest multi-year performance on record coincided with precisely that combination of rising prices and stagnating growth. Consequently, the recession impact on gold in stagflationary environments is considerably more nuanced than in straightforward economic downturns, often inverting the typical relationship between yields and precious metals pricing. The probability of stagflation emerging rises meaningfully if the Hormuz disruption extends beyond the third quarter of 2026 without resolution.
"Investors should be careful not to conflate a long-term secular gold bull market with the current cyclical headwind. The 52-week moving average near $3,917 confirms the broader uptrend remains structurally intact. The current 13% correction is a regime-specific pressure event, not evidence of a structural reversal."
The next major ASX story will hit our subscribers first
Positioning in a High-Oil, High-Yield Environment
The challenge for investors right now is that the Trump-Xi summit creates a genuinely binary outcome. A breakthrough that verifiably reopens Hormuz shipping lanes would trigger a rapid reversal across the entire macro chain. No progress would entrench the current regime for an extended period. Positioning aggressively in either direction without a confirmed catalyst is speculative trading rather than informed investing.
Several practical implications follow from the current regime:
- Reduce leverage in positions that depend on Fed rate cuts arriving before 2027, which UOB's analysis suggests is an optimistic assumption given current inflation dynamics.
- Favour free cash flow generation over asset price appreciation as the primary investment criterion in equity selection during this period.
- Monitor CME FedWatch December 2026 rate hike probability as the single most useful real-time indicator of whether the rate pressure on gold is intensifying or easing.
- Wait for Brent to fall and sustain below $100 before treating any gold bounce as a confirmed recovery rather than a technical retracement within a downtrend.
- Assess silver's industrial demand signals separately from its monetary metal behaviour, as a genuine economic expansion narrative could provide silver with a different recovery trajectory than gold.
The key technical level to watch for gold is the area near $5,002. A confirmed and sustained break below that threshold has historically opened the path toward lower support levels near $4,744. Conversely, a rally back above $5,002 on a weekly closing basis would begin to suggest the worst of the current selling pressure has passed.
However, commodity market reactions to shifts in oil pricing demonstrate just how quickly the macro narrative can pivot when supply disruption premiums begin to unwind, reinforcing the case for remaining alert to changing conditions rather than locking in directional bets prematurely.
Understanding that the current environment is regime-dependent rather than structurally bearish for gold is the most important conceptual anchor for investors navigating this period. The same forces compressing gold today — elevated yields, a strong dollar, and delayed rate cuts — are all reversible given the right catalysts. The secular case for gold remains intact. The cyclical timing, however, requires patience and a clear confirmation signal before acting.
This article is intended for informational purposes only and does not constitute financial advice. All price levels, probability data, and analyst forecasts referenced reflect conditions as of mid-May 2026 and are subject to change. Investors should conduct their own due diligence and consult a licensed financial adviser before making investment decisions. Past relationships between asset classes are not guaranteed to repeat in future market conditions.
Want to Be First When the Next Major Mineral Discovery Hits the ASX?
Discovery Alert's proprietary Discovery IQ model scans ASX announcements in real time, instantly identifying high-potential mineral discoveries across more than 30 commodities — giving subscribers an actionable edge before the broader market reacts. Explore how historic discoveries have generated significant returns on Discovery Alert's dedicated discoveries page, and begin your 14-day free trial today to position yourself ahead of the market.