
August 21, 2026
The Two-Tier Petroleum Market Most Analysts Are Getting Wrong
There is a persistent tendency in energy market commentary to treat crude oil inventories as the definitive barometer of petroleum pricing. When stocks build, prices should fall. When they draw, prices should rise. This logic held reasonably well in decades past, but the oil market of 2026 has fractured that assumption at its foundation. Brent oil prices and distillate inventories now tell fundamentally different stories, creating a two-tier pricing environment where analysts anchored to headline crude data are systematically misreading the dominant price signal.
Understanding why Brent remains elevated despite normalised crude inventories requires a fundamental shift in analytical framework — away from upstream stock levels and toward the refined-product layer of the supply chain, where genuine tightness in today's petroleum complex is concentrated. This dynamic has significant implications across commodities market volatility hedging strategies and fuel-intensive industrial sectors alike.
When big ASX news breaks, our subscribers know first
Brent and WTI in August 2026: Dissecting the Price Signal
As of August 21, 2026, Brent crude pulled back 0.3% to $93.50 per barrel, while WTI declined 0.5% to $86.42. Both moves were modest and occurred after five consecutive sessions of gains, leaving both benchmarks on track for approximately 5% weekly advances. The persistent Brent-WTI spread reflects differences in export logistics, crude quality, and the geographic concentration of geopolitical risk weighting that international buyers embed into the seaborne benchmark.
The week ending August 14, 2026 provided the most detailed inventory picture. Brent had traded across a range of roughly $93.30 to $95.30 per barrel during that period. Rather than reflecting crude scarcity, this price level represents a composite of three distinct forces:
- A structural geopolitical risk premium tied to Hormuz transit uncertainty
- Export-driven absorption of domestic U.S. crude production
- Genuine tightness in the refined-product layer of the supply chain
Each of these components requires independent analysis, because conflating them leads to incorrect directional conclusions about where petroleum prices are headed.
Crude Inventories at the Five-Year Average: Why This Isn't Bearish
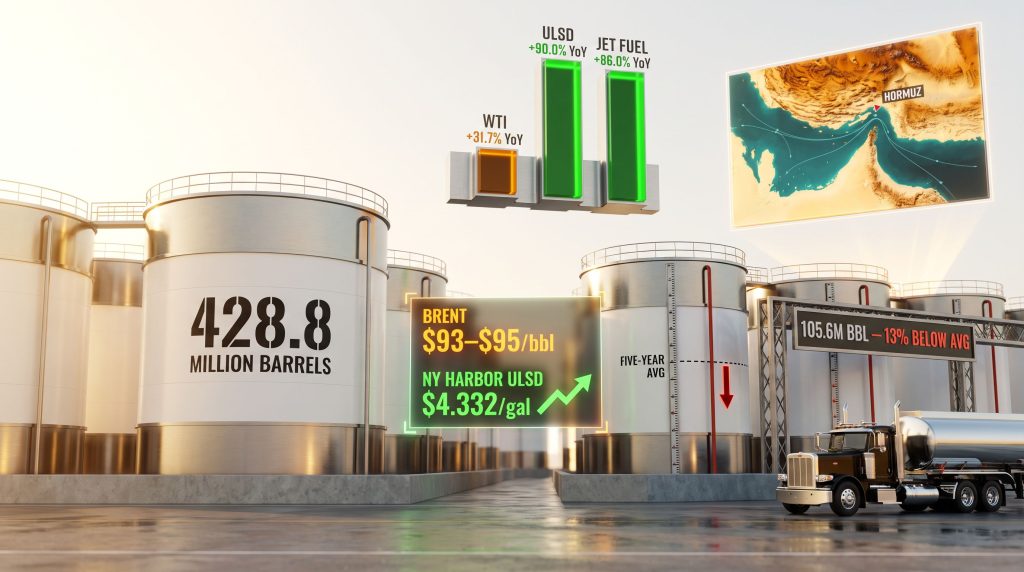
The EIA data for the week ending August 14, 2026 showed U.S. crude inventories rising by 4.4 million barrels to reach 428.8 million barrels, a level that sits essentially at the five-year seasonal average of approximately 428 to 430 million barrels. On its surface, this inventory normalisation would traditionally support a bearish price interpretation. However, the bearish reading collapses when two additional variables are examined.
| Metric | Week Ending Aug. 14, 2026 | Context |
|---|---|---|
| U.S. Crude Inventories | 428.8 million barrels | At five-year seasonal average |
| Weekly Crude Build | +4.4 million barrels | Absorbed by export surge |
| U.S. Crude Production | 13.83 million b/d | Near-record output |
| Crude Exports | 4.07 million b/d | Up 1.01 million b/d week-over-week |
First, production at 13.83 million barrels per day is near-record, yet inventories have only just returned to average rather than surging above it. Second, crude exports jumped by 1.01 million barrels per day week-over-week to 4.07 million b/d, meaning a significant share of domestic production is being redirected to global markets rather than accumulating in storage.
These export flows are functioning as a pressure valve, preventing the inventory build from generating the supply overhang that would normally pressure prices downward.
Key analytical point: Normalised crude inventories in the context of record-level production and surging exports are not a supply surplus signal. They indicate that the market is efficiently clearing domestic output through export channels, which limits the price-dampening effect of the inventory rebuild.
Distillate Inventories: The 105.6 Million Barrel Problem
While crude stocks have returned to their five-year average, distillate inventories tell an entirely different story. In the same week ending August 14, 2026, U.S. distillate inventories fell by 1.5 million barrels to 105.6 million barrels — a level approximately 13% below the five-year seasonal average. This deficit did not emerge recently. Reuters reporting from mid-June 2026 confirmed that distillate stocks were running roughly 12 million barrels below the five-year average at that time, indicating a sustained structural shortfall rather than a short-term fluctuation.
Why Refinery Utilisation Makes This Deficit Worse
The critical detail that makes this deficit especially significant is the refinery utilisation backdrop against which it has formed. U.S. refineries operated at 97.2% of operable capacity during the same reporting week. This figure is not merely high; it represents the practical ceiling of sustainable throughput.
Refineries cannot routinely operate above this level without incurring accelerated maintenance requirements and equipment stress. Yet despite running at near-maximum capacity, distillate inventories continued to draw rather than build. Consequently, this confirms that demand absorption and export flows are outpacing even peak refinery output.
The distillate deficit is not a problem that more refinery effort can solve in the near term. The industry is already giving maximum effort. The gap is being driven by consumption and export demand exceeding the physical limits of available processing capacity.
Diesel and Jet Fuel: A Year-Over-Year Transformation
The consequences of distillate tightness are visible in refined-product prices, which have diverged dramatically from crude oil price movements over the past twelve months.
| Product | August 14, 2025 | August 14, 2026 | Year-Over-Year Change |
|---|---|---|---|
| NY Harbor ULSD (diesel) | $2.280/gallon | $4.332/gallon | +90.0% |
| Heating Oil | ~$2.133/gallon | $4.172/gallon | +95.6% |
| U.S. Gulf Coast Jet Fuel | $2.024/gallon | $3.766/gallon | +86.2% |
| WTI Crude | $63.78/bbl | $83.99/bbl | +31.7% |
New York Harbor ultra-low sulphur diesel has risen at nearly three times the rate of crude oil over this period. This ratio reflects the widening diesel crack spread — the margin between crude input cost and diesel output value. When refineries are running at 97.2% utilisation and distillate stocks are still declining, the market signals that processing capacity itself has become the binding constraint, not crude feedstock availability.
The Jet Fuel Paradox
The jet fuel picture contains an additional layer of complexity. U.S. Gulf Coast jet fuel reached $3.766 per gallon on August 14, 2026, up from $3.445 the prior week and nearly double the $2.024 recorded a year earlier. What makes this price trajectory analytically unusual is that it occurred against a backdrop of apparent demand softness. Four-week jet fuel product supplied fell 6.3% year-over-year, while jet fuel inventories actually rose from 43.3 million to 46.2 million barrels.
Jet fuel prices are not being driven by jet fuel fundamentals. They are being transmitted upstream from crude geopolitics and midstream from structural distillate deficits. The jet fuel market is absorbing price pressure from forces that originate outside its own supply-demand balance.
The Geopolitical Architecture Behind Brent's Risk Premium
The Strait of Hormuz carries approximately 20% of global seaborne oil trade, making it one of the most consequential maritime chokepoints in the global energy system. The current pricing environment reflects the market's assessment that disruption risk, whilst not yet materialised into a full supply stoppage, remains a credible forward scenario.
The diplomatic stalemate surrounding Iran's energy sector has introduced a forward-looking risk premium into Brent pricing that is not captured in current inventory data. Saxo Bank analysts have noted that further disruption to regional energy transit corridors could amplify price pressure across both crude and refined-product markets. Furthermore, BankPro CEO Paolo Broccardo has identified fading prospects for a near-term diplomatic resolution as the primary mechanism sustaining oil's geopolitical premium.
Two features of this geopolitical premium are particularly important for forward price analysis:
- Even a full diplomatic breakthrough would require weeks to months before Iranian supply volumes returned to market at meaningful scale, meaning geopolitical resolution would not produce an immediate price normalisation.
- The distillate deficit would persist independently of any crude supply resolution, because refineries are already at 97.2% utilisation and have no capacity headroom to accelerate distillate production even if crude feedstock costs declined.
The next major ASX story will hit our subscribers first
What Distillate Tightness Means for Mining and Industrial Operations
The refined-product price environment is not merely an energy market abstraction. For fuel-intensive industries, middle distillate prices function as a direct operating cost variable with immediate impact on project economics. These pressures are directly relevant to understanding commodity prices and mining performance across the sector.
Diesel is the primary energy input for surface mining operations, heavy haulage fleets, and bulk materials transport. When diesel prices rise 90% year-over-year, operating cost assumptions built into feasibility studies and project budgets from twelve months ago are materially incorrect. This is not a marginal adjustment; it is a structural repricing of one of mining's largest variable cost categories.
Remote Operations: A Compounding Exposure
Remote mining operations face a compounding exposure structure:
- Aviation fuel costs for fly-in/fly-out workforces, now at $3.766/gallon, have nearly doubled year-over-year
- On-site diesel costs for equipment, haulage, and power generation have risen approximately 90%
- Unlike integrated producers with road access to distribution networks, remote operations typically procure aviation fuel near spot pricing, amplifying exposure to short-term price spikes
- Bulk diesel procurement and hedging strategies available to accessible operations are frequently unavailable or impractical at remote sites
The operating copper mine costs in fuel-intensive jurisdictions illustrate how dramatically these distillate pressures can reshape project viability. In addition, definitive feasibility studies completed prior to this distillate repricing cycle will require material cost revisions. Cost modelling for remote resource projects should now incorporate a distillate risk premium of approximately 13% above historical average pricing until inventory normalisation is confirmed through consecutive weekly builds.
These resource and energy export challenges are compounding across multiple commodity sectors simultaneously, further complicating project economics for operators exposed to elevated fuel costs.
The Two-Indicator Monitoring Framework for Refined-Product Direction
For investors and operational planners tracking refined-product price direction, Brent crude alone is an insufficient signal. The following two-indicator framework provides a more reliable approach to monitoring when distillate tightness begins to ease.
| Signal | Current Status | Predictive Reliability for Fuel Costs |
|---|---|---|
| Brent crude price | $93.50/bbl (geopolitically elevated) | Moderate — composite signal, not fuel-specific |
| U.S. crude inventories | At five-year average (428.8M bbl) | Low — normalised, no scarcity signal |
| Distillate inventories | 13% below five-year average (105.6M bbl) | High — direct refined-product tightness indicator |
| Refinery utilisation | 97.2% — near capacity ceiling | High — confirms no near-term supply relief |
| Diesel crack spread | Diesel +90% YoY vs. crude +32% YoY | High — structural margin expansion confirmed |
Indicator One: Distillate inventory trajectory. The baseline is 105.6 million barrels as of the week ending August 14, 2026. Two consecutive weekly builds whilst refinery utilisation holds above 96% would represent the first credible signal that refined-product tightness is beginning to ease. A single weekly build is insufficient; two consecutive builds under high utilisation conditions are required to suggest that production is genuinely outpacing consumption.
Indicator Two: Refinery utilisation rate. Sustained operation above 96% is necessary but not sufficient for inventory normalisation. A drop below this threshold whilst distillate inventories remain depressed would indicate that the deficit is widening, as lower throughput would reduce the rate of distillate production without a corresponding demand reduction.
The scenario analysis below captures the three most likely near-term outcomes:
| Scenario | Distillate Inventory Outcome | Implied Fuel Cost Direction |
|---|---|---|
| Two consecutive weekly builds above 96% utilisation | Stocks approach 110-112M barrels | Diesel and jet fuel price pressure eases |
| Flat or declining distillate stocks | Deficit widens beyond 13% | Sustained or higher refined-product prices |
| Geopolitical escalation involving Hormuz disruption | Crude and distillate stocks both tighten | Acute upside price risk across all petroleum products |
Frequently Asked Questions: Brent Oil Prices and Distillate Inventories
Why are distillate inventories 13% below average when refineries are running at 97.2% capacity?
High refinery utilisation increases total output but does not guarantee proportional distillate yield. Output allocation between gasoline, diesel, and jet fuel depends on refinery configuration, the crude slate being processed, and seasonal demand patterns. At 97.2% utilisation, the industry is producing as much distillate as current configurations allow, but export demand and domestic consumption are absorbing that production faster than it can accumulate in storage.
What is the diesel crack spread, and why does it matter?
The diesel crack spread is the price differential between crude oil input cost and diesel output value. When this spread widens, diesel becomes more expensive relative to crude, which benefits integrated refiners but compresses margins for fuel-intensive industries. The current 90% year-over-year diesel price increase against a 32% crude price increase represents significant crack spread expansion, confirming that refinery and logistics constraints — rather than crude supply — are the primary cost driver.
When would distillate prices begin to ease?
The most reliable leading indicator is two consecutive weekly distillate inventory builds whilst refinery utilisation remains above 96%. A geopolitical resolution reducing the Hormuz risk premium would provide secondary downward pressure on crude input costs, but would not immediately resolve the structural distillate deficit given current capacity constraints.
How does jet fuel pricing affect remote mining operations specifically?
Remote mining operations relying on fly-in/fly-out workforces and chartered freight aircraft face direct exposure to jet fuel spot pricing. With Gulf Coast jet fuel at $3.766/gallon, nearly double year-ago levels, aviation-related operating costs have increased substantially. Unlike diesel, which can sometimes be hedged or procured in bulk, aviation fuel for remote charters is typically priced close to spot, amplifying cost volatility and reducing the effectiveness of procurement hedging strategies.
Is it possible for Brent to fall significantly while diesel prices remain elevated?
Yes, and this is precisely the scenario the two-tier framework anticipates. If a diplomatic breakthrough reduced the geopolitical risk premium embedded in Brent, crude prices could correct meaningfully whilst distillate inventories remain 13% below average and refineries remain at capacity. In that scenario, diesel and jet fuel prices would remain structurally supported even as headline crude fell, because the refined-product tightness would persist independently of the crude price signal.
The Distillate Deficit as the Defining Market Variable
The analytical conclusion from the August 2026 petroleum data is clear: Brent oil prices and distillate inventories must be tracked together, not separately, to understand the true pricing environment for petroleum products.
U.S. crude inventories at 428.8 million barrels have normalised to their five-year average, removing the crude scarcity argument for elevated Brent prices. However, distillate inventories at 105.6 million barrels remain approximately 13% below the five-year seasonal average, representing genuine supply tightness in the downstream petroleum complex. Refineries operating at 97.2% of operable capacity have no remaining throughput buffer to accelerate distillate production. Diesel has risen 90% year-over-year and jet fuel has nearly doubled, both outpacing crude by a factor of approximately three.
The August 26 EIA distillate inventory report represents the next critical data point against the 105.6 million barrel baseline. Until two consecutive weekly builds are confirmed under high refinery utilisation conditions, the structural case for elevated middle-distillate prices remains intact, regardless of what Brent crude does in response to diplomatic developments or geopolitical fluctuations.
Investors and operational planners relying on Brent as a proxy for diesel and jet fuel cost exposure are systematically underestimating refined-product risk when the crude-distillate spread is widening. The distillate inventory figure, not the crude headline, is the number that matters most right now.
This article is intended for informational purposes only and does not constitute financial advice. Commodity price data, inventory figures, and utilisation rates referenced are derived from the U.S. Energy Information Administration's weekly Petroleum Status Report. Forecasts and scenario analyses represent analytical frameworks, not guaranteed outcomes. Readers should conduct independent due diligence before making investment or operational decisions based on petroleum market data.
Want to Spot the Next Major Commodity Discovery Before the Market Does?
While distillate deficits and refinery constraints reshape operating costs across fuel-intensive sectors, Discovery Alert's proprietary Discovery IQ model scans ASX announcements in real time, instantly identifying significant mineral discoveries across more than 30 commodities — including those most exposed to shifting energy economics. Explore historic examples of major discovery returns and begin your 14-day free trial at Discovery Alert to position yourself ahead of the broader market.