
June 16, 2026
The Hidden Architecture of Oil Pricing: How Geopolitical Risk Premiums Work
Most casual observers of energy markets focus on crude oil market dynamics when trying to understand crude oil prices. Yet for much of 2026, a largely invisible force has been doing at least as much work as any barrel produced or consumed. That force is the geopolitical risk premium, and its mechanics explain why Brent oil falls below $80 on U.S.-Iran peace deal hopes as dramatically as it does when diplomatic progress emerges.
The risk premium is not a formal line item on any exchange. It is an emergent property of market psychology, embedded into benchmark prices whenever conflict threatens major energy transit routes. When traders collectively assign meaningful probability to supply disruption, they pre-emptively price in scarcity that has not yet materialised. The reverse is equally true: when credible peace signals arrive, that premium deflates rapidly, often faster than the underlying supply situation actually changes.
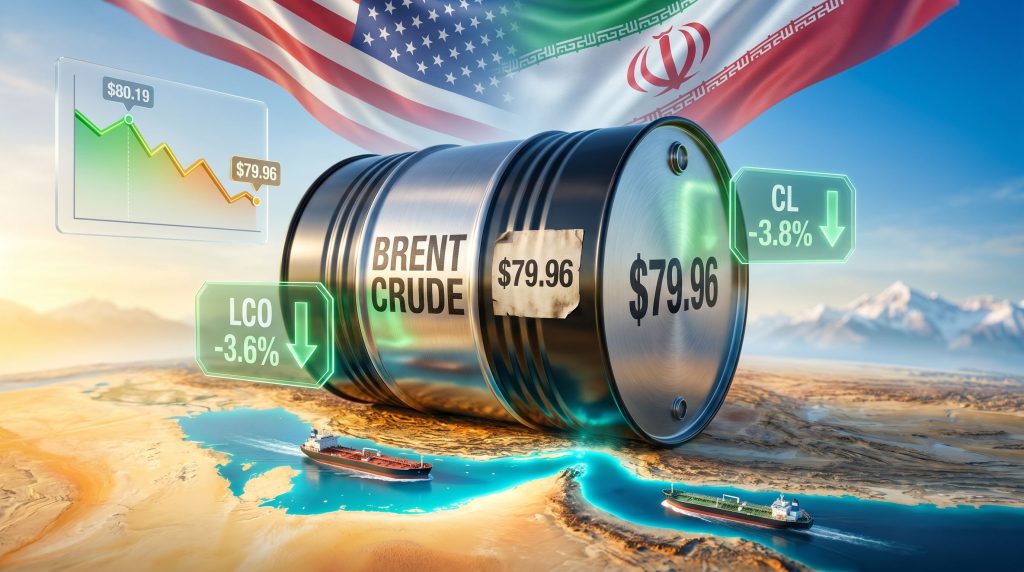
This dynamic played out with striking clarity on June 16, 2026, when Brent crude briefly touched $79.96 per barrel, its first print below the $80 threshold since March 2026. The move was not driven by a sudden surge in inventories or a collapse in demand. It was driven by a shift in probability assessments about a single waterway that most people could not locate on a map.
When big ASX news breaks, our subscribers know first
The Strait of Hormuz: A Chokepoint That Functions as a Pricing Mechanism
To understand why a diplomatic agreement between Washington and Tehran can reprice global crude within hours, it helps to understand the physical and economic geography of the Strait of Hormuz. This narrow passage connecting the Persian Gulf to open ocean shipping lanes carried approximately 20% of the world's total oil supply in transit prior to the conflict that began in late February 2026. No other single maritime chokepoint comes close to that concentration of energy flow.
The strait's importance is not just volumetric. It is structural. Oil exported from Saudi Arabia, Iraq, Kuwait, the UAE, and Qatar all moves through this passage. When transit is unrestricted, the global oil market functions with a degree of fluidity that keeps prices anchored closer to their fundamental supply-and-demand equilibrium. When transit is threatened, the premium embedded in prices can range from $5 to more than $20 per barrel above what underlying fundamentals would justify.
Furthermore, the geopolitical oil risks associated with this region extend well beyond the strait itself, influencing insurance premiums, freight costs, and downstream product pricing across multiple continents.
The Strait of Hormuz operates less like a shipping lane and more like a global pricing valve. When it opens, value flows out of the risk premium and back to consumers. When it closes, markets price in scarcity before a single barrel is actually lost.
The conflict that emerged in late February 2026 introduced sustained uncertainty into Hormuz transit, keeping Brent above $80 for months and injecting volatility into downstream energy products across Asia and Europe. The provisional U.S.-Iran agreement announced on Sunday, June 14, 2026 began to unwind that premium systematically.
What the U.S.-Iran Provisional Agreement Actually Contains
The framework reached between Washington and Tehran on June 14 established a 60-day ceasefire extension and included provisions for the full reopening of the Strait of Hormuz to international shipping, free of Iranian transit tolls. A formal signing ceremony was announced for Friday, June 20, 2026, in Geneva, with U.S. President Donald Trump confirming at the G7 summit that the peace framework had been signed and that Hormuz would completely reopen by that date.
Further details of the memorandum of understanding were expected to be disclosed at the G7 leaders' summit in Évian-les-Bains, France, which began June 16. The summit became the primary venue through which multilateral endorsement of the agreement was being sought, giving the framework additional diplomatic weight that markets were actively pricing.
The market response to these developments was swift and substantial:
| Benchmark | Price on June 16, 2026 | Daily Change | Notable Context |
|---|---|---|---|
| Brent Crude (LCO) | ~$80.19/bbl (low: $79.96) | -3.6% | First sub-$80 print since March 2026 |
| WTI Crude (CL) | ~$77.71/bbl | -3.8% | Broke below $80 threshold intraday |
| Brent (alternate tracker) | ~$81.48/bbl | -2.03% | Reflects partial intraday recovery |
Critically, the prior trading session had already seen Brent fall more than 4% to a two-month low, meaning markets began unwinding the risk premium before official confirmation arrived. By June 16, investor confidence in the agreement's durability was sufficient to extend those losses further.
The Gap Between Diplomatic Progress and Operational Normalization
Here lies the most important and least-discussed dimension of the current oil market setup: the difference between what politicians agree to and what shipping operators are willing to act on.
Jotaro Tamura, the Chief Executive of Mitsui OSK Lines, the world's largest tanker operator, made clear to the Financial Times on June 16 that many operators could wait weeks before allowing their vessels to resume transit through the Strait. His position was that the formal agreement between governments represents only the beginning of a process, not its conclusion. What operators require is verifiable, on-the-ground evidence that security conditions in the Strait have normalised, not just diplomatic commitments that may or may not translate into physical reality.
Hapag-Lloyd, the German container shipping giant, took a somewhat more optimistic tone, welcoming the prospect of a peace agreement as positive for its crews and customers. The company expressed hope that its four remaining vessels in the region would be able to transit the Strait by the weekend, though it stopped short of formally confirming resumed routing.
This divergence between shipping operators reflects a broader market tension that investors should not overlook. The oil price decline assumes a relatively smooth transition from agreement to operational normalisation. If that transition drags, prices could partially recover as the market recalibrates.
Key Risks That Could Reverse the Decline
- Implementation delays or failure to translate diplomatic terms into verifiable security conditions on the water
- Renewed hostilities or proxy actions that undermine the credibility of the ceasefire framework
- Collective caution from tanker operators who maintain alternative Cape of Good Hope routing, sustaining elevated freight costs
- OPEC's market influence and production policy adjustments that offset any supply increase from restored Hormuz flows
- Ambiguity in the agreement's verification mechanisms, leaving shipping operators without the confidence needed to re-enter Hormuz transit lanes
Three Scenarios for Oil Prices From Here
The current environment is unusually binary in its risk distribution. The base case and the tail risk sit at meaningfully different price levels, with the outcome hinging on factors that are only partially within any single actor's control.
Scenario A: Full Implementation (Base Case)
If the Strait of Hormuz reopens on schedule and major tanker operators formally resume normal routing within two to four weeks, the geopolitical risk premium should deflate fully. Under this scenario:
- Brent crude stabilises in the $75-$80/bbl range
- Global oil transit capacity effectively restores 15-20 million barrels per day in flow
- Downstream products including diesel, jet fuel, and LNG begin moderating in Asian and European import markets
- The G7 and Geneva frameworks receive multilateral endorsement, reducing collapse probability
Scenario B: Partial Implementation or Stalled Agreement (Risk Case)
If implementation delays signal agreement fragility, or if shipping operators maintain alternative routing for longer than anticipated:
- Brent rebounds toward $83-$87/bbl as partial risk premium re-enters
- Freight cost pressures from Cape of Good Hope routing persist
- Market volatility increases around G7 and Geneva signing developments
Scenario C: Agreement Collapse (Tail Risk)
A breakdown in the ceasefire framework represents a low-probability but high-impact scenario:
- Brent could return above $90/bbl rapidly
- IEA strategic petroleum reserve release discussions resurface in Washington and Brussels
- Shipping operators fully abandon Hormuz routing, compounding the supply shock
Analysts monitoring the situation have noted that price trajectory is unlikely to be linear. Even in a generally constructive scenario, episodic uncertainty around implementation milestones creates conditions for short-term volatility.
What Sub-$80 Brent Means Across the Global Economy
The implications of sustained sub-$80 Brent pricing ripple well beyond oil futures trading desks. Indeed, the fact that Brent oil falls below $80 on U.S.-Iran peace deal hopes has tangible consequences for economies on every continent.
For oil-importing economies, the arithmetic is straightforwardly positive. Nations including India, China, Japan, and South Korea collectively account for a substantial portion of Middle Eastern crude demand, and lower import prices reduce energy cost pressure on consumers and manufacturers alike. Central banks in these economies gain modest additional flexibility on monetary policy if energy-driven inflation components ease.
For oil-exporting nations and sovereign budgets, the picture is more complicated. Several OPEC member states operate with fiscal breakeven prices in the $80-$85/bbl range, including Saudi Arabia. Sustained trading below these thresholds creates budget pressure and accelerates the timeline for OPEC+ discussions about production adjustments. Russia, whose energy export revenues are already constrained by sanctions infrastructure, faces additional compression.
For investors and financial markets, three areas warrant particular attention:
- Energy sector equities typically track crude benchmark pricing with reasonable fidelity. A sustained sub-$80 Brent environment creates earnings headwinds for upstream producers, particularly those with higher break-even production costs.
- Refining margins may improve temporarily as feedstock cost declines outpace product price adjustments, creating a brief window of opportunity in downstream-focused positions.
- Commodity-linked currencies including the Canadian dollar, Norwegian krone, and Australian dollar tend to weaken relative to the USD in sustained oil price decline environments, a dynamic worth monitoring for cross-asset portfolio managers.
The next major ASX story will hit our subscribers first
What Investors Should Watch as Leading Indicators
The oil market's near-term direction will be shaped less by headline announcements and more by a set of operational signals that are often underweighted in mainstream coverage. Understanding the key oil price drivers beyond diplomatic headlines is consequently essential for informed decision-making.
- Tanker re-routing announcements: When major operators formally update their routing protocols to include Hormuz transit, that represents the clearest operational signal that normalisation is underway.
- Iranian naval repositioning: Visible movement of Iranian military and naval assets away from Hormuz transit lanes would provide the verifiable security evidence that shipping operators say they require.
- G7 and Geneva outcomes: Multilateral endorsement and successful completion of the formal signing ceremony reduce the probability of agreement collapse, further compressing the risk premium.
- OPEC+ emergency meeting signals: Any indication that member states are discussing output adjustments in response to restored Hormuz supply flows would introduce a countervailing upward price force.
- IEA inventory data: Weekly inventory reports from major consuming nations will begin to reflect any genuine supply restoration effect, providing a fundamental anchor for price direction.
However, the trade war oil impact on global demand forecasts remains an additional variable that could complicate any straightforward supply-driven price recovery or decline.
The June 2026 episode is a textbook illustration of how oil markets price risk prospectively and unwind that pricing rapidly when the risk landscape shifts. Whether the current decline represents a durable repricing or a temporary overshoot depends entirely on whether the gap between diplomatic agreement and operational normalisation closes on schedule. That is a question that shipping captains, not diplomats, will ultimately answer.
Disclaimer: This article is intended for informational purposes only and does not constitute financial advice. Oil price forecasts, scenario projections, and market analysis involve inherent uncertainty. Readers should conduct their own due diligence before making any investment decisions. All price data referenced is sourced from public market reporting as of June 16, 2026.
Want to Stay Ahead of the Next Major Resource Discovery?
While geopolitical risk premiums reshape global energy markets, Discovery Alert's proprietary Discovery IQ model scans ASX announcements in real time, delivering instant alerts on significant mineral discoveries so subscribers can identify actionable opportunities ahead of the broader market — begin your 14-day free trial today and gain a market-leading edge.