
August 5, 2026
The Hidden Geometry of Global Oil: How Chokepoints Become Crisis Multipliers
Every barrel of crude oil sold on world markets carries a silent variable in its price: the probability that it will actually arrive. Most of the time, this variable sits close to zero. But when military conflict converges on the world's most concentrated shipping corridors, that probability shifts fast, and so does the price of energy for every industrial operator on earth.
The Strait of Hormuz, a narrow passage between Iran and Oman measuring roughly 33 kilometres at its tightest navigable point, is the structural chokepoint through which approximately 20% of global oil and LNG flows must transit. No other single waterway carries this concentration of energy trade. When shipping through Hormuz faces genuine restriction, the consequences for fuel prices are not linear, they are exponential. Markets do not wait for closure confirmation. They price in the risk of closure, and that repricing can be violent.
Mid-2026 has demonstrated this dynamic in real time, with Brent crude oil prices surging through $86 per barrel and WTI climbing to $80.99 as US-Iran military exchanges escalated into infrastructure targeting across the Gulf. Understanding the mechanics behind these moves, their likely duration, and their downstream cost consequences for industries from refining to mining, requires moving well beyond headline price numbers. The crude oil trade geopolitics shaping these dynamics are complex and evolving rapidly.
When big ASX news breaks, our subscribers know first
Why This Conflict Cycle Is Structurally Different from Previous Gulf Crises
Experienced oil market participants have seen Gulf tension translate into price spikes before. The Iranian tanker harassment campaigns of 2019, the Houthi attacks on Saudi Aramco's Abqaiq facility that year, and earlier regional flare-ups each produced short-lived price premiums that faded within weeks as shipping lanes remained nominally open.
The current cycle differs along a critical dimension: infrastructure is being targeted directly, not merely threatened. Furthermore, the oil market disruption risks are compounding into mid-2026's sustained rally through a series of incidents, including:
- An Iranian strike on a Kuwaiti power and desalination facility, triggering fires across multiple generating units
- Tanker damage off the Omani coast, amplifying Gulf shipping security risk premiums
- US Central Command completing six consecutive nights of strikes on Iranian military and maritime infrastructure
- Iranian retaliatory strikes on US-linked targets across the Gulf
- A Qatari interception of an Iranian missile, signalling the conflict's geographic spread
- Drone attacks on UAE energy facilities near Fujairah, temporarily halting oil loadings
- US strikes on Iran's Kharg Island export terminal, disrupting direct crude export capacity
| Incident Type | Location | Market Impact |
|---|---|---|
| Iranian strike on power and desalination plant | Kuwait | Elevated Gulf supply anxiety |
| Tanker hull damage | Off Oman coast | Shipping insurance and security premium |
| US strikes on maritime infrastructure | Iran | Retaliatory risk escalation cycle |
| Drone attacks on energy facilities | Fujairah, UAE | Temporary oil loading suspension |
| US strikes on export terminal | Kharg Island, Iran | Direct crude export disruption |
Each of these events in isolation would produce a temporary market reaction. Their near-simultaneous occurrence across multiple Gulf nodes constitutes a multi-point supply disruption event, a category that markets have not priced through in modern history. The result has been a sustained, three-week rally in Brent, not a single episodic spike.
Anatomy of the Brent Oil Price Move: What the Numbers Actually Say
Price Action and Its Sequential Logic
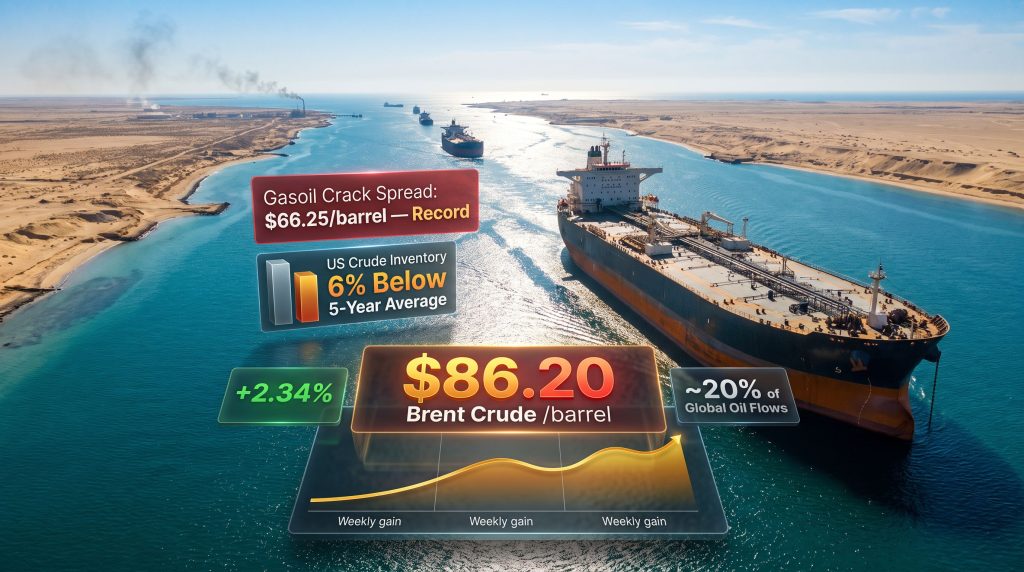
Brent crude reached $86.20 per barrel, representing a gain of 2.34% in the final trading session of the week, capping a weekly advance of approximately 13%. WTI tracked closely, gaining 2.4% to reach $80.99 per barrel. Brent recorded its third consecutive weekly gain; WTI its second.
These are not speculative momentum trades. They reflect a market systematically reassessing the probability that Gulf supply will remain uninterrupted. As reported by Rigzone, oil has rebounded on fresh Middle East supply risk pricing, reinforcing the sustained nature of this rally.
The market's term structure adds another layer of information. The shift from contango (where futures prices for later delivery exceed spot prices, typical of oversupplied markets) into backwardation (where prompt delivery commands a premium over deferred contracts) is a trader's signal that near-term supply availability is perceived as tighter than future availability. Backwardation in mid-2026 Brent is not a forecast of permanently higher prices; it is a real-time verdict that the market's immediate supply buffer has shrunk.
The Inventory Backdrop That Amplifies Every Disruption
The geopolitical shock did not land on a well-stocked market. According to the US Energy Information Administration, commercial crude inventories as of the week ending July 10, 2026, stood approximately 6% below the five-year seasonal average. An earlier reporting period had shown inventories running 7% below the five-year average, indicating that the supply buffer deficit was not new.
Low inventories do not cause price spikes, but they dramatically amplify the price sensitivity of any supply disruption. A market carrying a 10% buffer above seasonal norms can absorb a moderate shortfall with modest price movement. A market running 6–7% below average has almost no absorptive capacity. Every barrel that does not reach its destination must be replaced at the margin, at whatever price clears the market.
This structural inventory deficit is why Brent oil price Middle East supply risks have translated into a 13% weekly move rather than a 3–4% bump followed by rapid correction.
The Record Diesel Crack Spread: A Metric That Reaches Far Beyond the Pump
What a $66.25 Crack Spread Actually Means
The gasoil-over-Brent crack spread, a refining industry metric measuring the margin earned from converting a barrel of crude oil into diesel fuel, reached a record $66.25 per barrel during mid-July 2026. To contextualise this figure: in a normalised market, crack spreads typically range between $15 and $30 per barrel depending on refinery configuration and seasonal demand patterns. A spread at more than double that upper bound signals severe, acute diesel supply tightness that cannot be resolved quickly.
The mechanism driving this record reading involves two simultaneous compressions:
- Refinery disruptions across the Gulf (including the suspension of operations at Saudi Arabia's largest refinery) reduced the throughput of crude into finished products
- Shipping lane restrictions around Hormuz and adjacent Gulf routes prevented available diesel from reaching import-dependent markets efficiently
When both supply and logistics are simultaneously constrained, the crack spread does not merely widen, it disconnects from historical norms entirely. The oil logistics risk factors underlying this dislocation deserve close attention from any operator with diesel-dependent operations.
The Mining Sector's Direct Exposure
The crack spread's significance extends well beyond refining economics. Diesel is the primary energy input for off-grid and remote mining operations globally, including haul trucks, excavators, ore processing equipment, and on-site power generation. Unlike grid-connected industrial facilities, most operating mines cannot rapidly substitute diesel with alternative energy sources.
This creates a direct and immediate cost transmission channel from Brent oil price Middle East supply risks to mining sector operating margins:
- Operations purchasing diesel at spot prices absorb the full geopolitical surcharge embedded in the record crack spread
- Companies with fixed-price fuel contracts established before the 13% weekly oil price increase maintain a structural cost advantage for the contract duration
- Mining operations without fuel hedging strategies are, in effect, running an unhedged exposure to geopolitical risk in the Gulf, a risk that many project financial models do not explicitly account for
The $66.25 gasoil crack spread is not a refining industry abstraction. It is a real-time cost pressure indicator for any industrial operator purchasing diesel at spot prices, representing a geopolitical surcharge that arrives on the operating cost line before management can respond.
The IEA's Executive Director Fatih Birol has indicated publicly that oil security risks could deteriorate further over the coming weeks, a forward-looking assessment that mining operators should weigh directly when evaluating near-term fuel procurement strategy and hedging decisions. In addition, understanding gas price spillover effects across interconnected energy markets adds further context to the scale of this challenge.
The Two-Scenario Framework: Resolution or Escalation
What Markets Are Currently Pricing
The current Brent price above $86 per barrel embeds a geopolitical risk premium of approximately $4 per barrel above the pre-escalation baseline. Whether this premium expands, stabilises, or reverses depends primarily on two variables: the trajectory of US-Iran diplomatic engagement, and the status of Red Sea shipping routes.
| Variable | Base Case: Diplomatic Resolution | Escalation Scenario: Conflict Deepens |
|---|---|---|
| Brent Price Trajectory | Partial reversal of 13% weekly gain | Extension of rally; potential $120–$150 range |
| Diesel Crack Spread | Narrows from record $66.25 | Widens further as disruptions persist |
| Hormuz Traffic | Gradual normalisation over weeks | Sustained restriction or closure |
| Red Sea / Bab al-Mandab | Remains open | Potential Houthi-directed closure |
| Market Confidence in Base Case | Moderate, weakened by truce collapse | Low; escalation probability rising |
The Rystad Base Case and Its Weaknesses
Rystad Energy's primary scenario centres on a limited Washington-Tehran diplomatic agreement that would reverse a portion of the recent weekly price gains and narrow the diesel crack spread back toward normalised levels. However, the collapse of the prior month's ceasefire has materially weakened confidence in this outcome. A truce that lasted weeks before breaking down signals that neither party has yet reached the negotiation threshold where a durable agreement becomes likely.
President Trump's publicly stated timeline of progress within the following week introduces a defined diplomatic window, but this remains an expressed intention rather than a confirmed diplomatic outcome. Markets are pricing this uncertainty explicitly.
The Red Sea Escalation Variable
Reports have emerged indicating Iran may have communicated instructions to Yemen's Houthi movement to prepare for a potential Red Sea closure if US forces strike Iranian power infrastructure directly. These reports, while unverified by multiple major news organisations, have introduced a second-order risk into market pricing.
Commerzbank analysts have highlighted that Saudi Arabia has already redirected significant export volumes toward Red Sea shipping routes, treating this corridor as the primary alternative to Hormuz. If Bab al-Mandab, the southern entrance to the Red Sea, were to face blockade conditions, Saudi Arabia would simultaneously lose access to both its primary and alternative export corridors.
The compounding supply disruption this would represent is precisely the scenario underpinning the Bernstein escalation forecast of $120–$150 per barrel. Bernstein's base case 2026 Brent forecast has already been revised upward to $80 per barrel, reflecting an acknowledgement that even a resolved conflict leaves a structurally repriced market in its wake.
The Multi-Node Production Shutdown: Why This Is Not a Single-Point Disruption
Simultaneous Regional Supply Suspensions
What makes the mid-2026 oil supply situation analytically distinct is the simultaneous nature of production and logistics disruptions across multiple independent nodes:
- Qatar halted LNG production during peak escalation, removing a key source of global gas supply
- Saudi Arabia's largest refinery suspended operations, reducing regional diesel and jet fuel output
- Iraqi Kurdistan output fell to near-zero amid regional security conditions
- Iranian crude exports from Kharg Island faced direct disruption from US strikes
These are not cascading failures from a single point of failure. Each represents an independent operational decision or security-driven suspension that would, in isolation, produce a moderate market impact. Their combination creates a supply picture that OPEC+ headline production quotas cannot address, because the issue is not quota allocation but physical accessibility and logistics.
Why OPEC+ Output Decisions Have Not Relieved the Market
Prior OPEC+ announcements of output increases failed to lift available supply meaningfully. Saudi Arabia's decision to accelerate approximately 17 million barrels to market in early July 2026, when Brent was trading near $72, demonstrated both the kingdom's willingness to use spare capacity and the limits of that strategy against a geopolitically driven disruption.
By mid-July, the geopolitical premium had overwhelmed that supply response entirely. The analytical gap between OPEC+ headline decisions and actual market availability has become one of the most consequential distinctions for oil price forecasting in the current environment.
The next major ASX story will hit our subscribers first
Three Indicators That Define the Next Phase of This Market
For investors, mining operators, and energy analysts tracking Brent oil price Middle East supply risks, three metrics provide the clearest signal of directional change:
1. ICE Brent September 2026 Futures Contract
The front-month Brent contract provides the most direct read on current supply risk pricing. Sustained trading above $86 per barrel indicates the market has not yet priced in a credible diplomatic resolution. A sustained break below $82 would signal that risk premium is beginning to unwind.
2. Gasoil-Brent Crack Spread
A crack spread near or above $66.25 per barrel signals acute diesel supply tightness. Narrowing of this spread is an early indicator that refinery operations and Gulf shipping are beginning to normalise. For mining operators, this is the single most actionable metric for near-term fuel cost forecasting. Consequently, exploring commodity hedging strategies becomes an essential component of any risk management framework during periods of sustained market dislocation.
3. EIA Weekly Petroleum Status Report
Published weekly by the US Energy Information Administration, this report tracks commercial crude inventory levels against the five-year seasonal average. Inventory builds toward the five-year average signal reduced supply vulnerability; further draws reinforce upside price risk and suggest the market's buffer remains dangerously thin.
ING analysts have cautioned that markets may be underestimating both the duration of supply disruptions and the time required to restore Hormuz shipping flows to full normalcy, even under optimistic diplomatic scenarios. Mine-clearing operations in Hormuz shipping lanes, if required, could take several weeks under best-case conditions, meaning that some supply restriction may persist beyond any diplomatic breakthrough. Commonwealth Bank's oil market explainer provides useful background context for those seeking a broader understanding of how these structural dynamics typically play out.
Key Metrics at a Glance: Brent Oil and Middle East Supply Risk, July 2026
| Metric | Value | Market Significance |
|---|---|---|
| Brent Crude Price | $86.20/barrel (+2.34%) | One-month high; third consecutive weekly gain |
| WTI Crude Price | $80.99/barrel (+2.4%) | Second consecutive weekly gain |
| Weekly Price Gain (Brent and WTI) | ~13% | Largest weekly move in current conflict cycle |
| Gasoil-Brent Crack Spread | $66.25/barrel (record) | Acute diesel supply tightness signal |
| Hormuz Share of Global Oil Flows | ~20% | Primary chokepoint vulnerability |
| US Crude Inventories vs. 5-Year Average | ~6% below average | Low buffer amplifies supply shock sensitivity |
| Bernstein 2026 Brent Base Forecast | $80/barrel | Raised amid sustained conflict risk |
| Bernstein Extreme Escalation Scenario | $120–$150/barrel | Prolonged Hormuz and Red Sea closure |
| Geopolitical Risk Premium (Estimated) | ~$4/barrel | Market pricing of supply constraint probability |
Frequently Asked Questions
What drove Brent crude above $86 per barrel in July 2026?
A convergence of Iranian strikes on Gulf infrastructure, US military operations against Iranian maritime assets, tanker damage in the Gulf of Oman, and escalating disruption risk around the Strait of Hormuz drove a sustained multi-week rally. The move was amplified by US crude inventories running approximately 6% below the five-year seasonal average.
Why does the diesel crack spread matter for non-refining industries?
The crack spread measures how much more expensive diesel is relative to crude oil. When it reaches record levels like $66.25 per barrel, it signals that diesel is acutely scarce relative to demand, with direct cost consequences for any industry purchasing diesel at spot prices, including mining, agriculture, and freight transport.
What would cause Brent oil prices to fall from current levels?
Rystad Energy's base case points to a verifiable Washington-Tehran diplomatic agreement as the primary catalyst for price reversal. Such an agreement would be expected to narrow the diesel crack spread, reduce shipping risk premiums, and partially unwind the 13% weekly gain embedded in current Brent pricing.
What is the worst-case scenario for Brent crude?
Bernstein analysts identify simultaneous prolonged closure of both the Strait of Hormuz and the Red Sea Bab al-Mandab passage as the extreme scenario, potentially pushing Brent into the $120–$150 per barrel range. This scenario requires both the failure of US-Iran diplomacy and confirmation of Houthi Red Sea blockade instructions from Iran.
Disclaimer: This article contains forward-looking scenarios, price forecasts, and analytical frameworks drawn from publicly available market research and media reporting. These do not constitute financial advice. Commodity price movements involve significant uncertainty, and actual outcomes may differ materially from forecasts cited. Readers should conduct independent research and consult qualified financial advisers before making investment or operational decisions based on commodity price projections.
Want to Turn Energy Market Volatility Into Actionable Investment Opportunities?
When geopolitical shocks send commodity markets into rapid repricing cycles, Discovery Alert's proprietary Discovery IQ model delivers real-time alerts on significant ASX mineral discoveries, empowering subscribers to identify and act on high-potential opportunities before the broader market catches up — explore historic discoveries and their returns to see what early positioning can mean, then begin your 14-day free trial at Discovery Alert to secure your market-leading edge.