July 22, 2026
When Geography Becomes Destiny: How Chokepoints Determine the Price of Oil
Every barrel of crude oil that moves from a producing nation to a refinery must pass through a finite number of maritime corridors. These geographic bottlenecks, carved by continents and coastlines rather than engineered by markets, hold more influence over global energy prices than any single producer, cartel decision, or macroeconomic cycle. When those corridors become contested, the entire architecture of global oil pricing shifts beneath the feet of every industry that runs on fuel.
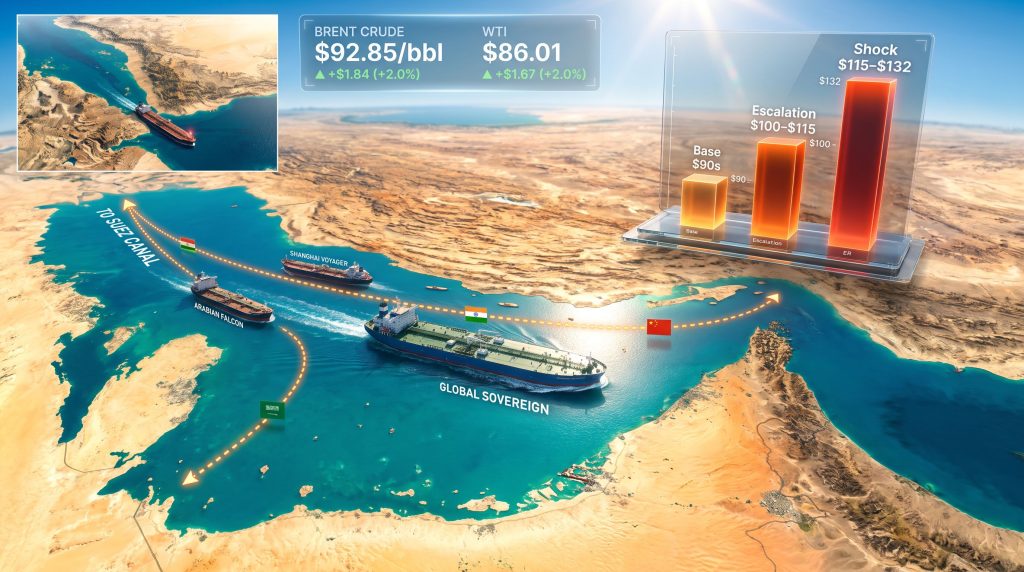
That reality is now playing out in real time. The Brent oil price Red Sea disruptions and Strait of Hormuz closure have driven Brent crude to $92.85 per barrel, a rise of $1.84 or 2.0% in a single session, reaching its highest level since June 11. WTI tracked in parallel, adding $1.67 (2.0%) to reach $86.01, its strongest level since June 12. Over the course of the month, Brent has advanced more than 25%. These numbers reflect confirmed, physical changes to how crude oil is actually moving around the planet.
When big ASX news breaks, our subscribers know first
The Anatomy of a Real Supply Disruption vs. a Fear Premium
Oil markets have a long history of pricing in geopolitical anxiety that ultimately never materialises into actual supply loss. Prices spike on news, then retrace as tankers continue sailing their usual routes. The current environment is structurally different, and that distinction carries significant implications for how long elevated prices will persist.
Three separate tankers loaded with Saudi crude and bound for China and India have physically reversed course in the Red Sea following Houthi threats targeting vessels carrying Saudi oil shipments. These ships did not merely slow down or take a precautionary detour. They rerouted through the Suez Canal, adding substantial transit distance, time, and freight cost to every barrel they carry. The crude bound for Asia's two largest import markets is now taking longer and costing more to deliver.
Simultaneously, the Caspian Pipeline Consortium (CPC) has suspended Kazakh oil receipts after attacks on tankers forced a halt to crude loadings at its Black Sea terminal. This is a second, entirely separate supply corridor under pressure at the same moment. ING commodity strategists have noted that prolonged Red Sea diversions compound shipping costs and reduce the delivery efficiency of crude to Asia. Furthermore, a sustained CPC suspension risks forcing Kazakhstan to curtail upstream production altogether, removing additional barrels from global supply rather than merely delaying their arrival.
Understanding the broader crude oil price trends helps contextualise just how significant this simultaneous multi-corridor pressure truly is.
When two major export corridors face simultaneous disruption, the market is no longer pricing a single-point risk premium. It is repricing the baseline cost of moving oil from where it is produced to where it is consumed.
The Bab el-Mandeb Strait: Saudi Arabia's Compromised Southern Exit
To understand why Saudi crude tankers are reversing course, the geography of the Bab el-Mandeb Strait matters enormously. This narrow waterway, roughly 30 kilometres wide at its most constrained point, connects the Red Sea to the Gulf of Aden and serves as the southern gateway through which Persian Gulf crude flows toward Asia and Europe.
Following the collapse of the US-Iran ceasefire earlier in July 2026, traffic through the Strait of Hormuz fell sharply, prompting Saudi Arabia to redirect more of its crude exports through the Bab el-Mandeb corridor. That corridor has now itself become effectively impassable for Saudi oil shipments, creating a compounding geography problem: the primary and secondary exit routes for Persian Gulf crude are both under simultaneous threat.
The trade war impact on oil compounds these physical disruptions, adding further layers of market uncertainty. The historical context makes the current situation even more striking. Previous Red Sea disruption episodes typically produced Brent price increases of approximately 1 to 4% before normalising once vessels successfully rerouted. What has changed in 2026 is that the US has conducted strikes on Iranian targets for 11 consecutive nights, Iran has retaliated with strikes on US facilities in Bahrain, Kuwait, and Jordan, and the conflict has no visible de-escalation pathway in the immediate term.
How Red Sea Disruption Compares Across Escalation Scenarios
| Disruption Scenario | Brent Price Impact | Market Behaviour |
|---|---|---|
| Red Sea tanker diversion only | +1 to 4% daily moves, Brent in $77-$85 range | Shipping risk premium, often reverses on route normalisation |
| Sustained Red Sea blockade + CPC suspension | Brent holds in low-to-mid $90s | Physical tightening with limited near-term reversal |
| Strait of Hormuz partial restriction | $100 to $115/bbl | Insurance costs spike, throughput constrained |
| Full Hormuz closure, extended duration | $115 to $132/bbl (WTI); Brent near $115 | Structural global supply shock |
| Infrastructure damage + prolonged closure | $170 to $200/bbl (tail risk estimates) | Terminal or pipeline damage scenario |
The Strait of Hormuz: Why One Waterway Controls the Global Energy System
The Strait of Hormuz handles approximately one-fifth of all global oil and gas flows. No other chokepoint on Earth concentrates that volume of energy in such a narrow geographic corridor. The Bab el-Mandeb and the Suez Canal are consequential, but they affect routing. The Strait of Hormuz affects volume itself. There is no viable alternative pathway for Persian Gulf producers if the strait closes.
Unlike a Red Sea disruption where tankers can reroute around the Cape of Good Hope, a Hormuz closure physically removes supply from global markets with no detour available. Kpler has stated that a closure combined with ongoing Red Sea disruptions would be sufficient to push Brent above $100 per barrel.
Dallas Fed modelling suggests a closure removing approximately 20% of global oil supply could lift WTI to $98 per barrel in Q2 2026, with a prolonged shutdown potentially reaching $115 to $132 depending on duration. The EIA's own disruption scenario places Brent at a peak of $115 per barrel in Q2 2026, before easing below $90 per barrel in Q4 2026 as supply constraints gradually abate.
The World Bank's baseline anticipates Brent averaging approximately $86 per barrel in 2026, a figure that already appears conservative given current conditions. That baseline carries significant upside risk if Hormuz disruptions materialise at scale. Analysing oil's geopolitical drivers reveals just how deeply structural these risks have become.
Scenario Modelling: Brent at Each Escalation Level
| Scenario | Brent Price Range | Key Trigger |
|---|---|---|
| Base Case – Red Sea disruptions persist, Hormuz open | Low-to-mid $90s/bbl | Tanker rerouting and CPC suspension continue |
| Escalation Case – Hormuz partially restricted | $100 to $115/bbl | Reduced throughput, insurance costs surge |
| Shock Case – Full Hormuz closure, extended | $115 to $132/bbl | Approximately 20% of global oil supply removed |
| Extreme Tail Risk – Infrastructure damage + closure | $170 to $200/bbl | Terminal or pipeline damage, prolonged shutdown |
India's Compounding Exposure: Russian Oil Tariff Risk Meets Supply Chain Disruption
India occupies a particularly exposed position in the current environment. The country imported 2.6 million barrels per day during the first half of July 2026 and sourced more than 50% of its June crude imports from Russia, having built its refining economics around the discounted Russian barrels that became available following the 2022 sanctions landscape.
That dependency now carries a second layer of risk. Proposed 100% US tariffs on buyers of Russian oil, contingent on whether a Ukraine peace deal is reached by September 2026, would dramatically increase India's effective crude import cost if implemented. The compounding effect is significant: rising Brent prices from Middle East supply disruptions applied simultaneously with tariff-driven cost increases on the Russian barrels that currently underpin India's lowest-cost supply position.
India's response has included an accelerating ethanol blending programme, which Rystad Energy has identified as one of the most effective crude oil substitutes available to large importers. The rerouting of Saudi crude tankers originally destined for Indian refineries through the Suez Canal illustrates that supply chain diversification is already being forced on importers regardless of their strategic preferences.
$4.80 Diesel and the Downstream Cost Cascade Into Energy-Intensive Industries
The transmission mechanism from Brent crude to operating costs across energy-intensive industries is direct and well-established. US on-highway diesel averaged $4.796 per gallon as of July 13, 2026, up $1.038 year-over-year according to EIA Weekly Petroleum Status Report data. Off-highway diesel, used in mining haul trucks, site generators, and processing equipment, tracks the same crude price trajectory.
At Brent above $100 per barrel, diesel costs would almost certainly exceed the current national average, further compressing operating margins for any operator without fuel hedges secured at pre-escalation prices. Consequently, the operational exposure varies meaningfully by industry segment and fleet configuration.
Fuel Exposure by Industry Segment
| Industry Segment | Diesel Exposure Level | Available Mitigation |
|---|---|---|
| Open-cut mining, haul fleets | Very High – largest single fuel cost | Battery-electric, trolley-assist, fuel hedging |
| Underground mining, generators | High – continuous power demand | Hybrid systems, grid connection where viable |
| Long-haul freight and logistics | High – direct diesel cost pass-through | CNG, LNG, route optimisation |
| Refining and petrochemicals | Moderate – partially offset by higher product margins | Feedstock flexibility, product mix adjustment |
Indian automakers have already begun responding to sustained fuel price volatility by broadening their commercial vehicle platforms across compressed natural gas, hybrid, flex-fuel, and hydrogen-powered configurations. Mining operators face a directly analogous strategic challenge. The adoption of broader haul fleet power systems, including battery-electric, trolley-assist, and hydrogen-powered mining trucks where operationally viable, reduces structural exposure to diesel price shocks that cannot be timed or fully hedged in perpetuity.
The next major ASX story will hit our subscribers first
Two Unresolved Variables That Will Determine Brent's Next Move
With Brent oil price Red Sea disruptions and Strait of Hormuz closure already pushing prices to $92.85 per barrel, the trajectory from here narrows to two variables that remain genuinely unresolved.
1. Strait of Hormuz operational status
The strait remains open at the time of writing, but the 11-night streak of US strikes on Iranian targets and Iran's retaliatory activity across Bahrain, Kuwait, and Jordan represents an unprecedented escalation tempo. Every additional night of strikes raises the probability that conflict activity reaches the physical infrastructure or patrol operations that keep the strait navigable. Recent reporting on the 2026 Strait of Hormuz crisis provides additional context on how rapidly conditions are evolving.
2. Kazakhstan upstream output decisions
The CPC terminal suspension at the Black Sea has already halted Kazakh oil receipts. The critical question is whether that disruption persists long enough to force upstream production curtailments. Kazakh fields are not designed for rapid cycling of production volumes. If operators are forced to shut in wells due to storage filling or pipeline constraints, restoring that output takes time and capital, meaning any supply loss is not immediately reversible when conditions improve.
If both variables deteriorate simultaneously, the market transitions from a logistics-driven cost increase to a full supply shock. If only one materialises, Brent is more likely to consolidate in the low-to-mid $90s range with periods of volatility around escalation news.
Bull / Base / Bear Framework for Brent Near Term
| Scenario | Brent Trajectory | Key Conditions |
|---|---|---|
| Bull | $100 to $115+ | Hormuz closes or restricted; Kazakhstan cuts production; EIA confirms inventory draws |
| Base | Low-to-mid $90s | Red Sea persists; Hormuz open; mixed inventory signals |
| Bear | $80 to $87 | Ceasefire restores Red Sea access; CPC resumes; US-Iran tensions de-escalate |
What Investors Should Watch: The EIA Data Sequence
The EIA Weekly Petroleum Status Report, published each Wednesday, provides the most timely available read on whether physical US crude and distillate inventory levels are drawing down. American Petroleum Institute data published ahead of the most recent EIA release showed higher US crude and distillate stockpiles alongside lower gasoline inventories, a mixed signal that points to demand softness partially offsetting supply tightness.
Reviewing commodity hedging strategies is increasingly relevant for operators exposed to this volatile pricing environment. The sequence that would confirm a genuine structural supply tightening, rather than a pure geopolitical premium, would require:
- Sustained and accelerating US crude inventory draws confirmed across multiple weekly EIA reports
- Kazakhstan announcing formal upstream production curtailments following the CPC terminal suspension
- Strait of Hormuz transit volumes declining below normal operating levels
- Freight insurance premiums for Persian Gulf tanker routes continuing to escalate
Without confirmation of inventory draws, a portion of the Brent oil price Red Sea disruptions and Strait of Hormuz closure premium remains a geopolitical risk that would partially reverse under any credible de-escalation signal. The distinction between premium and structural repricing is what determines whether hedging strategies need adjustment and whether fuel cost assumptions in capital planning remain valid through the back half of 2026.
This article contains forward-looking statements and scenario projections based on third-party analyst forecasts and publicly available data. These represent potential outcomes under specific conditions and should not be interpreted as investment advice. Commodity prices are subject to rapid change based on geopolitical developments, supply and demand dynamics, and other factors beyond any single forecaster's ability to predict with certainty.
Want to Stay Ahead of Commodity Discoveries Driving the Next Market Move?
When geopolitical shocks reshape global energy flows and commodity prices surge, the investors who act fastest on emerging ASX mineral discoveries gain the greatest advantage — Discovery Alert's proprietary Discovery IQ model delivers real-time alerts the moment significant discoveries hit the exchange, turning complex market data into clear, actionable opportunities across more than 30 commodities. Explore how historic mineral discoveries have generated extraordinary returns and begin your 14-day free trial today to position yourself ahead of the broader market.