June 22, 2026
The Hidden Mechanics Behind Global Oil Price Shocks
Most investors understand that geopolitical tension raises oil prices. Far fewer understand why that relationship is so powerful in specific corridors, and almost none fully grasp how a maritime insurance market can effectively blockade a shipping lane without a single warship firing a shot. The 2026 Strait of Hormuz shipping disruption and Brent oil prices crisis has exposed all three layers of this complexity simultaneously, producing a price structure that is no longer reacting to daily headlines but instead reflecting a deep structural repricing of Middle East energy delivery risk.
Understanding what is actually driving Brent crude toward the $100/barrel threshold requires moving beyond the sequence of military events and into the underlying mechanics of how shipping disruption transmits into energy prices, inflation projections, and ultimately central bank policy.
When big ASX news breaks, our subscribers know first
Why the Strait of Hormuz Creates Irreplaceable Energy Concentration Risk
The Strait of Hormuz is a narrow waterway connecting the Persian Gulf to the Gulf of Oman, and it serves as the sole maritime exit point for crude oil produced across Saudi Arabia, Iraq, Iran, the UAE, and Kuwait. According to UNCTAD, approximately one quarter of all global seaborne oil trade transits this single corridor, making it structurally irreplaceable within any realistic short-term timeframe.
What makes this concentration so significant is not just the volume of oil that passes through, but the complete absence of adequate pipeline alternatives. While bypass routes such as Saudi Arabia's East-West Pipeline and the UAE's Abu Dhabi Crude Oil Pipeline do exist, their combined capacity falls dramatically short of what would be required to reroute Hormuz-equivalent flows if the strait were seriously disrupted. In practical terms, there is no plan B that works at scale.
This geographic reality creates a structural vulnerability that other major oil chokepoints do not share to the same degree. The Suez Canal and the Malacca Strait are important, but oil rerouted around them faces longer transit times rather than outright market inaccessibility. Hormuz is different because the producing nations themselves sit behind it. Furthermore, the interplay of oil prices and geopolitics makes this corridor uniquely sensitive to any escalation in regional tensions.
Why Shipping Disruption Hits Markets Harder Than Production Cuts
A frequently misunderstood dynamic in energy markets is that shipping disruptions and production disruptions are not equivalent in their price impact, even when the volume implications look similar on paper.
When a producer cuts output, fewer barrels enter the market. Prices rise, but the adjustment is gradual because the signal is clear and quantifiable. When a shipping corridor becomes operationally compromised, however, something different occurs: supply already exists but cannot reach its buyers reliably. The market does not simply lose barrels. It loses the certainty of delivery, and that uncertainty commands a premium that can exceed the premium from an equivalent production cut.
The compounding mechanism works through several steps:
- Vessel operators assess transit risk and begin reducing sailings or diverting routes
- Available tanker capacity contracts, tightening delivery windows for refiners
- Freight premiums rise as the remaining fleet commands higher rates
- Marine war risk insurance premiums escalate, making many voyages economically unviable
- Refiners face both reduced crude access and higher landed cost, amplifying the price signal
This is precisely the dynamic that unfolded in the Strait of Hormuz beginning in late February 2026, when shipping traffic through the corridor deteriorated sharply following an intensification of military activity. According to reporting from Hellenic Shipping News, oil price forecasts were raised considerably as the prolonged disruption continued to bite.
The 2026 Escalation Sequence and Its Market Impact
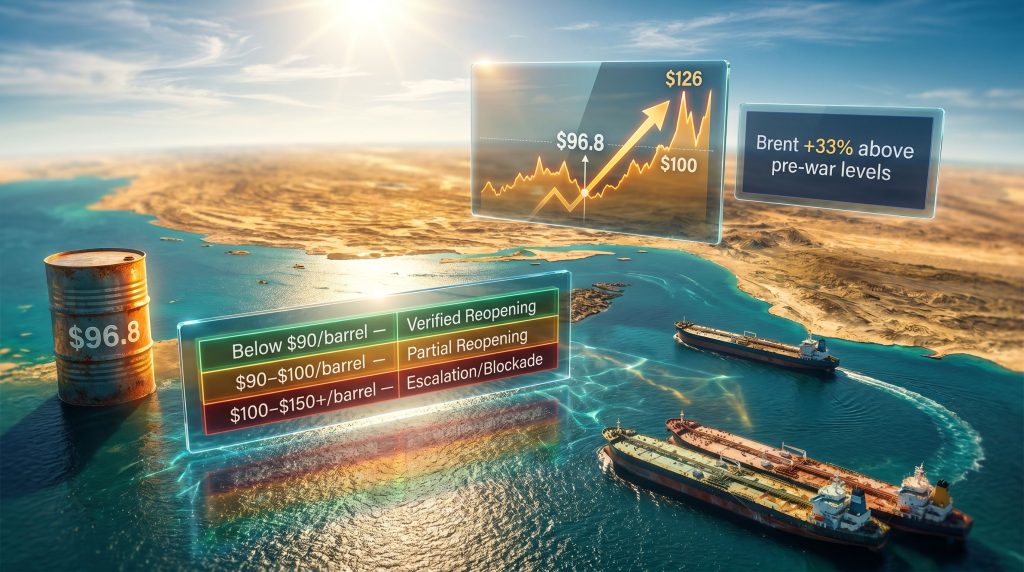
The specific event that crystallised market concern on May 28, 2026 was a retaliatory Iranian attack on a US military base in Kuwait, following US strikes targeting Iranian drone manufacturing and launch infrastructure. Brent crude responded with a 2.7% single-session gain to $96.8/barrel, demonstrating how each new military incident resets the embedded risk premium regardless of any prior price adjustment.
The escalation sequence compressed within days, giving tanker operators no reliable window to reassess route safety before the next incident occurred. US President Donald Trump publicly rejected Iranian claims that a shipping access agreement had been negotiated, removing the de-escalation signal that markets had been anticipating.
The broader financial market response on that date illustrated how interconnected the transmission channels had become:
| Asset Class | Movement | Driver |
|---|---|---|
| Brent Crude | +2.7% to $96.8/barrel | Military escalation, shipping constraint |
| Europe STOXX 600 | -0.8% | Energy cost pressure on corporate margins |
| US Stock Futures | -0.3% to -0.5% | Risk-off positioning ahead of inflation data |
| Gold Futures | -1.4% to $4,383.30 | Rising Treasury yields, stronger USD reducing non-yielding asset demand |
| US Dollar Index | 99.506 (stable) | Safe-haven flows, Fed tightening expectations |
The Insurance Mechanism: A Soft Blockade by Actuarial Logic
One of the least discussed but most consequential aspects of the Hormuz disruption is the role of the marine insurance market in effectively restricting tanker access without requiring any physical barrier.
As military incidents multiplied, underwriters raised war risk premiums on vessels transiting the Strait of Hormuz to levels that rendered many voyages economically unviable. Madison Cartwright, Senior Geo-economics Analyst at Commonwealth Bank of Australia, described to Reuters how insurers elevated maritime risk premiums to thresholds that a significant portion of tanker operators could no longer economically absorb.
The result was a soft blockade: tankers remained technically capable of making the transit, but the financial logic of doing so had broken down for large segments of the fleet. This mechanism is particularly important to understand because it persists beyond any ceasefire:
- Insurance pricing resets are slow: Underwriters require sustained evidence of reduced risk before normalising premiums, meaning the freight constraint can outlast military conflict by weeks or months
- Operator caution compounds the effect: Even operators with insurance capacity may defer redeployment until contractual certainty returns
- Transit toll uncertainty extends the disruption: Even without active military engagement, the prospect of Iranian-imposed transit fees prevents freight pricing from stabilising
| Disruption Factor | Mechanism | Duration Risk |
|---|---|---|
| Military strikes | Sailings suspended | Days to weeks |
| War risk insurance premiums | Voyage economics unviable | Weeks to months |
| Transit toll uncertainty | Fleet redeployment deferred | Indefinite pending political clarity |
| Political ambiguity | No pricing certainty for contracts | Persistent geopolitical premium |
Brent Crude's Price History: The Structural Repricing of Middle East Supply Risk
At the peak of the disruption, Brent crude surged above $126/barrel, reflecting maximum market fear around a scenario involving sustained or complete blockade conditions. As partial negotiation signals emerged, prices retreated toward $95.83 to $96.80/barrel by late May 2026. The Strait of Hormuz shipping disruption and Brent oil prices relationship has consequently become the defining dynamic in global energy markets this year.
The more significant figure is not the peak but the floor. Brent is currently trading approximately 33% above pre-conflict price levels, and that sustained elevation reflects something more durable than a temporary geopolitical spike. It represents a structural repricing of the probability distribution around Middle East supply delivery. In addition, oil price volatility of this magnitude has not been observed since previous major supply disruptions.
Price Scenario Framework for Brent Crude:
- Below $90/barrel: Requires verified, unrestricted Hormuz reopening with no Iranian transit tolls
- $90 to $100/barrel: Partial disruption with active diplomatic engagement underway
- $100 to $126/barrel: Sustained shipping constraint with no credible resolution timeline
- Above $126/barrel: Full or near-total blockade with escalating military engagement
Analysts have identified $150/barrel as a plausible scenario under conditions of sustained blockade and intensified military engagement. This is not a consensus forecast but a tail-risk scenario that remains within the pricing model given current political dynamics. Yahoo Finance has also reported on the broader global economic disruption this has created across multiple markets.
How Energy Prices Become an Inflation Problem: The Three Transmission Channels
ECB Chief Economist Philip Lane communicated to Reuters that elevated energy costs are no longer contained within fuel price indexes. They are transmitting into broader inflation expectations through what economists describe as second-round effects, a process that continues building economic pressure for one to two quarters even if crude prices stabilise at current levels.
The three channels through which an oil shock becomes an inflation shock are:
- Direct energy costs: Fuel, electricity, and heating prices rise immediately with crude benchmarks, affecting consumers and businesses within weeks
- Logistics and freight repricing: Shipping, trucking, and air freight costs reset with each contract renewal cycle, typically on a quarterly basis, embedding the energy cost into supply chain economics for an extended period
- Wage and input cost escalation: Businesses facing persistently higher operating costs pass them through to consumers, triggering wage demands that further embed inflation expectations and make the cycle self-reinforcing
This transmission sequence is why institutional positioning has shifted away from trading daily military headlines toward modelling whether energy costs will push core PCE above the 3.3% threshold over the next quarter. Furthermore, the oil market impact of these combined pressures continues to ripple across global supply chains.
The Federal Reserve Policy Threshold and What It Means for Markets
Economists are currently projecting headline PCE inflation near 3.8%, with the critical policy signal residing in core PCE data. The Federal Reserve's stated target remains 2%, meaning a core PCE print above 3.3% would represent a figure more than 65% above target and would historically represent a level compelling a policy response.
Federal Reserve Governor Lisa Cook confirmed to Reuters that further rate hikes would be supported if energy or tariff-driven pressures continue accelerating inflation, signalling that the Fed's tightening bias remains active.
The corporate exposure to this dynamic is concentrated in specific sectors:
- Transportation and airlines: Direct fuel cost exposure plus rising freight contract rates
- Chemicals and industrial manufacturers: Input cost escalation from energy-intensive production processes
- Leveraged consumer companies: Thin margin businesses with near-term debt maturities facing the double pressure of higher operating costs and more expensive refinancing
Rising Treasury yields, driven by persistent inflation expectations, have increased borrowing costs across all these categories. Companies with high debt-to-equity ratios are particularly exposed to a prolonged high-Brent environment.
Scenario Modelling: Three Paths for Hormuz and Their Investment Implications
| Scenario | Brent Range | Core PCE Path | Fed Implication | Outperforming Assets |
|---|---|---|---|---|
| Verified Reopening | Below $90/barrel | Declining toward 2.5-3.0% | Rate cut expectations return | Gold, growth equities, long-duration bonds |
| Partial Reopening | $90-$100/barrel | Stable near 3.0-3.3% | Rates on hold | Short-duration bonds, free-cash-flow equities |
| Escalation / Blockade | $100-$150+/barrel | Rising above 3.3% | Further rate hikes | Energy sector, USD, short-duration assets |
What the Defensive Trade Actually Looks Like
The current market structure favours a specific set of positioning decisions while Brent crude remains near or above $95/barrel and Hormuz shipping stays constrained:
- Defensive US dollar exposure remains supported by safe-haven demand and elevated Fed tightening expectations
- Short-duration fixed income outperforms long-duration bonds in a rising-yield environment driven by energy inflation
- Strong free-cash-flow companies with low debt-to-equity ratios are better insulated against both higher fuel costs and expensive refinancing
- Energy sector equities benefit directly from sustained high crude prices
One of the most important investment discipline points from the current environment is that retail investors cannot reliably trade geopolitical timelines. Military escalation dynamics, insurance market behaviour, and the opaque process of Iranian transit toll negotiations are structurally unpredictable on any daily or weekly basis. Position sizing, portfolio liquidity, and balance-sheet quality screening are more reliable tools than attempting to time ceasefire announcements. However, gold as a safe haven remains relevant for investors seeking to hedge against broader uncertainty in this environment.
The Three Indicators That Define When the Trade Shifts
- Brent Crude Price: Above $100/barrel signals an intensifying energy inflation shock; a confirmed move below $90/barrel signals meaningful de-escalation with freight market normalisation underway
- US Dollar Index: Sustained strength above 99.506 reinforces the defensive trade; a meaningful weakening signals recovering risk appetite and potential Hormuz resolution
- Monthly PCE Report (Bureau of Economic Analysis, 8:30 a.m. ET): Core PCE above 3.3% confirms energy inflation is spreading through the broader economy and reinforces extended Fed tightening expectations
The next major ASX story will hit our subscribers first
Frequently Asked Questions
What percentage of global oil trade transits the Strait of Hormuz?
According to UNCTAD, approximately one quarter of all global seaborne oil trade passes through the Strait of Hormuz. No alternative route or pipeline network currently exists with the capacity to absorb equivalent volumes in any realistic short-term timeframe.
How high did Brent crude rise during the 2026 disruption?
Brent crude peaked above $126/barrel during the acute phase of the disruption. By late May 2026, prices had retreated to approximately $95 to $97/barrel as partial negotiation signals reduced the most extreme fear premium, though Brent remained roughly 33% above pre-conflict levels.
Why did gold decline when oil prices surged?
Gold futures fell 1.4% to $4,383.30 during the May 28, 2026 risk selloff because rising Treasury yields and a strengthening US dollar reduced the relative attractiveness of non-yielding assets. In environments where rate hike expectations dominate market pricing, gold can underperform despite broader uncertainty, as the opportunity cost of holding non-yielding assets rises with real yields.
What core PCE level would trigger Federal Reserve action?
Markets are watching core PCE above 3.3% as the threshold reinforcing Federal Reserve tightening expectations. With the Fed's official target at 2%, a print above 3.3% would represent a significant overshoot requiring a visible policy response.
Which sectors face the greatest risk from sustained high oil prices?
Transportation, airlines, chemicals, and leveraged consumer companies carry the most acute exposure to a prolonged high-Brent environment. These sectors absorb fuel costs directly while simultaneously facing higher refinancing costs as Treasury yields rise in response to energy-driven inflation pressure.
Key Data Summary
| Metric | Value | Significance |
|---|---|---|
| Brent crude on May 28, 2026 | $96.8/barrel (+2.7%) | Approaching $100 psychological threshold |
| Brent peak during crisis | Above $126/barrel | Maximum fear premium at acute disruption |
| Brent above pre-war levels | ~33% | Structural supply risk repricing |
| Analyst $150 scenario | Conditional on sustained blockade | Tail risk in active market pricing |
| STOXX 600 decline | -0.8% | European equity sensitivity to energy costs |
| US futures decline | -0.3% to -0.5% | Broad risk-off positioning |
| Gold futures | $4,383.30 (-1.4%) | Yield-driven pressure on non-yielding assets |
| US dollar index | 99.506 | Safe-haven demand supporting dollar strength |
| Headline PCE forecast | ~3.8% | Well above Fed's 2% target |
| Core PCE policy threshold | 3.3% | Key trigger for extended Fed tightening |
| Hormuz share of seaborne oil | ~25% | Structural chokepoint concentration risk |
This article contains forward-looking analysis, scenario projections, and macroeconomic modelling that involve inherent uncertainty. Nothing in this article constitutes financial advice. Past price behaviour does not guarantee future outcomes. Readers should conduct independent research and consult qualified financial professionals before making investment decisions.
Want to Stay Ahead of the Next Major Resource Discovery Amid Global Market Volatility?
While energy markets grapple with structural supply disruptions and inflation shocks, Discovery Alert's proprietary Discovery IQ model scans ASX announcements in real time, delivering instant alerts on significant mineral discoveries so subscribers can identify actionable opportunities before the broader market reacts — explore historic discovery returns on Discovery Alert's dedicated discoveries page and begin a 14-day free trial to secure a genuine market-leading edge.