
August 23, 2026
The Hidden Price Signal That Crude Inventory Data Cannot Reveal
When most market participants evaluate oil price direction, they instinctively reach for the same data point: weekly commercial crude inventory figures. This is a logical but incomplete reflex. The petroleum complex is not a single-product market, and Brent crude pricing does not respond exclusively to crude balances. In 2026, the most consequential signal for sustained price support is not sitting in crude storage tanks. It is embedded in the acute scarcity of middle distillates, and the gap between where those inventories stand today and their five-year seasonal average is telling a fundamentally different story from what headline crude data suggests.
Understanding this disconnect requires stepping back from daily price movements and examining the structural architecture of refined-product markets, because distillate inventories and Brent price support are now more tightly linked than at any point since the energy crisis of the early 1970s. Furthermore, crude oil price trends suggest that product-market dynamics are increasingly driving headline Brent moves in ways that traditional crude-focused analysis consistently underweights.
When big ASX news breaks, our subscribers know first
Why Middle Distillates Carry More Pricing Weight Than Crude Oil in 2026
The Role of Diesel and Heating Oil in the Refinery Output Stack
Middle distillates occupy a specific and economically critical position within the refinery output hierarchy. Sitting above heavy fuel oil and below lighter naphtha and gasoline fractions, diesel and heating oil are the workhorse products of industrial economies. They power freight networks, agricultural machinery, construction equipment, and residential heating systems across the Northern Hemisphere.
Unlike crude oil, which is a globally traded feedstock with multiple substitution pathways and large floating storage capacity, distillate inventories reflect the simultaneous interaction of:
- Refinery throughput rates and crude slate quality
- Export and import flows across Atlantic and Pacific basins
- Seasonal heating demand patterns concentrated in Q4 and Q1
- Freight demand, which tracks industrial output rather than consumer sentiment
When distillate stocks fall materially below seasonal norms, crack spreads — the price premium of refined products over crude feedstock — widen sharply. This widening signals that the refined-product complex is tightening on its own terms, independent of whatever crude inventory data shows. That is precisely what 2026 data reveals.
The Five-Year Average as a Price Anchor
The five-year seasonal average functions as the energy market's primary reference point for assessing supply adequacy. Deviations from this benchmark are monitored closely by traders, refiners, and policymakers because they indicate whether inventories are sufficient to absorb demand shocks without triggering price spikes.
| Inventory Metric | Current Level | Five-Year Average | Deviation |
|---|---|---|---|
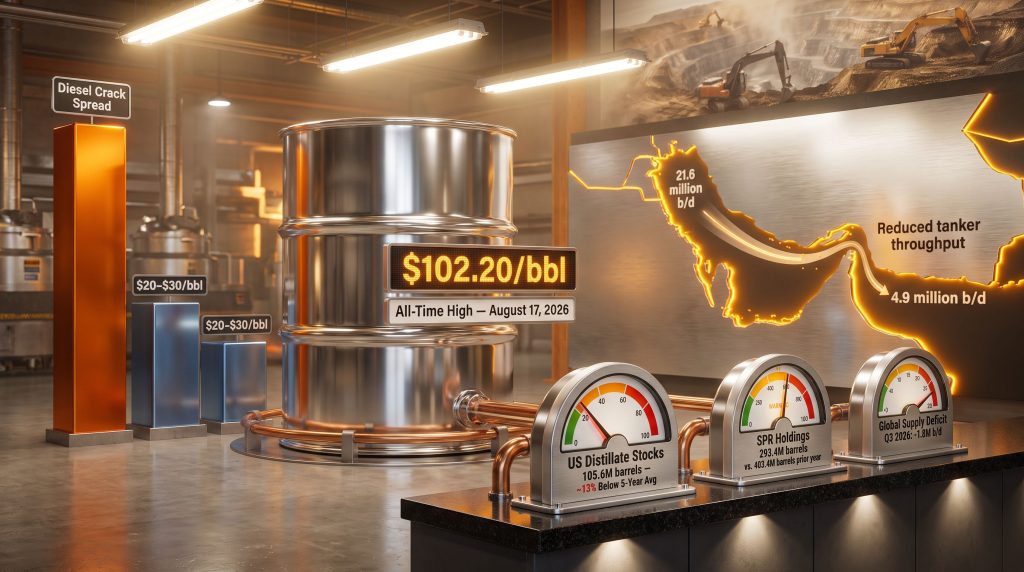
| US Distillate Stocks | 105.6 million barrels | ~121 million barrels (est.) | ~13% below average |
| US Commercial Crude | 428.8 million barrels | ~428 million barrels (est.) | At or near average |
| Strategic Petroleum Reserve | 293.4 million barrels | 403.4 million barrels (prior year) | ~27% below prior year |
The table above captures a structural pricing anomaly that many market participants are underweighting. Commercial crude inventories have normalised, recovering to the five-year seasonal average after standing approximately 6% below it at the end of July 2026. However, distillate inventories remain deeply deficient, sitting around 13% below their five-year benchmark, and the two conditions are pulling the market in conflicting directions. US distillate fuel oil inventory data confirms the persistence of this structural gap through the current reporting period.
"When crude inventories normalise but distillate stocks remain acutely below seasonal averages, Brent pricing anchors to the tighter product market, not to the crude balance that headline data emphasises."
Supply Destruction, Not Demand Weakness, Is Setting the Price in 2026
The Asymmetric Decline That Conventional Models Failed to Anticipate
The International Energy Agency's August 2026 Oil Market Report reduced its 2026 global oil demand projection by 510,000 barrels per day from its July estimate, bringing the projected annual decline to 1.6 million barrels per day. In a textbook supply-demand framework, a demand contraction of this magnitude would be expected to push crude prices lower.
What has prevented that outcome is a simultaneous supply contraction occurring at roughly 2.7 times the pace of the demand decline. Global oil supply is projected to fall by 4.3 million barrels per day to 102 million barrels per day in 2026. The arithmetic consequence is a Q3 2026 supply deficit of 1.8 million barrels per day — the largest quarterly shortfall since Q4 2021 — and a cumulative inventory drawdown of 410 million barrels since the onset of the Iran conflict on February 28, 2026.
| Variable | 2026 Projection | Direction |
|---|---|---|
| Global Oil Demand Change | -1.6 million b/d | Declining |
| Global Oil Supply Change | -4.3 million b/d | Declining faster |
| Q3 2026 Supply Deficit | -1.8 million b/d | Largest since Q4 2021 |
| Cumulative Inventory Draw | -410 million barrels | Since Feb 28, 2026 |
| Brent Spot Price (Aug 20) | ~$93/bbl | Elevated |
The 410-million-barrel inventory draw is the mechanism through which supply destruction has absorbed the demand weakness and prevented price relief. This is not a subtle effect. It represents a fundamental repricing of available supply, and it explains why Brent traded near $93 per barrel on August 20, 2026, despite a demand environment that would historically have been associated with significantly lower crude prices.
"In a supply-destruction-led oil market, consumption forecasts become secondary indicators. The primary variable is the rate at which available inventories are being depleted."
Consequently, the oil market trade risks stemming from geopolitical conflict have amplified the supply-side shock beyond what demand-side models were calibrated to handle, reinforcing the structural nature of current price support.
The SPR Illusion: Why US Supply Data Requires a Combined Reading
Commercial Builds Masking a Shrinking Overall Buffer
The week ending August 14, 2026 produced a headline commercial crude inventory build of 4.4 million barrels, lifting stocks to 428.8 million barrels and drawing considerable media attention as evidence of supply recovery. That interpretation is incomplete.
During the same reporting week, holdings in the Strategic Petroleum Reserve fell by 5.3 million barrels to 293.4 million barrels, down from 403.4 million barrels one year earlier. The combined commercial and SPR balance therefore declined by approximately 0.9 million barrels, meaning the US aggregate supply buffer contracted even as the commercial inventory figure moved higher.
"Tracking commercial crude stocks in isolation can create a false impression of supply adequacy. When SPR drawdowns exceed commercial builds in the same reporting week, the aggregate US supply buffer is shrinking, not growing, regardless of what the headline figure suggests."
This is a critical but frequently overlooked analytical distinction. The SPR is now approximately 110 million barrels lower than it was one year prior. This structural reduction in the emergency buffer means that any future Gulf supply shock would transmit more rapidly and forcefully into US domestic fuel markets than historical precedent would indicate, because the cushion available to absorb the disruption is substantially thinner.
Record Diesel Crack Spreads Signal Structural Scarcity, Not Transient Tightness
Why $102 Per Barrel Is Not a Temporary Anomaly
The US diesel crack spread — measuring the price premium of ultra-low sulphur diesel futures over WTI crude — reached an all-time high of $102.20 per barrel on August 17, 2026, and settled above $100 for the first time the following session. To appreciate the magnitude of this reading, it is essential to understand what a normal crack spread looks like.
| Diesel Crack Spread | Level | Context |
|---|---|---|
| Historical Normal Range | $20-$30/bbl | Pre-conflict baseline |
| August 17, 2026 (All-Time High) | $102.20/bbl | Record level |
| First Close Above $100 | August 18, 2026 | Historic first |
A crack spread four to five times its historical normal range is not a signal of temporary supply tightness. It is a market pricing in severe structural scarcity. The conditions generating this reading are multiple and reinforcing:
- US distillate inventories fell by 1.5 million barrels in the week ending August 14, 2026, to 105.6 million barrels, with the prior reading of 107.1 million barrels already representing the lowest level for that time of year since 1996
- US refineries operated at 97.2% of operable capacity — the highest utilisation rate since September 2019 — yet distillate production declined to 5.2 million barrels per day, demonstrating that near-maximum throughput cannot resolve the shortage when crude quality and refinery configuration constraints apply
- Global refinery throughput reached 80.9 million barrels per day in July 2026, nearly 5 million barrels per day below the prior year, contracting the global pool of available refined products
- Russian diesel and gasoil exports collapsed by approximately 92% year-over-year to just 80,000 barrels per day in early August 2026, with an export ban extending through January 2027 eliminating a historically significant source of European middle-distillate supply
Goldman Sachs Positioning Confirms the Structural Trade
Goldman Sachs has established a long December 2026 to March 2027 European gasoil timespread trade, specifically targeting the structural shortage in European middle distillates anticipated ahead of the Northern Hemisphere heating season. This positioning reflects institutional conviction that the distillate deficit is not resolving quickly, and that the winter period carries acute supply risk for European heating oil markets that have lost Russian supply without adequate replacement volumes. Furthermore, OPEC market influence over production policy in this environment is likely to prove decisive in determining whether the winter deficit deepens or stabilises.
Gulf Disruption: The Supply Variable That Dwarfs Demand Data
Hormuz Transit Collapse and Its Downstream Consequences
Crude and petroleum liquids transiting the Strait of Hormuz fell from 21.6 million barrels per day in Q4 2025 to 4.9 million barrels per day in Q2 2026 — a reduction of 16.7 million barrels per day from the pre-conflict baseline. Gulf oil production partially recovered in July, rising by 2.5 million barrels per day to 23.9 million barrels per day, but remained 8.3 million barrels per day below pre-war levels.
Regional exports fell by 2.1 million barrels per day to 15 million barrels per day despite alternative routing through bypass channels, confirming that these alternatives cannot replicate pre-conflict flow volumes.
The scale relationship between the Gulf shortfall and the global demand decline is critical to understanding why consumption data has lost its traditional pricing relevance in this cycle:
"The Gulf production shortfall of 8.3 million b/d is roughly five times larger than the projected 1.6 million b/d global demand decline. This scale differential means that geopolitical developments in the Gulf region carry far greater near-term pricing weight than any consumption data release."
On August 19, 2026, the UAE suspended trade and financial transactions with Iran following reports of ballistic missile launches toward UAE territory. Attacks on vessels linked to major Gulf energy producers have escalated tail risks around export continuity, reinforcing the asymmetric nature of supply disruption risk in the current environment.
An important and underappreciated dimension of this disruption is that alternative routing is not a neutral substitute for Hormuz transit. Alternative export channels are slower, carry higher shipping costs, and operate at lower throughput capacity. They can partially compensate for crude losses but have not restored refined-product trade volumes, meaning the distillate market bears an outsized portion of the disruption's consequences.
The next major ASX story will hit our subscribers first
Elevated Diesel Prices and the Mining Sector Cost Problem
When Crude-Linked Cost Models Generate Dangerous Guidance Risk
Diesel is the primary energy input for open-pit mining operations globally. It fuels haul trucks, excavators, drilling rigs, and site transport infrastructure. Despite this direct dependency on refined diesel, many mining companies report fuel cost sensitivity benchmarked against crude oil prices rather than the delivered diesel price their operations actually pay.
This is a methodologically sound approximation when diesel crack spreads are within their normal $20-$30 per barrel range, because the crude-to-diesel relationship is relatively stable at that level. It becomes a source of significant guidance risk when crack spreads exceed $100 per barrel, because the differential between crude price and diesel price is now four to five times wider than cost models assume. Understanding mining cost sensitivity in this environment is essential, as operations paying a $102 crack premium above WTI for their diesel fuel face costs that crude-linked models can materially understate.
Modelled Cost Impacts Across Mining Commodities
Research from S&P Global Market Intelligence has quantified some of these effects. Their modelled analysis of a Strait of Hormuz disruption scenario estimates:
- A global iron ore cost base increase of approximately US$5.76 per dry metric ton, equivalent to an 11.3% cost increase
- A 60% fuel-price increase scenario that raises manganese cash costs by an average of US$7.59 per dry metric ton
- South African and Gabonese producers facing the greatest modelled exposure due to diesel-intensive operations and extended inland haulage distances
Operational Strategies That Can Protect Mining Margins
Mining operators with exposure to elevated diesel pricing have several tools available to mitigate margin compression. In addition, commodity hedging strategies can provide a structured framework for managing fuel cost volatility alongside broader commodity price risk:
- Fuel hedging programmes that lock in diesel prices independently of crude benchmarks, removing crack spread risk from the operating cost line
- Owned logistics infrastructure that reduces dependence on spot diesel pricing in remote locations where price premiums compound the crack spread effect
- Grid-connected or gas-fired power substitution for stationary power applications, reducing diesel dependency where alternative energy sources are accessible
- Operational efficiency programmes that target lower diesel consumption per tonne moved or processed, reducing exposure to price per unit volume
How Pre-Conflict Valuations Compare to Current Market Reality
The Effective Date Problem in Independent Resource Evaluations
Independent resource evaluations establish a fixed effective date and apply a set of forward oil-price assumptions calibrated to the market conditions prevailing at that time. Valuations completed prior to February 28, 2026, were constructed against a supply environment fundamentally different from the one that exists today.
With Brent trading near $93 per barrel in August 2026, compared with pre-conflict benchmarks broadly in the $70-$72 per barrel range, the gap between evaluated economics and current market conditions has widened materially. This creates a systematic tendency for pre-conflict resource valuations to understate the economics of projects that have since benefited from higher realised prices, particularly for light, low-sulphur crude grades.
Turkey's position as a large oil importer creates an additional dimension to this dynamic that is not widely appreciated in standard market analysis. Producers with operations in proximity to Turkish refining infrastructure can sell light crude directly to refiners displacing Russian, Iranian, and Iraqi supply at highly competitive netbacks. In a market structurally short of middle distillates, light crude grades that yield higher proportions of diesel in the refining process may command quality premiums above headline Brent — a grade differential that standard flat-price evaluations do not capture.
What Would Signal That Distillate-Driven Brent Support Is Weakening
The Inventory and Pricing Thresholds That Matter for Price Direction
| Signal | Current Status | Threshold for Weakening Support |
|---|---|---|
| US Distillate Inventories | 105.6 million barrels (~13% below avg) | Recovery toward ~115 million barrels |
| Diesel Crack Spread | Above $100/bbl | Sustained decline below $80/bbl |
| Gulf Oil Production | 8.3 million b/d below pre-war levels | Meaningful restoration of export flows |
| Global Supply Outlook (2027) | +8.3 million b/d projected recovery | Confirmation of supply normalisation |
| OPEC+ Production Policy | September 6, 2026 meeting pending | Coordinated output increase |
Key Monitoring Events on the Near-Term Calendar
Three specific events carry the most analytical weight for near-term price direction:
- Weekly EIA Petroleum Status Reports (every Wednesday): The primary data source for tracking whether distillate stocks rebuild from 105.6 million barrels toward the 115 million barrel threshold while refinery utilisation holds near 97.2%. The EIA weekly petroleum report provides the timeliest available read on US distillate inventory movements.
- OPEC+ Ministerial Meeting, September 6, 2026: Seven coordinating members will assess production adjustments. Any decision to increase output represents the most direct near-term supply-side response available to offset current deficits.
- EIA Short-Term Energy Outlook, September 9, 2026: The next formal update to US supply and demand projections, providing a revised read on whether the Q3 deficit trajectory is moderating or deepening.
The 2027 Supply Recovery Scenario
Global oil supply is projected to increase by 8.3 million barrels per day to 110.3 million barrels per day in 2027, theoretically generating a surplus of approximately 4.61 million barrels per day above projected demand. However, a critical and frequently overlooked condition applies to this recovery scenario.
Full normalisation of distillate inventories and Brent price support requires not just restored crude production but the resumption of Gulf refined-product exports, not crude loadings alone. If Gulf recovery restores crude flows but not refinery output and product export capacity, distillate markets will remain structurally tight even as crude balances improve. This nuance is essential for investors assessing whether a 2027 supply recovery will actually translate into relief for middle distillate markets ahead of the 2027 Northern Hemisphere heating season.
Frequently Asked Questions: Distillate Inventories and Brent Price Support
Why do distillate inventories influence Brent crude prices when crude stocks look adequate?
Brent pricing reflects the entire petroleum complex, not crude oil in isolation. When distillate inventories fall significantly below seasonal averages, crack spreads widen and refined-product margins strengthen, keeping the overall energy complex firm even if headline crude balances appear neutral. At 13% below the five-year average, US distillate stocks are providing a structural floor under Brent that crude inventory data alone does not reveal.
What is the diesel crack spread and why does it matter?
The diesel crack spread measures the price premium of ultra-low sulphur diesel futures over WTI crude oil. It represents the refining margin for producing diesel from crude. A normal range of $20-$30 per barrel reflects balanced supply and demand in the distillate market. When the crack reaches $102 per barrel, it signals that diesel supply is acutely scarce relative to demand, regardless of crude oil availability.
How does the Strategic Petroleum Reserve factor into US supply tightness?
Commercial crude inventory data is frequently cited as the primary measure of US supply adequacy, but it excludes SPR holdings. When the SPR declines faster than commercial stocks build — as occurred in the week ending August 14, 2026, when a 5.3 million barrel SPR draw exceeded a 4.4 million barrel commercial build — the combined US supply buffer is actually contracting, even as headline figures suggest recovery.
At what inventory level would distillate-driven Brent support begin to weaken?
Analysts are monitoring US distillate stocks for a recovery toward approximately 115 million barrels as an early signal of easing product-market tightness. A diesel crack spread that retreats and sustains below $80 per barrel would provide corroborating evidence that the structural deficit is normalising. Both conditions would need to coincide with restored Gulf refined-product export flows to meaningfully reduce upward pressure on Brent.
Why might high refinery utilisation fail to rebuild distillate inventories?
Refinery throughput at 97.2% of operable capacity represents a practical ceiling on domestic production capacity. When facilities are operating near maximum rates, incremental output gains are minimal. If the distillate deficit is driven by export demand, crude quality constraints, or configuration mismatches between available crude grades and refinery yield requirements, higher utilisation alone cannot resolve the inventory shortfall.
Readers seeking additional context on global oil market dynamics and distillate pricing mechanisms may find value in exploring energy market analysis published by the US Energy Information Administration and the International Energy Agency's monthly Oil Market Reports at iea.org, both of which provide primary data underlying the metrics discussed in this analysis. This article contains forward-looking projections and market analysis that involve inherent uncertainty. Nothing in this article constitutes financial or investment advice.
Want to Capitalise on the Next Major Resource Discovery Before the Market Catches On?
While distillate scarcity and supply destruction are reshaping crude pricing fundamentals, the real opportunity for investors lies in identifying significant mineral discoveries the moment they are announced — and that is precisely what Discovery Alert delivers. Powered by its proprietary Discovery IQ model, Discovery Alert provides real-time ASX alerts that turn complex resource data into actionable insights, with historic discoveries such as De Grey Mining and WA1 Resources demonstrating the extraordinary returns that early positioning can generate — start your 14-day free trial today and explore the full track record on the discoveries page.