
July 21, 2026
Why the Next Market Crash May Already Be Underway
Most investors think of market crashes as sudden, singular events. A dramatic single-day collapse, a headline-grabbing circuit breaker, a moment of obvious panic. But historically, the most destructive bear markets have been slow, grinding affairs, unfolding over months while the majority of participants remain convinced that a recovery is just around the corner. The conditions that preceded the 2000 dot-com collapse and the 2008 financial crisis did not arrive overnight.
They accumulated quietly, hidden behind strong headline numbers and bullish institutional commentary, until the weight became too great to ignore.
That pattern of slow-building systemic stress is precisely what Todd "Bubba" Horwitz, a veteran trader with 47 years of floor trading experience and founder of BubbaTrading.com, believes is now repeating. His Bubba Horwitz market crash prediction of a 40 to 60% decline across major U.S. equity indices is not a reactionary call. It is the product of a framework built across multiple full market cycles, including the crashes of 1987, 2000, and 2008.
When big ASX news breaks, our subscribers know first
The Anatomy of a 47-Year Market Veteran's Bearish Thesis
What Makes This Forecast Different From Typical Bear Calls?
Horwitz occupies an unusual position in the market commentary space. He is simultaneously a long-term investor, an active trader who takes positions on both sides of the market, and an educator who teaches retail investors how to hedge their portfolios. This multi-role perspective gives his forecast a structural dimension that pure commentators often lack.
His core personal risk management framework is instructive. He maintains long investment positions at all times while deploying hedges designed to cap maximum portfolio downside at approximately 4 to 5%. Profits generated from those hedges are then used to systematically accumulate additional long positions at lower prices. This is not a doom-and-gloom all-cash strategy. It is a disciplined, mechanistic approach to navigating volatility without abandoning long-term positioning.
His crash forecast was delivered publicly at the Vancouver Resource Investment Conference, adding an element of accountability rarely seen in anonymous online prediction culture. You can watch his full presentation here for a deeper understanding of his methodology and reasoning.
Translating the 40 to 60% Prediction Into Real Portfolio Numbers
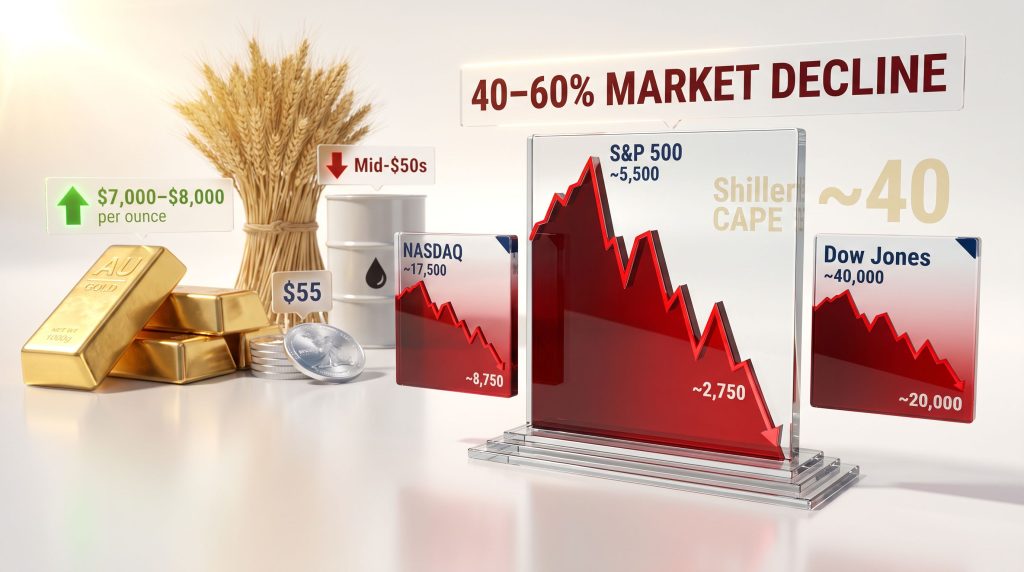
A 40 to 60% decline sounds abstract until it is mapped against actual index levels. The table below illustrates the potential landing zones for major U.S. indices under each scenario, using approximate 2025 levels as a baseline.
| Index | Approx. 2025 Level | At -40% | At -50% | At -60% |
|---|---|---|---|---|
| S&P 500 | ~5,500 | ~3,300 | ~2,750 | ~2,200 |
| NASDAQ | ~17,500 | ~10,500 | ~8,750 | ~7,000 |
| Dow Jones | ~40,000 | ~24,000 | ~20,000 | ~16,000 |
For historical context, the S&P 500 declined approximately 57% from peak to trough during the 2008 financial crisis. The NASDAQ fell roughly 78% during the dot-com bust between 2000 and 2002. The COVID-driven crash of 2020 produced a swift 34% drawdown but recovered within months, an outcome Horwitz does not expect to repeat given the current structural backdrop.
A critical distinction in his thesis is that this is not projected as a single-event shock. He anticipates an extended decline unfolding over a 6 to 12 month period, with different sectors finding their bottoms at different times. Furthermore, the Bubba Horwitz market crash prediction is grounded in a convergence of signals rather than any single indicator.
The Warning Signs Driving the 40 to 60% Forecast
Consumer Credit Deterioration as a Leading Indicator
One of the most compelling elements of Horwitz's framework is his focus on consumer credit data, a category of market signal that tends to be ignored during bull markets but has historically preceded major economic contractions. These credit spread warnings are increasingly difficult to dismiss.
The numbers he cites paint a troubling picture of household financial stress:
- Approximately 15% of the U.S. population is currently more than 90 days past due on credit card obligations
- Auto loan default rates are approaching 7%, a level not seen since the aftermath of the Global Financial Crisis
- Mortgage default rates are near 6%, with stated-income and zero-down-payment loan structures re-emerging in the housing market
- Builder stress is intensifying as affordability constraints tighten across major metropolitan markets
The simultaneous deterioration across credit cards, auto loans, and mortgages points to systemic consumer financial stress rather than isolated sector weakness. This is precisely the combination of signals that preceded the 2007 to 2008 housing market collapse.
The return of no-documentation mortgages and zero-down-payment lending structures is particularly significant. These instruments were widely associated with the pre-2008 credit bubble, and their re-emergence suggests that lending standards have again loosened to levels inconsistent with sustainable market pricing.
Equity Valuation Overextension and the AI Expectations Trap
Beyond credit markets, Horwitz identifies valuation overextension as a primary vulnerability. The Shiller cyclically adjusted price-to-earnings (CAPE) ratio sits near 40 against a long-run historical average of approximately 15. This represents one of the most extreme valuation readings in recorded U.S. market history.
Earnings season expectations entering 2025 are running at approximately 23% year-over-year growth, a threshold that many seasoned analysts view as structurally unsustainable given the current macroeconomic backdrop.
The artificial intelligence sector represents a specific concentration of valuation risk. Horwitz points to the behaviour of high-profile AI-adjacent listings as illustrative: stocks opening at elevated prices and then correcting by 50% or more within compressed timeframes. This mirrors the pattern seen in internet-sector companies during the late 1990s, where narrative momentum drove valuations far beyond what underlying revenue models could support.
A key structural risk in the AI space is escalating capital expenditure commitments. Technology giants are making multi-year infrastructure investment pledges before AI monetisation models have been proven at scale. When earnings disappoint against these elevated expectations, valuation compression tends to accelerate rapidly. These global recession risks compound the already stretched valuation environment.
Additionally, the recent equity rally has been characterised by extremely low trading volume, interpreted as a retail-driven advance lacking meaningful institutional participation. Horwitz's view is that large commercial and institutional players have been waiting on the sidelines for an opportunity to sell into strength rather than accumulate at current levels.
The Rising Yield Pressure Point
Rising long-duration Treasury yields represent a third pillar of the bearish case. As the 10-year yield trajectories push toward 6%, the relative attractiveness of equities diminishes through a well-established mechanism: higher risk-free rates compress the equity risk premium and reduce the present value of future earnings streams, particularly for growth and technology companies with long-duration cash flow profiles.
This yield competition effect is particularly acute in an environment where investors can generate meaningful fixed income returns without accepting equity risk.
Sector Sequencing: How the Decline Is Expected to Unfold
Why Rotation Into the Dow Is a Bearish Signal
One of the more counterintuitive insights in Horwitz's framework concerns capital flows into the Dow Jones Industrial Average. Conventional wisdom often interprets Dow strength as a sign of market resilience. His reading, however, is the opposite.
Historically, the Dow has functioned as a defensive rotation destination during risk-off periods, attracting capital fleeing higher-volatility indices like the S&P 500 and NASDAQ. The futures contract value spread between these indices provides a quantitative signal of this dynamic. Currently, Dow futures carry a contract value of approximately $270,000 compared to approximately $380,000 for S&P 500 futures, a spread of around $110,000.
During the March 2009 market bottom, Dow futures briefly exceeded S&P 500 futures in contract value, a rare inversion that marked peak fear and maximum defensive crowding. Capital currently flowing from the S&P 500 and NASDAQ into the Dow suggests that de-risking is already underway. This market volatility reset dynamic is a key component of Horwitz's sequencing thesis.
The Phase Sequence of Decline
Horwitz outlines a three-phase sequencing of the expected decline:
- Phase 1: Undercapitalised AI and technology sub-sectors, with early evidence of this already visible in market pricing
- Phase 2: Industrial and Dow-component stocks absorbing defensive inflows before ultimately reversing
- Phase 3: Broad index collapse as institutional sellers enter positions at scale
A historical parallel he draws is instructive. During the 2008 bear market, Amazon bottomed at approximately $30 per share in November 2008. By the time the broader market reached its ultimate low in March 2009, Amazon had already recovered to approximately $60. Individual stocks can bottom and recover at entirely different points within a broader bear market cycle, reinforcing the importance of distinguishing between index-level dynamics and individual stock behaviour.
For tactical traders, he recommends liquid index instruments over individual stock exposure: SPY, QQQ, DIA, and IWM ETFs, or their equivalent futures contracts in the S&P 500, NASDAQ, Dow, and Russell 2000.
Energy Markets: Why Horwitz Is a Seller of Crude Oil
The Supply Glut Thesis and Diminishing Geopolitical Premium
Horwitz's view on crude oil runs counter to the conventional war-premium narrative. He notes that each successive wave of Middle East conflict escalation has produced a diminishing crude oil price response, from a peak near $120 per barrel at the initial outbreak, to approximately $100 on the next escalation, and now trading near $80 despite ongoing hostilities. Furthermore, the crude oil price trends suggest his downside target of the mid-$50s per barrel may be well-founded.
The structural driver behind this view is global oversupply. Major producers, including Saudi Arabia, are reportedly discounting supply to Chinese buyers due to inventory accumulation that exceeds near-term demand capacity. This dynamic undermines the traditional geopolitical risk premium.
| Crude Oil Level | Implied Retail Fuel Price | Actual Retail Fuel Price | Implied Refiner Margin |
|---|---|---|---|
| $120/bbl | High | High | Normal |
| $80/bbl | Moderate | Still Elevated | Elevated |
| $55/bbl (projected) | Low | TBD | Compression Risk |
Energy equity earnings have remained strong despite falling crude prices, sustained by retail fuel pricing that has not declined proportionally to crude movements. This margin compression risk becomes acute as crude falls further and consumer demand softens in a recessionary environment.
The next major ASX story will hit our subscribers first
Gold and Silver: Near-Term Pressure, Long-Term Conviction
Why Precious Metals Are Under Technical Pressure Despite Bullish Fundamentals
Horwitz's treatment of gold and silver is one of the more nuanced aspects of his framework. He distinguishes sharply between near-term technical dynamics and long-term structural positioning. Indeed, gold as a safe haven remains a central theme throughout his broader investment thesis.
Two forces are driving current precious metals weakness:
- Rising interest rates reduce the relative appeal of non-yielding assets like gold and silver by offering investors meaningful fixed income alternatives
- Equity liquidation dynamics are forcing investors to sell gold and silver positions to cover losses in equity portfolios, a pattern that repeated during the 2008 crisis
He also notes that gold and silver ran too far too fast in the preceding period, creating the conditions for a technical overcorrection. This is a normal market behaviour pattern, not a fundamental reversal.
Key Price Levels and Accumulation Strategy
- Gold: $4,000 per ounce identified as primary support, with downside floor estimated at $3,500 to $3,800
- Silver: $55 per ounce cited as a significant support zone
- Recommended approach: Scaling into positions at support levels rather than attempting to identify an exact bottom; averaging into positions both on the way up and on the way down
Horwitz has personally held physical gold since $1,000 per ounce and physical silver since $10 per ounce, giving him direct experiential credibility on the merits of long-duration precious metals holding.
His 5-year gold price target is $7,000 to $8,000 per ounce, based on historical annualised appreciation rates. His original 2025 gold target of $6,000 has been revised given current market conditions, with a more realistic near-term trajectory toward the $5,000 range if the $4,000 support level holds.
A Critical Warning About Institutional Price Targets
When major banks publish bullish gold price targets, which several did with $5,000 to $6,000 targets, Horwitz's reading of these announcements draws on his decades of floor trading experience. His view is that large institutions have historically used public-facing bullish commentary to facilitate distribution of long positions to retail investors, rather than as genuine expressions of fundamental conviction.
He recalls the trading pit dynamics where large institutions would send small orders to one side of the market to create directional buzz while their larger orders were positioned in the opposite direction. This structural information asymmetry has not disappeared with the transition from open-outcry pits to electronic markets. Retail investors should evaluate institutional price targets critically and independently rather than treating them as reliable signals.
Central bank gold accumulation, sustained across multiple consecutive quarters by a broad range of sovereign buyers, provides a more reliable structural demand signal. This buyer base operates independently of retail and institutional sentiment and creates a demand floor that differentiates the current gold cycle from previous corrections.
Bitcoin, Cryptocurrencies, and Alternative Assets
Bitcoin's Current Range and Long-Term Trajectory
Horwitz characterises Bitcoin as currently range-bound between approximately $60,000 and $65,000, with no clear directional catalyst until a decisive breakout occurs in either direction. His long-term view is constructive, framing Bitcoin as functioning increasingly as a libertarian reserve asset, an alternative store of value for individuals who distrust fiat currency systems.
Expanding merchant acceptance, including payment processing in venues like Las Vegas sports books, and generational adoption by digital-native investors who have grown up without a relationship to physical cash, support a long-term bullish structural case.
On the broader cryptocurrency landscape, he applies a strict market capitalisation filter. Of approximately 13,000 cryptocurrencies in existence, he estimates that only around 10 to 11 meet the minimum scale and utility thresholds he would consider for serious analysis, with Ethereum and Solana cited as examples. Meme coins, pump-and-dump schemes, and undercapitalised tokens represent material retail investor hazards.
Commodity Markets Beyond Gold and Oil
The Grain Market Opportunity
Horwitz identifies agricultural commodities as one of the more compelling near-term opportunities. Hot and dry weather patterns are creating supply-side pressure, and grain prices have been recovering from their lows. Wheat has recovered above $7.00 per bushel from lows near $5.00, and soybeans have recovered above $12.00 per bushel from lows in the $11.00 range.
Agricultural equities, including Mosaic, Deere, Caterpillar, and potash producers, have lagged the underlying commodity move and represent a potential catch-up opportunity for investors willing to wait for price consolidation before entering.
Platinum Group Metals: Long-Term Value, Near-Term Fragility
Platinum represents an interesting case study in long-term value dislocation. Historically, platinum traded at a premium to gold. It now trades at approximately one-third of gold's price, a structural compression that Horwitz views as creating long-term accumulation value for patient investors.
Near-term, he identifies $1,600 per ounce as a critical support level. A breach of this level opens downside toward $1,500. He is personally a holder of platinum and would accumulate at both the $1,600 and $1,500 levels, but cautions against over-weighting near-term positions given the fragility of current support.
Portfolio Positioning Framework for a Prolonged Bear Market
Asset Class Outlook Summary
| Asset Class | Near-Term Outlook | Long-Term Outlook | Recommended Approach |
|---|---|---|---|
| U.S. Equities (broad) | Bearish (-40 to -60% risk) | Historically recovers | Hedge, eliminate leverage |
| Gold (physical) | Support at $4,000 | Bullish ($7,000-$8,000 / 5yr) | Accumulate at support levels |
| Silver (physical) | Support at $55 | Bullish | Scale in at current levels |
| Crude Oil | Bearish (mid-$50s target) | Oversupplied | Reduce or avoid exposure |
| Grain Commodities | Bullish | Structural demand | Futures or agricultural equities |
| Platinum | Cautious (support at $1,600) | Long-term bullish | Accumulate at $1,500-$1,600 |
| Bitcoin | Range-bound ($60K-$65K) | Bullish long-term | Hold, await range breakout |
| U.S. Dollar | Neutral to slight upside | Reserve currency status | Monitor; safe haven flows possible |
The Core Risk Management Principles
Regardless of asset class, Horwitz's framework returns repeatedly to a set of foundational risk management principles that apply to both traders and long-term investors:
- Define maximum acceptable loss before entering any position. Leverage forces selling at precisely the worst moments, converting temporary drawdowns into permanent capital loss.
- Maintain the distinction between trading capital and investment capital. Physical gold, silver, and platinum held for multi-year timeframes should not be evaluated against short-term trading timeframes.
- Use hedge profits to systematically accumulate long-term positions at lower prices rather than moving entirely to cash and attempting to time a precise re-entry.
- Prefer liquid index instruments over individual stocks for tactical trading during periods of broad market stress, as index-based instruments are insulated from individual company event risk.
The investor's greatest risk in a prolonged bear market is not the decline itself. It is being forced to sell at the bottom because positions were sized beyond what available capital can sustain through a multi-quarter drawdown.
The historical case for patience across market cycles remains intact. Every major U.S. equity market decline on record has ultimately been followed by recovery. The long-run average annual return of approximately 8.5% for U.S. equities holds across multi-decade timeframes, including periods that encompassed multiple major crashes. For investors with unleveraged positions, physical asset exposure, and properly hedged portfolios, a prolonged bear market represents an accumulation opportunity as much as it represents a threat.
For those wishing to explore similar forecasts from other veteran market analysts, this detailed discussion on Spitznagel's crash prediction provides additional context on the current macro environment. The Bubba Horwitz market crash prediction ultimately reinforces a timeless principle: preparation, discipline, and a clear-eyed assessment of risk are the most reliable tools available to any investor navigating uncertainty.
Disclaimer: This article is intended for informational and educational purposes only. It does not constitute financial advice. All forecasts, price targets, and market predictions discussed reflect the views of the individuals cited and involve inherent uncertainty. Past market performance is not indicative of future results. Readers should conduct their own due diligence and consult a qualified financial adviser before making any investment decisions.
Want to Position Ahead of the Next Major Mineral Discovery Whilst Markets Remain Volatile?
When broad equity markets face prolonged downturns, significant ASX mineral discoveries have historically delivered outsized returns regardless of macro conditions — Discovery Alert's proprietary Discovery IQ model scans ASX announcements in real time, instantly alerting subscribers to high-potential opportunities across more than 30 commodities. Explore historic discovery returns to understand the scale of what's possible, then begin your 14-day free trial at Discovery Alert to ensure you're positioned before the broader market takes notice.