
July 9, 2026
The Real Constraint in Gold Is No Longer Geological
For most of the past century, the central challenge in gold mining was discovery. Find the deposit, and the path forward was largely an engineering and financing exercise. That equation has fundamentally changed. The industry now knows where a significant portion of the world's remaining gold exists. What it cannot do quickly or cheaply is convert that knowledge into permitted, financed, construction-ready mines. The bottleneck has migrated from the geology department to the development office, and that shift is reshaping how institutional capital values buildable gold developers in 2026.
The companies attracting the strongest investor interest today are not necessarily those with the largest resource estimates. They are the ones that have cleared the highest-risk phases of the development process and can demonstrate a credible, financeable path to production. In the current market, that quality has a name: buildability.
When big ASX news breaks, our subscribers know first
What Makes a Gold Developer Truly "Buildable"?
The Four Pillars of Buildability
Institutional capital screens gold developers against a specific set of criteria that go well beyond total resource ounces. A genuinely buildable gold developer is one whose flagship project simultaneously satisfies four measurable conditions:
- Annual production potential of 100,000 to 300,000 ounces, placing the project within the range that is large enough to service project debt but small enough to remain financeable without a major-company partnership
- Construction capital below approximately $1 to $1.5 billion, keeping the project within the financing window accessible to development-stage companies
- An active or completed permitting pathway, preferably in a jurisdiction where the objection window has closed
- Metallurgical simplicity sufficient to execute on schedule and budget, with oxide heap-leach processing representing the gold standard for capital efficiency
These four criteria interact. A project can satisfy three of them and still fall outside the buildable category. A massive resource with complex refractory metallurgy requiring pressure oxidation may be technically viable but demands a level of capital and execution complexity that pushes it out of reach for most junior developers. Similarly, a low-capex heap-leach project in a jurisdiction with unresolved permitting risk carries a discount that erodes the valuation premium its processing simplicity would otherwise command. In fact, permitting trumps grade when it comes to determining which projects can realistically advance to construction.
How the Buildability Framework Differs From Traditional Resource Valuation
The traditional approach to valuing gold developers weighted total resource ounces heavily, treating jurisdiction and metallurgy as secondary considerations. The framework that institutional capital applies in 2026 is structurally different.
| Valuation Dimension | Traditional Resource Approach | Buildable Developer Framework |
|---|---|---|
| Primary metric | Total resource ounces (M&I + Inferred) | Permitted, economically viable ounces only |
| Capex consideration | Noted but not gatekeeping | Hard ceiling (~$1–1.5B) as a screening filter |
| Jurisdiction weighting | Secondary factor | Primary de-risking variable |
| Metallurgy | Technical footnote | Core feasibility determinant |
| Timeline to cash flow | Aspirational | Defined and financeable |
Inferred ounces, in particular, carry near-zero valuation weight in the current capital environment. They represent geological inference rather than economic certainty, and the market has become increasingly disciplined about distinguishing between the two. Enterprise value per ounce varies enormously across deposits that look superficially similar in headline resource terms, and the primary explanatory variable for that divergence is buildability.
Two Macro Forces Tightening the Physical Gold Market
Mine Supply Growing at 1% Per Year While Reserves Decline
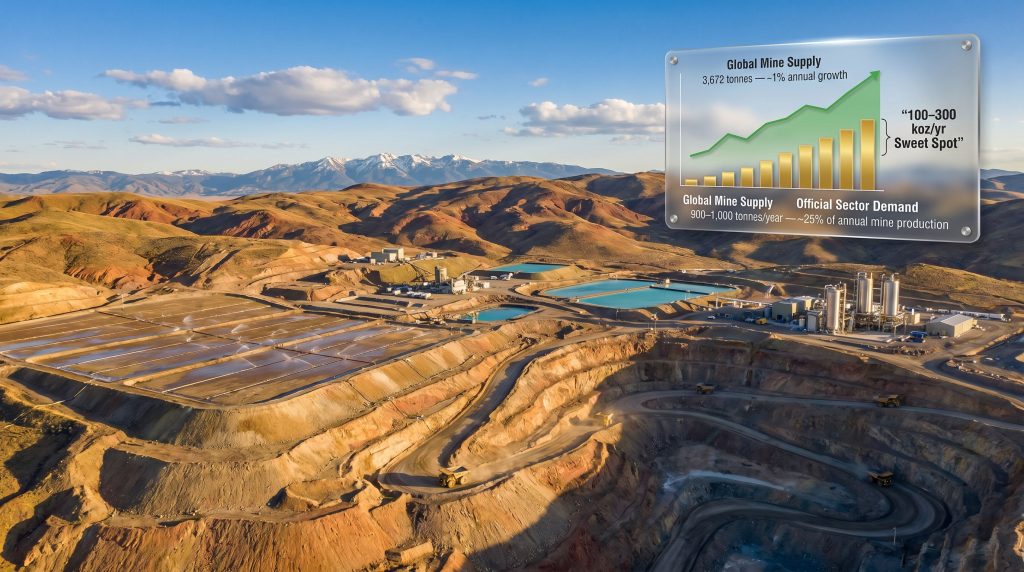
According to the World Gold Council, global mine output reached a record 3,672 tonnes in 2025, yet expanded by only approximately 1% year-over-year, extending a 15-year pattern of near-stagnant supply growth. The persistence of this constraint despite a sustained period of elevated gold prices reveals something important about the structural nature of the problem.
Higher prices do not quickly translate into higher supply because the three core barriers remain largely unchanged:
- Discovery scarcity: Tier 1 gold deposits are becoming genuinely rarer, with most of the world's accessible, high-grade surface mineralisation already identified
- Extended permitting timelines: Regulatory complexity has increased in most major mining jurisdictions over the past two decades, adding years to development timelines
- Decade-long development cycles: Even a well-financed, well-located discovery typically requires eight to twelve years from initial resource definition to first production
The reserve replacement problem compounds this dynamic. Only reserves, not total resources, underpin current mine production, and every ounce extracted reduces that inventory until replaced by new drilling and economic studies. Major producers including Newmont, Barrick, and Agnico Eagle reported lower gold output in 2025 and guided to further production declines in 2026 as reserve grades continue to mature.
The scale of production disruption from individual operations illustrates the fragility of the supply picture. Freeport-McMoRan's Grasberg mine in Indonesia, operating under force majeure, is expected to produce approximately 35% below its original 2026 target of roughly 1.6 million ounces, with full recovery not anticipated until 2027. A single operational interruption at a major mine can remove meaningful volumes from the global supply base with minimal ability to compensate from elsewhere in the system.
"The constraint in gold is no longer geological. The industry knows where gold exists. The bottleneck is converting known mineralisation into permitted, financed, construction-ready projects."
Central Banks Absorbing a Quarter of Annual Mine Output
The second structural force tightening the physical gold market is sustained official-sector demand. Goldman Sachs Research estimates that central bank gold demand has averaged 900 to 1,000 tonnes per year since 2022, representing approximately 25% of annual mine production. Gold purchased by central banks is held in reserves rather than recycled into the tradable market, meaning this demand permanently removes metal from private circulation.
The 2022 freezing of Russian sovereign reserves accelerated a multi-year reserve diversification programme among central banks globally, structurally increasing their appetite for gold as a reserve asset that carries no counterparty risk. Furthermore, central bank buying has proven largely insensitive to price, persisting through multiple cycles of gold price volatility.
The quarterly data contains important nuance. The World Gold Council reported gross official purchases of approximately 244 tonnes in Q1 2026, while J.P. Morgan estimated net reported purchases at just 16 tonnes after Türkiye sold 60 tonnes in March, noting that a meaningful share of central bank activity remains unreported. The quarterly figure should be interpreted as volatile around a structurally elevated multi-year average rather than a reliable run rate.
Gold Price Context: A Cyclical Correction Within a Structural Uptrend
Gold traded near $4,100 to $4,200 per ounce entering mid-2026, approximately 25% below its January 2026 record of roughly $5,600 per ounce, while remaining approximately 25% above year-prior levels. The correction primarily reflects higher US real-rate expectations and a reduced Middle East geopolitical risk premium, with Brent crude declining toward $72 per barrel, rather than any deterioration in the physical supply picture.
Short-term gold price movements are driven by the Federal Reserve, the US dollar, and geopolitical positioning. Long-term price direction is determined by mine supply and official-sector demand. The two timeframes are currently telling different stories, and understanding the broader gold price outlook for miners is essential for evaluating buildable gold developers whose project economics depend on sustained price assumptions rather than near-term market sentiment.
How Project De-Risking Determines Developer Valuations
The Three-Stage De-Risking Ladder
Once buildability becomes the primary valuation driver, the specific stage of de-risking a project has completed becomes the key differentiator between developers. The progression follows a recognisable sequence:
Stage 1: Economic Validation
- A Preliminary Economic Assessment establishes after-tax NPV and IRR benchmarks, providing the first systematic evidence that a deposit can generate economic returns
- A definitive feasibility study converts resources into reserves and provides the technical foundation required to approach lenders and streaming counterparties
- The NPV-to-market-cap ratio serves as a discount indicator, with wide gaps signalling either market scepticism about project execution or genuine valuation opportunity
Stage 2: Permitting Completion
- Fully permitted projects in stable jurisdictions command structural valuation premiums because the highest-risk development phase has been removed before construction capital is deployed
- The distinction between federal and state permitting pathways in the United States is material. State-permitted projects with closed objection windows carry a different risk profile than federal projects that remain open to legal challenge at any point during construction
- Wyoming, Nevada, Idaho, and Ontario represent jurisdictions where permitting pathways are relatively well-defined
Stage 3: Financing Visibility
- Construction financing through debt, streaming, royalty agreements, or equity must be demonstrably accessible before the market assigns full construction-ready valuations
- Near-term cash flow from initial low-capital production phases is the most powerful financing signal because it reduces dependence on equity markets and limits shareholder dilution
"A project on US federal land or in a jurisdiction where permits remain open to legal challenge can face construction disruption even after full permitting approval. The Wyoming state permitting process, for example, offers a closed objection window that removes a category of risk present in many other US jurisdictions, according to commentary from U.S. Gold Corp's executive leadership."
Key Metrics: What Separates Tier 1 Buildable Gold Developers
| Developer | Flagship Project | Jurisdiction | Key Buildability Signal |
|---|---|---|---|
| Liberty Gold (LGD) | Black Pine | Idaho, USA | 4.16 Moz Indicated, oxide heap-leach |
| Revival Gold (RVG) | Mercur | Utah, USA | ~$210M capex, 100 koz/yr target |
| Rupert Resources (RUP) | Ikkari | Finland | Tier 1 jurisdiction, strong margins |
| Montage Gold (MAU) | Koné | Côte d'Ivoire | 5.88 Moz M&I, construction-ready |
| U.S. Gold Corp | CK Gold | Wyoming, USA | Fully permitted, ~$630M after-tax NPV |
| New Found Gold (NFG) | Queensway/Hammerdown | Newfoundland, Canada | AISC ~$1,090–$1,300/oz, permitted mill |
| Cabral Gold (CBR) | Cuiú Cuiú | Brazil | Heap-leach construction ~70% complete |
| P2 Gold | Gabbs | Nevada, USA | After-tax NPV ~$943M, IRR ~34% |
The Five Critical Filters Every Buildable Project Must Pass
Filter 1: Production Scale in the 100 to 300 koz Sweet Spot
Projects targeting fewer than 100,000 ounces annually struggle to attract institutional financing because the revenue base is insufficient to service project debt at commercially viable rates. Projects targeting more than 300,000 ounces annually frequently require capital expenditure that exceeds what development-stage companies can raise without a major-company co-investor or strategic partnership.
The 100 to 300 koz per year range represents the intersection of financeable scale and manageable construction complexity. Revival Gold's Mercur project in Utah illustrates the lower end of this range, targeting approximately 100,000 ounces annually with initial construction capital of roughly $210 million, an open-pit heap-leach configuration that keeps both capital intensity and execution risk within bounds that development-stage financing can reach.
Filter 2: Capital Intensity Below the $1 to $1.5 Billion Ceiling
The contrast between buildable and unbuildable becomes clearest when comparing capital profiles. Revival Gold's Mercur project at approximately $210 million sits firmly within the buildable range. Seabridge Gold's KSM project in British Columbia, however, requires capex well beyond the buildable threshold, making it a strategic asset for a major mining company rather than a standalone development opportunity for a junior.
Capital cost inflation since 2021 has compressed this threshold further. Labour availability constraints, equipment lead times, and contractor capacity limitations have increased construction budgets across the industry, which means projects that appeared comfortably within the buildable capex range in 2019 may require revalidation of their cost estimates in 2026.
Filter 3: Jurisdiction Quality as a Valuation Premium Driver
The same geopolitical fragmentation driving central bank reserve diversification simultaneously increases resource nationalism risk in emerging market jurisdictions. Royalty increases, retroactive taxation, and licence reviews can materially reduce project returns after capital has been committed, a risk that is difficult to price in advance and impossible to hedge fully.
USA, Canada, Finland, and Australia represent the highest-conviction jurisdiction tier for development-stage gold financing in 2026. These regions offer relatively transparent regulatory processes, established mining law, and lower expropriation risk compared with a wide range of emerging market alternatives. For instance, advanced gold projects in Australia have attracted significant institutional attention precisely because of the country's stable permitting environment and well-established mining law.
Filter 4: Metallurgical Simplicity and the Heap-Leach Advantage
Processing complexity directly determines capital requirements, execution risk, and timeline to first production. Oxide gold amenable to heap-leach processing can be brought into production at a fraction of the capital cost of refractory sulphide deposits requiring pressure oxidation or roasting. The heap-leach process involves stacking crushed ore on a lined pad and percolating a dilute cyanide solution through it to dissolve and recover gold. It is well-understood, widely deployed, and operationally forgiving compared with high-temperature refractory processing.
Liberty Gold's Black Pine project in Idaho exemplifies the heap-leach advantage: a large-scale oxide resource with low strip ratios that compresses both capital requirements and execution risk. At the other end of the metallurgical spectrum, refractory sulphide deposits require additional processing steps that roughly double or triple capital requirements per annual ounce of production capacity, significantly narrowing the financing window.
Filter 5: Permitting Status and the Brownfield Advantage
Permitting is consistently the longest and least controllable variable in the development timeline. The difference between a resource and a mine often reduces to this single factor. Brownfield sites — those with existing processing infrastructure, established access roads, grid power connections, and historical environmental baseline data — are structurally cheaper and faster to advance than equivalent greenfield discoveries.
The capital cost of replicating major site infrastructure at a large-scale project can exceed $1 billion, representing sunk value that accrues to the developer without appearing in the resource estimate. Hycroft Mining's Nevada asset illustrates this dynamic clearly. With approximately 16.5 million ounces of gold and nearly 600 million ounces of silver, the existing site infrastructure alone would cost well over a billion dollars to replicate, a value that cannot be quantified within the resource estimate but is directly material to any development cost comparison.
"Greenfield developers often have a resource and little else. Brownfield projects with existing power, roads, and processing facilities enter the development process with a material capital advantage that is easy to underestimate from a resource-only valuation perspective."
The next major ASX story will hit our subscribers first
Near-Term Cash Flow as the Strongest De-Risking Signal
The Self-Funding Development Model
A low-capital initial production phase that generates operating cash flow before the main project construction begins fundamentally changes the financing structure available to a developer. Operating cash flow eliminates the need for repeated equity raises, protecting existing shareholders from dilution and reducing dependence on volatile junior capital markets.
Cabral Gold's Cuiú Cuiú project in Brazil demonstrates this model in practice. Approximately 70% through constructing a low-capital heap-leach operation, the company is targeting first gold in Q4 2026 at a life-of-mine grade of approximately 0.7 grams per tonne and AISC of roughly $1,200 per ounce. The near-surface oxide ore supports lower-cost heap leaching, while deeper sulphide ore would require a conventional mill in a future development phase.
The strategic logic behind the phased approach is compelling. Bringing an initial heap-leach operation into production at modest capital generates the cash flow needed to drill out a 50-target district-scale exploration portfolio, fund resource expansion, and ultimately support the feasibility study for a larger conventional processing facility — all without continuously diluting the share count through equity raises.
The Phased Development Model
- Phase 1: Low-capital heap-leach or open-pit production generates initial operating cash flow
- Phase 2: Cash flow funds exploration drilling to expand and upgrade the resource base
- Phase 3: Expanded resource supports a feasibility study for larger-scale processing
- Phase 4: Feasibility study provides the technical basis for debt financing of main construction
- Phase 5: Full-scale production achieved with materially lower equity dilution than a single-stage approach
Cost Position as a Margin Protection Mechanism
Why AISC Below $1,300 Per Ounce Changes the Risk Profile
All-in sustaining cost per ounce is the primary margin protection metric for evaluating buildable gold developers. Projects projecting AISC below $1,200 to $1,300 per ounce retain meaningful margins across a wide range of gold price scenarios, allowing developers to continue funding exploration and growth even through significant gold price corrections.
New Found Gold's Queensway project in Newfoundland outlines AISC of approximately $1,090 to $1,300 per ounce on fully funded initial capital of C$155 million, a cost position that preserves economic viability through most realistic downside price scenarios. The acquisition of a permitted mill for the Hammerdown mine reduces development risk by providing existing processing infrastructure that most explorers must build from scratch.
Projects with AISC above $1,500 per ounce carry meaningful margin risk in a sustained gold price correction and may struggle to secure construction financing at competitive terms, as lenders typically stress-test project economics against conservative price assumptions before committing capital. Consequently, funded and permitted gold developers that can demonstrate low all-in costs are attracting disproportionate institutional attention in the current cycle.
Risk Assessment: What Can Still Go Wrong for Buildable Gold Developers?
Even the strongest buildable gold developers carry risks that investors must evaluate carefully. The buildability framework reduces development risk but does not eliminate it.
| Risk Category | Description | Mitigation |
|---|---|---|
| Financing risk | Failure to close construction financing after permitting | Streaming/royalty agreements, phased production |
| Permitting risk | Third-party legal challenges in Tier 1 jurisdictions | Closed objection windows, brownfield sites |
| Construction risk | Cost inflation, labour shortages, equipment delays | Conservative contingency budgets, experienced operators |
| Gold price risk | Sustained decline compresses margins and financing availability | Low AISC position, phased development |
| Execution risk | First-time builders face steeper learning curves | Experienced management teams, proven project configurations |
Risk Disclosure: All development-stage mining companies carry a high risk of capital loss. Past resource estimates, preliminary economic assessments, and feasibility studies do not guarantee that a project will reach production or generate positive returns. Development-stage equities remain exposed to financing gaps, construction cost overruns, permitting delays, and gold price volatility.
The Valuation Framework in Summary
The investment case for buildable gold developers in 2026 rests on a convergence of structural supply constraints and a market valuation framework that has repriced buildability as the primary differentiator. Mine supply growing at approximately 1% annually while reserves continue to decline creates a structural scarcity of new production capacity that is largely independent of short-term gold price movements. Official-sector demand equivalent to approximately 25% of annual mine output removes a structurally significant volume of gold from private markets on a sustained basis.
Against that backdrop, the market has become increasingly precise about what it rewards. Large inferred resources without economic studies, permitting progress, or financing visibility attract minimal institutional interest. Projects that have demonstrated economic viability through feasibility-level studies, secured permits in stable jurisdictions, established a competitive cost position, and built a visible path to near-term cash flow command structural valuation premiums that reflect genuine development optionality rather than speculative resource size.
The buildable gold developer category is not a monolith. It spans heap-leach oxide operations at the lower end of capital intensity, brownfield redevelopments leveraging sunk infrastructure value, and advanced feasibility-stage projects in premier mining jurisdictions approaching construction financing. What they share is a credible, financeable path from current status to producing mine — a quality that has become the defining characteristic of outperforming gold developers in the current cycle.
The correction from January 2026 highs has not changed the supply outlook. It has changed what the market rewards. Capital is concentrating where buildability has been demonstrated, and the scarcity of projects that genuinely satisfy all five filters simultaneously continues to support the premium valuation assigned to those that do.
Want to Identify the Next Major ASX Mineral Discovery Before the Market Does?
Discovery Alert's proprietary Discovery IQ model delivers real-time alerts on significant ASX mineral discoveries, instantly converting complex geological and commodity data into actionable investment insights for both short-term traders and long-term investors. Explore how historic discoveries have generated substantial returns by visiting Discovery Alert's dedicated discoveries page, and begin your 14-day free trial today to position yourself ahead of the broader market.