
July 9, 2026
When Trade Routes Rewire Themselves: The Global Aluminium Shift Nobody Saw Coming
Global commodity trade routes rarely transform overnight. They evolve across decades, shaped by bilateral agreements, infrastructure investment, and long-standing commercial relationships. Yet occasionally, a single policy shock compresses years of gradual adjustment into a matter of months. The structural realignment of Canadian aluminium export flows in 2025 and 2026 is exactly that kind of event — and its consequences extend well beyond bilateral Canada-U.S. trade statistics into the pricing dynamics, supply security calculations, and procurement strategies of downstream manufacturers across three continents.
Understanding what is actually happening, why it matters, and where it leads requires moving beyond the headline figures and examining the mechanics of trade diversion, regional premium dynamics, and the downstream industries that sit at the end of the aluminium supply chain.
When big ASX news breaks, our subscribers know first
The Architecture of a Trade Diversion: How Canadian Aluminium Found New Homes
From Continental to Transatlantic: Decades of Dependency Unwinding
For most of the post-war era, Canadian aluminium smelting capacity was effectively developed in symbiosis with U.S. industrial demand. Canada's abundant hydroelectric resources, concentrated in Quebec and British Columbia, made it one of the lowest-cost producers of primary aluminium globally, and proximity to the U.S. industrial heartland meant that the vast majority of output flowed south with minimal friction. The trade relationship was deeply integrated, commercially efficient, and, as it turned out, highly exposed to political disruption.
The imposition of U.S. aluminium tariffs at 50% on Canadian aluminium fundamentally altered the economics of that southbound flow. With tariff costs of that magnitude effectively neutralising Canada's cost advantage for U.S. buyers, Canadian producers faced an urgent strategic question: where else in the world could absorb millions of tonnes of primary aluminium annually at price points that still justified the economics of Atlantic shipping?
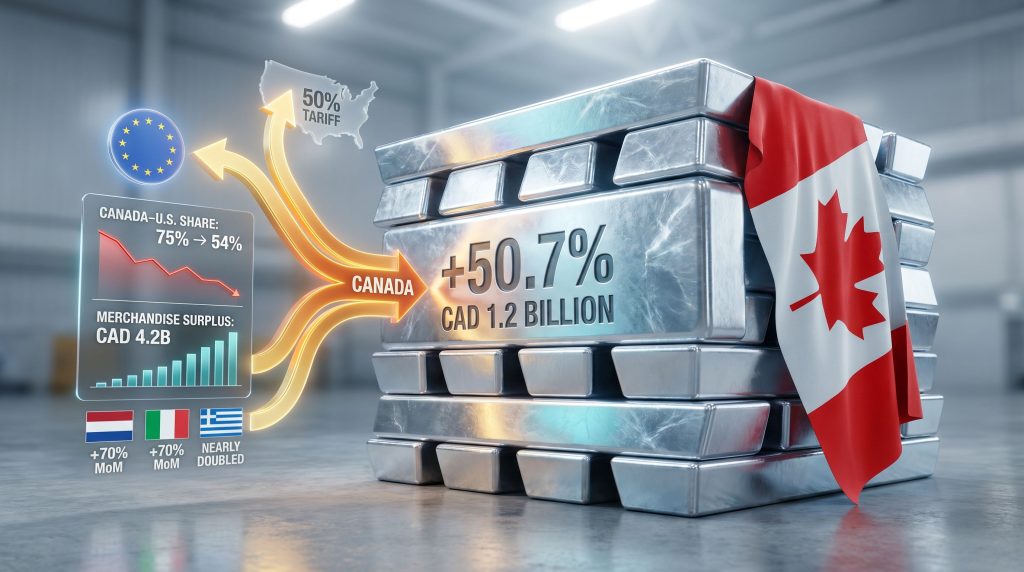
Europe answered that question. Elevated regional aluminium premiums in European markets, driven partly by the fallout from sanctions on Russian metal and partly by structurally tight domestic smelting capacity, made transatlantic shipments not merely viable but commercially attractive. The Netherlands, Italy, and Greece emerged as the primary receiving markets in May 2026, with Netherlands-bound shipments rising more than 70% month-on-month and Italian shipments nearly doubling within the same period.
The scale of this repositioning is significant: Canada's share of U.S. aluminium imports is reported to have declined from approximately 75% in 2024 to around 54% in Q1 2026, a compression that represents one of the most rapid bilateral trade share shifts in the modern aluminium industry. Note: These specific percentage figures are drawn from industry reporting and should be independently verified against official U.S. International Trade Commission data.
Why European Premiums Made the Arithmetic Work
A critical and often underappreciated dimension of this story is the regional premium structure that governs aluminium pricing. The London Metal Exchange (LME) cash price provides a global reference, but the actual price paid for physical aluminium delivery varies substantially by region, reflecting logistics costs, local supply-demand balances, and import duties. European duty-paid premiums had been running at structurally elevated levels relative to historical norms, creating a window in which the incremental freight cost of an Atlantic crossing could be absorbed while still delivering competitive landed economics for Canadian producers.
This premium dynamic is not static. Freight costs for Atlantic shipments are meaningfully higher than cross-border truck or rail movements into the United States. The ongoing commercial viability of the European export route is therefore sensitive to LME price movements, European premium compression as new supply arrives, and currency movements between the Canadian dollar and the euro. Producers who built their May 2026 export economics on a particular premium assumption may find those margins narrowing as European buyers gain leverage from increased supply optionality.
Furthermore, the broader aluminium and alumina markets are experiencing simultaneous pressures from multiple directions, making this European pivot all the more significant as a structural signal rather than a short-term adjustment.
What the May 2026 Trade Data Actually Shows
Canada's Record-Breaking Export Performance in Context
Statistics Canada's May 2026 merchandise trade release showed a country whose export base had been under considerable structural pressure emerging with a surprisingly robust performance across multiple sectors. The headline figures are presented below.
| Metric | May 2026 Value | Context |
|---|---|---|
| Total merchandise exports | CAD 77.1 billion | All-time monthly record |
| Month-on-month export growth | +0.9% | Fourth consecutive monthly increase |
| Four-month cumulative export growth | +22.2% | Across all major product categories |
| Merchandise trade surplus | CAD 4.2 billion | Strongest in four years |
| Prior month surplus (April 2026) | CAD 3.4 billion | Third consecutive positive month |
| Total merchandise imports | CAD 72.9 billion | Down 0.2% month-on-month |
The Aluminium Numbers in Detail
Within this broader performance, the aluminium segment stood apart. Canada aluminium exports jump 50.7% month-on-month, with exports of unwrought aluminium and aluminium alloys reaching a total value of CAD 1.2 billion for May — a level not recorded since the all-time monthly peak established in May 2022. This category was the single largest contributor to growth within the metals and non-metallic minerals export segment.
| Aluminium Export Metric | Figure |
|---|---|
| Month-on-month export growth (unwrought aluminium and alloys) | +50.7% |
| Total export value (May 2026) | CAD 1.2 billion |
| Last comparable peak | May 2022 |
| Segment contribution | Largest single driver within metals and non-metallic minerals |
It is worth noting that the source data, as reported by Statistics Canada, documents the export value and the principal destination markets but does not independently provide the tariff rate figure or the precise U.S. market share percentages cited elsewhere. Readers should treat those specific figures as drawn from industry commentary rather than the official trade release, and seek corroboration from primary regulatory sources.
Is the Canada Aluminium Exports Jump 50.7% a Structural Signal or a Single-Month Spike?
The Case for Structural Persistence
Several characteristics of the May 2026 data argue against dismissing the aluminium export surge as a one-time statistical artefact.
- Canada's total merchandise exports grew across four consecutive months, indicating a sustained directional shift rather than noise.
- The decline in Canada's U.S. market share, if confirmed by primary sources, would represent a demand-side structural change of a magnitude rarely reversed within a single tariff negotiation cycle.
- European buyers seeking to reduce their exposure to Russian aluminium supply chains have a strategic, not merely tactical, incentive to deepen procurement relationships with Canadian smelters.
- Replacing lost U.S. market share with diversified European and Asian buyers reduces Canadian producers' concentration risk, which has its own independent commercial logic regardless of what happens to U.S. tariff policy.
Factors That Could Moderate or Reverse the Trend
- Currency risk: A strengthening Canadian dollar against the euro directly compresses the landed economics of transatlantic shipments for European buyers.
- Freight cost exposure: Atlantic crossing logistics are structurally more expensive than Canada-U.S. overland trade. Any sustained increase in bulk carrier rates would narrow margins further.
- Policy reversal risk: Any renegotiation of U.S.-Canada trade terms that reduces or eliminates the current tariff burden could partially restore southbound flows, though rebuilding commercial relationships once disrupted takes considerably longer than policy announcements.
- European demand cyclicality: Aluminium consumption in Europe is heavily weighted toward the automotive and construction sectors, both of which are sensitive to interest rate cycles and broader economic conditions.
Disclaimer: Forward-looking observations regarding the persistence of Canadian aluminium export growth to Europe are speculative in nature and subject to significant uncertainty. Commodity markets, trade policy, and currency dynamics can shift rapidly. This analysis should not be construed as financial or investment advice.
Sector-by-Sector: What Else Built Canada's Record Surplus
The Broader Export Composition in May 2026
Aluminium dominated the headlines, but Canada's May 2026 trade surplus reflected broad-based export strength across multiple sectors.
| Export Category | Monthly Change | Key Driver |
|---|---|---|
| Metal ores and non-metallic minerals | +16.1% | Sulphur shipments, gold ores to China |
| Diamonds and other non-metallic minerals | +37.0% | Higher sulphur volumes |
| Other metal ores and concentrates | More than doubled | New gold ore and concentrate shipments to China |
| Consumer goods | +3.9% | Broad-based demand |
| Basic and industrial chemicals, plastics, rubber | +5.6% | Industrial demand recovery |
| Farm, fishing and intermediate food products | +2.4% | Agricultural export resilience |
| Nuclear fuel | +55.1% | Elevated global energy demand |
| Natural gas | +7.4% | European energy security procurement |
| Refined petroleum products | +4.6% | Margin-driven export optimisation |
| Energy products (overall) | -2.0% | Crude oil volumes declined (-5.4%) |
The gold ore and concentrate shipments to China are a particularly notable entry in this table. China's appetite for unprocessed mineral inputs reflects its processing infrastructure capacity and is a pattern that warrants monitoring as a separate trade trend in Canadian critical minerals exports.
The Import Side: Where Spending Declined
Imports edged down 0.2% overall despite gains in nine of eleven product sections. The primary drag was a sharp contraction in metal and non-metallic mineral product imports, which fell 18.2%. Within that category:
- Unwrought gold, silver, and platinum group metal imports declined 33%.
- Basic and semi-finished iron and steel purchases dropped 22.7%, reaching their lowest level since December 2020.
- Metal waste and scrap imports fell 20%.
- Non-ferrous semi-finished products and alloys declined 21.2%.
On the other side of the ledger, consumer goods imports rose 3.5%, supported by batteries and electronics sourced from China, while pharmaceutical and medicinal product imports increased 6.4%.
The Canada-U.S. Bilateral Balance: A Surplus at Its Widest in Over a Year
Bilateral Trade Scorecard
| Bilateral Metric | April 2026 | May 2026 |
|---|---|---|
| Canadian exports to U.S. | Growth (third consecutive month) | +1.5% MoM (fourth consecutive monthly gain) |
| Canadian imports from U.S. | Previous level | -1.4% MoM |
| Canada-U.S. merchandise trade surplus | CAD 10.3 billion | CAD 11.6 billion (highest since January 2025) |
The Non-U.S. Trade Picture
While the Canada-U.S. bilateral dynamic improved further in May, the rest-of-world trade picture showed ongoing structural challenges. Canadian exports to non-U.S. destinations slipped 0.3% after a 4% decline in April, while imports from those countries rose 1.5%, widening the non-U.S. merchandise trade deficit from CAD 6.9 billion to CAD 7.4 billion.
Higher aluminium and nuclear fuel shipments to the Netherlands partially offset weaker gold exports to the United Kingdom. However, the overall trajectory underscores a critical vulnerability in Canada's trade diversification story.
Canada's overall trade strength remains disproportionately anchored to its bilateral U.S. relationship. The widening non-U.S. deficit is a structural reminder that pivoting trade flows at scale, while commercially feasible in high-value commodity categories like aluminium, is a far more complex undertaking across the full breadth of Canadian export industries.
The next major ASX story will hit our subscribers first
Ripple Effects Across the Global Aluminium Value Chain
What the Shift Means for Downstream Industries
The redirection of Canadian primary aluminium flows carries meaningful consequences for manufacturers throughout the value chain.
For European downstream manufacturers:
- Automotive original equipment manufacturers, aerospace component producers, and packaging converters across continental Europe gain improved access to competitively priced Canadian primary aluminium.
- Netherlands-based trading houses and processing facilities are positioned as the primary redistribution hub for Canadian material entering continental Europe, reinforcing Rotterdam's historical role as a global commodity logistics centre.
- Increased supply availability could ease input cost pressures that have been a persistent competitive headwind for European aluminium-intensive manufacturers operating against Asian competitors with access to cheaper primary metal.
For U.S. aluminium consumers:
- Reduced Canadian supply availability within the U.S. domestic market tends to sustain elevated domestic aluminium premiums, increasing input costs for automotive, construction, and packaging manufacturers.
- Downstream U.S. industries that relied on the Canada-U.S. integrated supply chain face the prospect of sourcing from more distant suppliers at higher logistics cost, or absorbing elevated premiums from domestic smelters who face less import competition.
For global aluminium pricing:
- The sustained redirection of Canadian primary metal toward Europe creates a genuine supply-demand rebalancing signal in both the LME and regional premium markets.
- LME cash prices and European duty-paid premiums will increasingly reflect the new geography of Canadian supply availability, with potential knock-on effects on Middle Eastern, Australian, and Indian producer pricing strategies.
The Casting and Extrusion Segments: Why Downstream Demand Matters
Global aluminium casting usage is forecast to reach 24.2 million tonnes in 2026, according to industry forecasts, with the casting segment representing one of the most demand-intensive applications for primary metal. Meanwhile, the extrusion segment, which encompasses construction profiles, transportation components, and industrial applications, remains a critical consumer of unwrought aluminium and alloys of the type Canada produces in volume.
These downstream demand anchors mean that the structural case for elevated Canadian aluminium export volumes is not solely a function of tariff-driven trade diversion. It also reflects genuine, growing end-use demand from sectors transitioning toward lighter-weight, higher-strength materials across automotive electrification, sustainable construction, and aerospace applications.
Lesser-Known Dynamics Shaping the Canadian Aluminium Export Story
Hydroelectric Intensity as a Competitive Differentiator
One aspect of Canadian aluminium production that receives insufficient attention in trade commentary is the carbon intensity profile of the metal itself. Canadian smelters, particularly those in Quebec, are powered overwhelmingly by hydroelectric generation. This gives Canadian primary aluminium one of the lowest carbon footprints of any major producing nation globally — a characteristic that is becoming increasingly commercially significant as European buyers face tightening obligations under the EU Carbon Border Adjustment Mechanism (CBAM).
Under CBAM, importers of aluminium into the European Union are required to account for the embedded carbon in their purchases, with higher-carbon metal subject to additional costs. Canadian hydropower-smelted aluminium carries a structural premium in this framework, making it not just price-competitive but compliance-advantaged relative to coal-powered Chinese or Russian production. In addition, the EU metals action plan reinforces incentives for European buyers to favour low-carbon suppliers, further strengthening the long-term case for Canadian supply. This dynamic could reinforce European buyer preference for Canadian supply well beyond the current tariff-driven diversion cycle.
Consequently, initiatives such as low-carbon aluminium operations being developed across the industry demonstrate that the broader competitive landscape is shifting toward emissions-conscious production — precisely the profile that benefits Canadian producers in a CBAM-constrained European market.
The Alloy Composition Question
Not all primary aluminium is identical in its downstream utility. The specific alloy chemistry of unwrought aluminium determines its suitability for different end-use applications. Canadian smelters produce a range of alloy grades, and the composition of exports flowing to European destinations will partly determine how quickly those materials can be absorbed into existing European processing infrastructure. Mismatches between alloy supply and downstream processing requirements can create logistical bottlenecks even when headline trade volumes are growing rapidly.
Regional Premium Mechanics for Non-Specialist Readers
For readers less familiar with how aluminium is priced in physical markets, the concept of regional premiums is worth briefly explaining. The LME price is a global benchmark, but physical aluminium buyers pay the LME price plus a regional premium that reflects the all-in cost of getting metal to their facility. This premium covers freight, insurance, warehousing, and local supply-demand imbalances. When European premiums are elevated, it creates a wider window within which suppliers from distant origins, including Canada, can profitably serve those markets. When premiums compress, that window narrows.
The broader impact of steel and aluminium tariffs on global premium structures is a useful frame for understanding why these regional differentials have been so pronounced throughout 2025 and into 2026, as tariff-driven supply dislocations have simultaneously tightened some regional markets while oversupplying others. According to Reuters reporting on Canada's trade realignment, geopolitical factors — including the Iran conflict's upward pressure on aluminium prices — have further reinforced the commercial logic driving Canadian producers toward European markets.
Furthermore, analysis from The Conversation highlights that Canadian aluminium industry innovation could open entirely new markets over the medium term, suggesting the current European pivot may be only the first phase of a broader global diversification strategy.
FAQ: Canada Aluminium Exports Jump 50.7%
Why did Canada's aluminium exports jump 50.7% in May 2026?
The surge was driven by a strategic redirection of Canadian aluminium shipments away from the United States toward European markets, following the imposition of a substantial U.S. tariff on Canadian aluminium. Elevated European regional premiums made transatlantic trade economically attractive for Canadian producers seeking to replace lost U.S. market access.
Which countries received the most Canadian aluminium in May 2026?
The Netherlands, Italy, and Greece were the principal destinations, according to Statistics Canada data. Netherlands-bound shipments rose more than 70% month-on-month, while Italian shipments nearly doubled over the same period.
What was Canada's aluminium export value in May 2026?
Exports of unwrought aluminium and aluminium alloys reached CAD 1.2 billion in May 2026, the highest monthly value recorded since the all-time peak in May 2022.
What was Canada's overall trade surplus in May 2026?
Canada's merchandise trade surplus reached CAD 4.2 billion in May 2026, the strongest level in four years, up from CAD 3.4 billion in April.
Why does Canada's carbon-low aluminium matter for European buyers?
Under the EU's Carbon Border Adjustment Mechanism, European importers face obligations tied to the embedded carbon of imported goods. Canadian hydroelectric-powered aluminium carries a significantly lower carbon footprint than coal-powered production, providing a compliance advantage that could sustain European demand for Canadian metal beyond the current tariff-driven trade diversion.
Is the aluminium export growth expected to continue?
The structural case for continued European-oriented exports is supported by sustained U.S. tariffs, European supply diversification strategies, and CBAM-related incentives favouring low-carbon metal. However, freight cost economics, currency movements, European demand cycles, and potential U.S. tariff renegotiation all represent meaningful moderating factors. This remains a speculative outlook rather than a confirmed trajectory.
Key Takeaways: Canada's Aluminium Trade Realignment at a Glance
- Canada aluminium exports jump 50.7% in May 2026, reaching CAD 1.2 billion — the highest level since May 2022.
- The aluminium category was the single largest contributor to growth within Canada's metals and non-metallic minerals export segment.
- Canada posted a record CAD 77.1 billion in total merchandise exports for May 2026, extending the monthly growth streak to four consecutive months.
- The merchandise trade surplus reached a four-year high of CAD 4.2 billion, up from CAD 3.4 billion in April.
- The Canada-U.S. bilateral merchandise trade surplus widened to CAD 11.6 billion, the highest level since January 2025.
- The Netherlands, Italy, and Greece were the principal destinations for the surge in Canadian aluminium shipments.
- Canadian aluminium's low carbon footprint, derived from hydroelectric smelting, represents a structural competitive advantage under EU CBAM frameworks that could sustain European demand independently of tariff dynamics.
- Canada's non-U.S. trade deficit widened to CAD 7.4 billion, underscoring the ongoing challenge of trade diversification at scale beyond the bilateral U.S. relationship.
Disclaimer: This article is intended for informational purposes only and does not constitute financial, investment, or trade advice. Forward-looking statements regarding trade flows, commodity prices, and policy developments involve significant uncertainty. Readers are encouraged to consult primary data sources including Statistics Canada and relevant regulatory bodies for the most current figures.
Want to Know Which ASX Mineral Discoveries Could Deliver the Next Major Return?
Discovery Alert's proprietary Discovery IQ model scans ASX announcements in real time, instantly identifying significant mineral discoveries across more than 30 commodities — including the critical metals and industrial minerals reshaping global supply chains like those explored in this article. Explore historic discovery returns on Discovery Alert's dedicated discoveries page and begin your 14-day free trial to position yourself ahead of the broader market.