
August 13, 2026
The Geometry of Global Aluminium Trade Is Shifting Faster Than Most Realise
Commodity trade corridors rarely change overnight. They are built over decades through infrastructure investment, contractual relationships, logistical familiarity, and pricing conventions that become deeply embedded in industrial supply chains. Yet when policy shock intersects with structural demand pull, those corridors can bend with surprising speed. That is precisely what is unfolding across North Atlantic aluminium trade in 2025 and 2026, as the Canada aluminium trade US vs EU dynamic finds itself simultaneously managing a contracting relationship with its largest historical partner and nurturing a rapidly expanding one with a new strategic counterpart.
Understanding this shift requires more than reading headline tonnage figures. It demands an appreciation of the underlying forces, including tariff economics, carbon border policy, hydropower metallurgy, and margin compression, that are collectively redrawing Canada's aluminium trade geography in real time. Furthermore, the top aluminium companies operating across both continents are actively repositioning their commercial strategies in response.
When big ASX news breaks, our subscribers know first
What the Trade Data Actually Reveals About Canada's Aluminium Import Sources
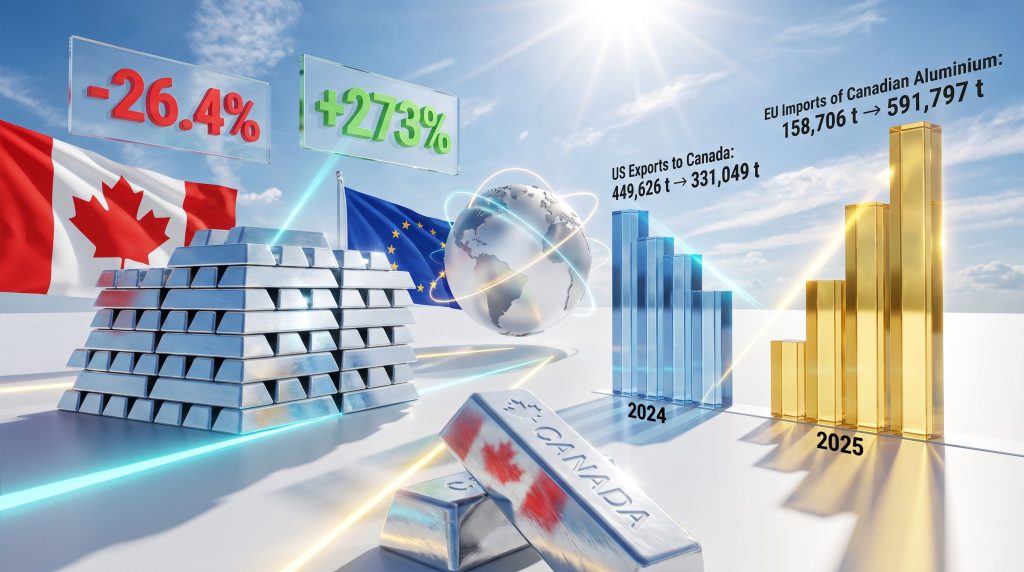
The raw numbers tell a story of divergence. US aluminium exports to Canada reached 110,166 tonnes during January through May 2026, a figure that represents a substantial compression from the 169,305 tonnes shipped over the same five-month window in 2025 and the 203,403 tonnes recorded in 2024. On an annual basis, US exports to Canada contracted from 449,626 tonnes in 2024 to 331,049 tonnes in 2025, a decline of 26.4% that has continued into 2026 without signs of reversal.
The EU trajectory runs in the opposite direction entirely. Official trade data shows EU aluminium exports to Canada reached 18,477 tonnes during January through April 2026, compared with 15,630 tonnes in the same period of 2025 and 11,567 tonnes in 2024. Extrapolating from the January to April trend, estimated January through May 2026 EU exports to Canada stand at approximately 23,096 tonnes, versus an estimated 19,537 tonnes in the corresponding 2025 period and 14,458 tonnes in 2024. Over the full year, EU exports to Canada climbed from 34,349 tonnes in 2024 to 49,578 tonnes in 2025, a year-on-year expansion of 44.3%.
Note on methodology: EU January through May 2026 figures represent estimates extrapolated from officially reported January through April trade data. US figures reflect fully reported January through May trade data.
Despite the EU's strong growth rate, the volume gap between the two suppliers remains considerable. During the first five months of 2026, US aluminium exports to Canada were approximately 4.8 times greater than estimated EU shipments. The US retains its position as Canada's dominant aluminium import source by a wide margin, but the direction of momentum has unambiguously shifted.
Trade Volume Comparison: US vs EU Aluminium Exports to Canada
| Metric | United States | European Union |
|---|---|---|
| Jan–May 2026 Exports to Canada | 110,166 tonnes | ~23,096 tonnes (est.) |
| Jan–May 2025 Exports to Canada | 169,305 tonnes | ~19,537 tonnes (est.) |
| Jan–May 2024 Exports to Canada | 203,403 tonnes | ~14,458 tonnes (est.) |
| Full Year 2025 Exports to Canada | 331,049 tonnes | 49,578 tonnes |
| Full Year 2024 Exports to Canada | 449,626 tonnes | 34,349 tonnes |
| Year-on-Year Change (2024–2025) | -26.4% | +44.3% |
| Volume Gap (Jan–May 2026) | ~4.8x larger than EU | Base comparison |
How Tariff Architecture Redirected Canadian Aluminium Export Flows
The single most consequential policy event reshaping Canada's aluminium trade geography was the imposition of US aluminium tariffs at 50%, a measure that fundamentally altered the economics of sending Canadian metal south of the border. Before this tariff escalation, Canada supplied the overwhelming majority of US aluminium import demand, with Canada's share of total US aluminium imports sitting at approximately 75% in Q1 2024. That figure eroded to roughly 63% in Q1 2025 and further to an estimated 54% in Q1 2026, a trajectory reflecting persistent structural displacement rather than a temporary market fluctuation.
The export volume data confirms the scale of this dislocation. Canadian aluminium exports to the United States fell from 1,348,851 tonnes in January through May 2024 to 1,225,772 tonnes in the same period of 2025, and further to 945,165 tonnes in January through May 2026. On an annual basis, Canadian exports to the US dropped from 3,153,009 tonnes in 2024 to 2,397,546 tonnes in 2025, a contraction of approximately 24%.
What makes this period analytically distinctive is not simply the loss of US market access but the speed and scale of the compensatory trade redirection toward Europe. According to Reuters reporting on Canada's trade pivot, EU imports of Canadian aluminium surged from 158,706 tonnes in 2024 to 591,797 tonnes in 2025, an extraordinary annual increase of approximately 273%. In the first four months of 2026 alone, EU imports of Canadian aluminium reached 106,860 tonnes, compared with just 28,562 tonnes in the equivalent period of 2025.
Canadian Aluminium Export Flows: US vs EU Comparison
| Export Destination | Jan–May 2024 | Jan–May 2025 | Jan–May 2026 | Annual 2024 | Annual 2025 | YoY Change |
|---|---|---|---|---|---|---|
| United States | 1,348,851 t | 1,225,772 t | 945,165 t | 3,153,009 t | 2,397,546 t | -24% |
| European Union | ~38,264 t (est.) | ~35,703 t (est.) | ~133,575 t (est.) | 158,706 t | 591,797 t | +273% |
The Margin Cost of Diversification: Why EU Sales Come at a Price
Trade redirection at this scale is rarely cost-neutral, and Canada's aluminium pivot toward Europe is no exception. The Bank of Canada has noted that while producers managed to successfully redirect substantial export volumes toward European markets following US tariff escalation, this achievement came with a financial trade-off. European spot premiums, while offering genuine offtake alternatives, did not fully compensate for the pricing advantage that access to the US market historically provided.
The additional logistics burden of transatlantic shipping, combined with the lower premium structure of European spot markets relative to US Midwest premiums, produced a compression in producer margins that remains an ongoing challenge for Canadian smelters in 2026. Consequently, the broader impact on aluminum and alumina markets has been significant, with pricing dynamics shifting across both continents.
This margin compression is an important nuance often absent from high-level trade flow analysis. Volume growth toward the EU and declining US volumes are not symmetrical in their profitability impact. Canadian producers are moving more metal to Europe than ever before, but the financial return per tonne is lower than what the US market historically delivered. This reality shapes the strategic calculus for any future scenario involving US tariff rollback or renegotiation.
Why Canadian Aluminium Has a Structural Advantage in European Markets
Not all aluminium is equal in the eyes of European buyers, and this matters enormously for understanding why the Canada-EU trade relationship has deepened so quickly and why it may prove durable rather than transitional.
The Carbon Intensity Dimension
Canadian aluminium production is predominantly powered by hydroelectricity, which gives it one of the lowest carbon footprints of any primary aluminium produced globally. This characteristic, largely a function of geography and infrastructure investment made decades ago, is now a commercially significant asset under the EU's evolving regulatory framework. Indeed, developments such as aluminium operations repowering initiatives demonstrate how the industry is doubling down on clean energy credentials globally.
The Carbon Border Adjustment Mechanism (CBAM), which the EU is progressively implementing across carbon-intensive imported goods, applies a carbon cost to imports based on their embedded emissions. For aluminium produced in coal-intensive smelting environments, this mechanism adds meaningful cost burdens. For Canadian hydropower-smelted aluminium, however, CBAM represents a relative competitive advantage, creating a structural pricing benefit versus suppliers from regions with higher-carbon electricity grids.
The carbon intensity of aluminium production varies dramatically by energy source:
- Hydropower-based smelting (Canada, Norway, Iceland): approximately 2 to 4 tonnes of CO2 equivalent per tonne of aluminium produced
- Natural gas-based smelting: approximately 8 to 12 tonnes of CO2 equivalent per tonne
- Coal-based smelting (significant portions of Chinese and Indian production): approximately 15 to 20 tonnes of CO2 equivalent per tonne
Under CBAM's carbon pricing logic, this differential translates directly into cost competitiveness. Canadian producers are not simply benefiting from temporary trade diversion; they are entering a European market that is structurally reformatting its sourcing incentives in ways that favour low-carbon primary metal.
European Supply Security as a Structural Pull Factor
European aluminium buyers have their own reasons to diversify supply sources beyond pricing alone. Disruptions to Russian aluminium supply chains following geopolitical events created heightened awareness among European industrial consumers about single-source dependency risk. Canada, as a politically stable, high-volume, low-carbon supplier with established logistics capability, represents precisely the kind of counterparty that European buyers have been seeking.
The 273% surge in EU imports of Canadian aluminium between 2024 and 2025 reflects not just price-driven trade diversion but a deliberate broadening of European supply strategies. Furthermore, Canadian aluminium exports to the EU have continued rocketing upward as European buyers formalise long-term sourcing arrangements with North American producers.
Volume Leadership vs Growth Leadership: A Distinction That Matters
A critical analytical error in reading the Canada aluminium trade US vs EU data is conflating current volume dominance with future trajectory. The United States is still Canada's largest aluminium trading partner across both import and export flows by a substantial margin. That fact is not in dispute. However, growth leadership — the measure of which relationship is expanding and which is contracting — belongs unambiguously to the EU.
Consider the directional signals embedded in the data:
- US exports to Canada declined by 26.4% year-on-year in 2024 to 2025
- EU exports to Canada grew by 44.3% over the same period
- Canadian exports to the US fell by roughly 24% annually
- Canadian exports to the EU expanded by approximately 273% annually
These are not marginal fluctuations around a stable trend. They represent a structural reorientation of trade flows that, if sustained, will materially alter Canada's aluminium trade geography over a three-to-five-year horizon. The 4.8x volume gap between US and EU aluminium exports to Canada in early 2026 reflects where Canada's trade relationships have been, not necessarily where they are heading.
The next major ASX story will hit our subscribers first
Scenario Analysis: Three Possible Pathways for Canada's Aluminium Trade
Scenario 1: US Tariff Reduction and Partial Trade Normalisation
If the US were to reduce or eliminate its 50% aluminium tariff, Canadian export volumes to the south could partially recover. However, the scale of EU supply chain relationships established during 2025 and 2026 means that producers who have invested in European logistics, pricing agreements, and customer relationships are unlikely to fully revert to a US-first commercial strategy. The EU's share of Canadian aluminium exports would likely stabilise at a structurally higher floor than its pre-2025 baseline, even under tariff normalisation conditions.
Scenario 2: Sustained Trade Diversion and Deepening EU Integration
If US tariffs persist at current levels, or escalate further, the EU's share of Canadian aluminium export flows could continue expanding. The broader consequences of aluminum and steel tariffs extending beyond 2025 would reinforce this directional momentum. The 273% annual growth rate recorded in 2025 would moderate as the base effect grows, but the directional momentum would remain strongly positive.
Scenario 3: Multilateral Trade Fragmentation and Multi-Corridor Development
A broader fragmentation of global aluminium trade, driven by geopolitical realignment, the progressive implementation of CBAM, and competing industrial policies across major economies, could create multiple new export corridors for Canadian producers simultaneously. Markets across Asia, the Middle East, and South America may emerge as secondary diversification destinations alongside the EU, producing a more geographically distributed Canadian aluminium export profile than has ever previously existed.
Frequently Asked Questions: Canada Aluminium Trade US vs EU
Is the EU replacing the US as Canada's primary aluminium trading partner?
No. The US remains Canada's largest aluminium trading partner by a significant volume margin. US exports to Canada in January through May 2026 were approximately 4.8 times greater than estimated EU volumes. However, EU trade is growing at a substantially faster rate across all measured time periods.
Why are Canadian aluminium exports to the EU increasing so sharply?
The primary catalyst is the US 50% aluminium tariff, which reduced the economic viability of the US market for Canadian producers. European markets offered accessible alternative demand, particularly given Canada's low-carbon aluminium credentials and the EU's CBAM framework creating preference for clean metal supply.
Are Canadian producers earning equivalent margins from EU sales?
According to the Bank of Canada, producers redirecting aluminium to Europe are doing so at lower profit margins than they historically achieved in the US market. This reflects higher transatlantic logistics costs and lower European spot premiums compared to US Midwest pricing conventions.
What is CBAM and why does it advantage Canadian aluminium specifically?
CBAM is the EU's Carbon Border Adjustment Mechanism, which applies a carbon cost to imported goods proportional to their production emissions. Canadian aluminium, produced predominantly using hydroelectric power, carries among the lowest carbon intensities of any primary aluminium globally, giving it a structural cost advantage versus coal-intensive competitors under this regulatory framework.
Key Takeaways: Canada's Aluminium Trade Realignment in 2026
- Volume leader: The US remains Canada's largest aluminium import source and export destination by a wide margin, with US exports to Canada approximately 4.8x greater than EU volumes in early 2026
- Growth leader: The EU is expanding its aluminium trade relationship with Canada at a pace that significantly outpaces the US, with annual EU exports to Canada growing 44.3% between 2024 and 2025
- Export redirection at scale: Canadian aluminium exports to the EU surged approximately 273% annually between 2024 and 2025, a direct consequence of US tariff-driven market displacement
- Import contraction: US aluminium exports to Canada fell 26.4% between 2024 and 2025, with further declines recorded through the first five months of 2026
- Margin reality: Canadian producers are accessing European markets at lower per-tonne profitability than the US historically provided, creating a financial trade-off that accompanies geographic diversification
- Structural alignment: Canada's hydropower-smelted aluminium holds a durable competitive advantage under EU CBAM requirements, positioning the trade relationship for long-term growth beyond current tariff-driven volumes
- Strategic outcome: Canada is actively reducing its single-market dependency on the US without a wholesale pivot away from North American trade, producing a more geographically distributed export profile that will define the industry through 2027 and beyond
Disclaimer: Trade volume figures referenced in this article are sourced from official reported data where available. EU January through May 2026 figures represent estimates extrapolated from January through April official data. Scenario analyses and forward-looking assessments represent analytical projections based on current trade trajectories and are not guarantees of future outcomes. Readers making commercial or investment decisions should consult primary data sources and independent analysis. Readers seeking additional data on global aluminium trade flows and market dynamics can explore ongoing industry coverage available through AL Circle.
Want to Capitalise on the Next Major Commodity Discovery Before the Market Moves?
The structural shifts reshaping global aluminium trade corridors are a reminder that commodity markets reward those who act on emerging signals early — Discovery Alert's proprietary Discovery IQ model delivers real-time ASX mineral discovery alerts straight to subscribers, turning complex commodity data into actionable investment insights across 30+ commodities. Explore historic discoveries and their market-moving returns to understand the opportunity, then begin your 14-day free trial to position yourself ahead of the broader market.