July 15, 2026
When Geopolitical Shocks Become Economic Windfalls
Global commodity markets have a long history of turning regional conflicts into unexpected economic beneficiaries far removed from the theatre of war. When supply chains rupture, the world's most price-sensitive exports become bargaining chips, and resource-rich nations that maintain stable infrastructure and rule of law suddenly find themselves in extraordinary demand. Canada trade surplus on high oil in March 2026 is a textbook illustration of this dynamic, where a combination of Middle Eastern conflict, safe-haven capital flows, and structural shifts in energy demand alignment converged to deliver the country's most dramatic single-month trade reversal in recent memory.
Understanding what actually drove this outcome, and more critically what it signals going forward, requires peeling back the headline number to examine the forces operating beneath it.
When big ASX news breaks, our subscribers know first
From Deep Deficit to Surprise Surplus: The March 2026 Trade Reversal
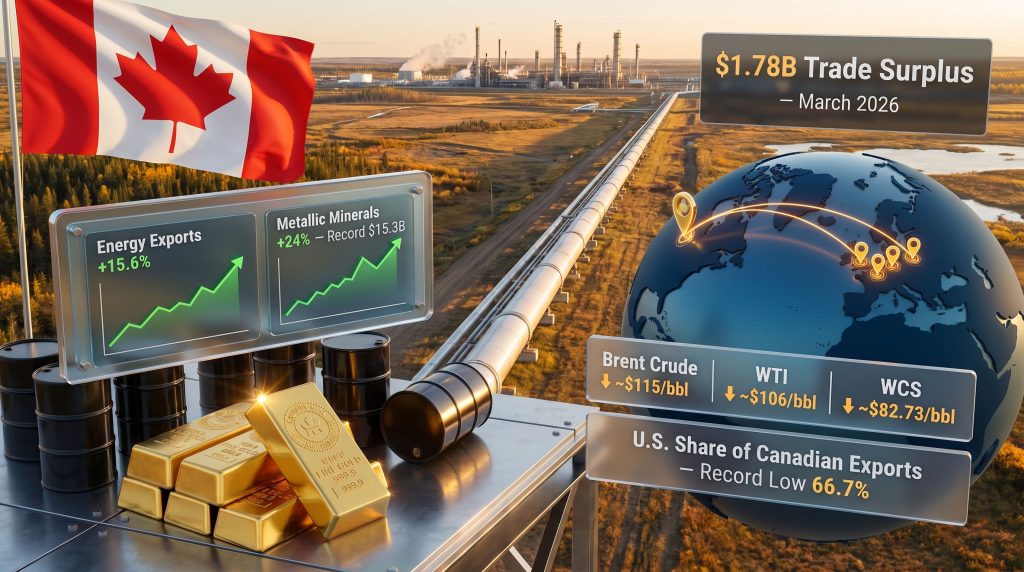
Canada's merchandise trade balance completed a remarkable swing in March 2026, moving from a $5.1 billion deficit in February to a $1.78 billion surplus within a single reporting period. This represented the country's first positive trade reading since September 2025, and it arrived with considerable force given that market consensus had positioned for a $2.88 billion deficit. According to Statistics Canada, the gap between expectation and outcome — approximately $4.66 billion — reflects just how rapidly commodity price dynamics can override underlying structural trade trends.
The mechanics of the reversal operated simultaneously from both sides of the ledger:
- Total exports climbed 8.5% to $72.8 billion, representing the second-highest export value ever recorded in Canadian trade data and the strongest monthly reading since January 2025
- Total imports contracted 1.6% to $71 billion, driven by reduced consumer goods purchases and a 12.8% drop in aircraft and transportation equipment imports
- A 9.3% decline in pharmaceutical product imports added further compression on the import side
The dual-direction movement amplified the apparent improvement, but economists at TD Economics and RBC were quick to identify the critical caveat: underlying export volumes actually declined by approximately 0.3% during the same period. Canada did not ship more goods. It simply received more money for the goods it already shipped, owing almost entirely to elevated commodity prices driven by geopolitical disruption.
"The surplus reflects commodity price inflation rather than structural improvement in trade competitiveness. When volumes decline while values surge, the durability of any surplus becomes directly dependent on whether those prices hold."
How the Iran War Engineered a Canada Trade Surplus on High Oil
The Strait of Hormuz Effect on Canadian Energy Revenues
The closure of the Strait of Hormuz during the Iran conflict disrupted approximately 20% of global seaborne oil trade, creating one of the most acute supply shocks in recent energy market history. Why strait of Hormuz disruptions move global oil markets so dramatically became clear as Goldman Sachs reported that global oil inventories fell to an eight-year low in response, with consuming nations scrambling to secure alternative sources. Canada, positioned as a stable non-OPEC producer with existing pipeline and export infrastructure, emerged as a preferred alternative for European refiners seeking to reduce their exposure to Middle Eastern supply chains.
The result was a dramatic acceleration in Canadian energy export revenues:
- Energy exports surged 15.6% year-over-year to reach $17.1 billion, the highest level since late 2022
- Crude oil shipment values jumped approximately 18.9%, closely mirroring the near-20% spike in crude prices during the conflict period
- Germany and the Netherlands emerged as key destination markets, signalling a meaningful geographic diversification beyond the historically dominant United States market
Crude Oil Benchmark Pricing During the Crisis Period
| Benchmark | Peak Level (March-May 2026) | Post-Ceasefire Talk Level |
|---|---|---|
| Brent Crude | ~$115/bbl | ~$100.62/bbl |
| WTI Crude | ~$106/bbl | ~$95.10/bbl |
| Western Canadian Select (WCS) | ~$89-90/bbl (est.) | ~$82.73/bbl |
| Canadian Condensate | ~$104/bbl (est.) | ~$97.23/bbl |
Western Canadian Select, the benchmark grade produced from Alberta's oil sands, deserves particular attention for investors and trade analysts. WCS is a heavy, high-sulphur crude blend that typically trades at a significant discount to West Texas Intermediate, often in the range of $20-30 per barrel, due to its higher density and the additional refining complexity required to process it.
Despite this discount structure, the surge in global crude benchmarks during the Hormuz closure lifted WCS prices substantially, with the spread to WTI remaining elevated partly due to Canadian pipeline capacity constraints that limit the speed at which export volumes can respond to price signals.
Canadian Natural Resources has publicly stated that new pipeline infrastructure is essential to unlock further growth from the oil sands, underscoring the frustrating paradox facing Canadian energy producers: prices are elevated, demand is strong, but the ability to increase physical shipments is constrained by infrastructure bottlenecks rather than production limitations. Furthermore, how pipeline constraints shape Canadian exports adds another layer to this supply inelasticity, which is actually a less-discussed factor that contributes to Canada's relatively muted volume growth even during periods of peak pricing.
Gold's Role in Pushing Canada's Mineral Exports to Record Territory
The Safe-Haven Surge and Its Subsequent Unwind
While energy grabbed the headline attention, Canada's precious metals exports delivered arguably the more striking statistical performance in March 2026. Exports of metallic and non-metallic mineral products reached a record $15.3 billion, a 24% year-over-year increase, with the dominant driver being a 37.7% surge in unwrought gold, silver, and platinum group metal exports. The United Kingdom served as the primary destination, consistent with London's central role in global physical gold settlement through the London Bullion Market Association framework.
Gold had surged above $5,400 per ounce following the outbreak of the Iran war, retreating from a January 2026 peak of over $5,590/oz before finding temporary support on geopolitical demand. By early May 2026, however, gold had retreated further to approximately $4,715/oz, representing a decline of roughly 15.7% from the January highs and exposing the fragility of the safe-haven premium that had buoyed Canadian mineral export revenues. The gold price outlook and what drives safe-haven demand remains a critical consideration for forecasting Canada's mineral export trajectory in coming months.
The mechanism behind this gold unwind is instructive and worth understanding in depth. Throughout late 2025 and early 2026, substantial speculative capital and heavily leveraged positions had accumulated in gold markets as investors positioned for a combination of recession risk, dollar weakness, and geopolitical uncertainty. When oil prices above $110 per barrel began transmitting clearly into consumer price inflation, the narrative governing markets shifted decisively from geopolitical shock to inflation shock. This transition triggered a sequence that experienced market participants would recognise as a classic crowded-trade unwind:
- Elevated oil prices fuelled expectations of persistent inflation
- Inflation expectations forced a repricing of Federal Reserve policy from cuts to potential hikes
- The Fed held rates steady at 3.5%-3.75% in March 2026, signalling a pause to its easing cycle
- Markets began pricing in an additional 20-44 basis points of rate increases by end-2026
- Higher rate expectations increased the opportunity cost of holding non-yielding gold
- Leveraged long positions unwound rapidly, amplified by margin calls in equity markets
- Gold's liquidity made it the preferred asset to sell to raise cash, accelerating the decline
"This dynamic illustrates a less-appreciated truth about gold: during multi-asset crises, gold often falls alongside risk assets in the early stages of a market dislocation, not because its safe-haven properties disappear, but because it is among the most liquid assets available to investors covering losses elsewhere."
The Volume-Value Gap: Why the Surplus May Not Last
Dissecting the Price-Driven Nature of Canada's Trade Performance
The most analytically important dimension of Canada's March 2026 trade surplus is one that received far less attention than the headline figure itself. While export values climbed 8.5%, physical export volumes contracted by approximately 0.3%. This inverse relationship between values and volumes is the diagnostic signature of a price-driven surplus rather than a productivity-driven one.
The distinction matters enormously for several reasons:
- A volume-driven surplus signals expanding productive capacity, new market penetration, and improved competitiveness
- A price-driven surplus signals external windfall rather than internal improvement
- Price-driven surpluses are inherently temporary and revert when commodity cycles normalise
- Volume-driven surpluses tend to be stickier, as they reflect capital investment and structural trade relationships
Both TD Economics and RBC emphasised this volume-value divergence in their assessments, noting that crude oil price appreciation and gold price gains were the primary explanatory variables behind the surplus, rather than any meaningful expansion in Canadian manufacturing output or export market share gains. The Canadian Chamber of Commerce similarly characterised the result as price-driven and rooted in geopolitical disruption.
Export Category Performance Breakdown
| Export Category | March 2026 Change | Primary Driver |
|---|---|---|
| Energy Products | +15.6% YoY | Iran war oil price spike |
| Metallic and Non-Metallic Minerals | +24% YoY (record $15.3B) | Gold safe-haven demand |
| Passenger Cars and Light Trucks | +4.5% | Ongoing U.S. auto trade flows |
| Pharmaceutical Products (Imports) | -9.3% | Reduced consumer demand |
| Aircraft and Transport Equipment (Imports) | -12.8% | Tariff-related demand suppression |
How U.S. Tariffs Are Reshaping Canadian Export Geography
The Lowest U.S. Export Share Ever Recorded
Alongside the commodity story, March 2026 revealed another structural shift in Canadian trade that carries significant long-term implications. The United States accounted for just 66.7% of total Canadian exports during the month, representing the lowest proportion ever recorded in available historical data. This figure reflects an ongoing realignment of Canadian export flows away from the country's largest trading partner, driven by an increasingly adversarial tariff environment.
The tariff architecture imposed by the Trump administration on Canadian goods includes:
- 50% tariffs on Canadian steel and aluminium
- 35.2% combined anti-dumping and countervailing duties on softwood lumber
- 25% tariffs on automotive exports
- 50% tariffs on copper and copper products
How trade tariffs are reshaping Canadian commodity exports is increasingly evident in the data. Canada's initial retaliatory response targeted $30 billion worth of U.S. goods with equivalent levies, though many of these measures were wound back in September 2025 following partial U.S. exemptions. Retaliatory tariffs on U.S. steel, aluminium, and automotive products remain active.
Despite this escalating trade friction, Canada's bilateral surplus with the United States widened to $7.1 billion in March, its highest level since September 2025. According to Bloomberg, exports of passenger cars and light trucks to the U.S. rose 8.3% to $48.51 billion, while U.S. imports into Canada contracted 1.2% to $41.44 billion.
This paradox — where a widening bilateral surplus coexists with record-low export share concentration — reflects a phenomenon known in trade economics as supply chain inelasticity. Energy and automotive supply chains cannot be rapidly redirected in response to tariff signals, because the physical infrastructure, refinery configurations, and assembly plant relationships that underpin these flows were built over decades. The tariff regime is clearly influencing the direction of Canadian trade at the margin, however, as evidenced by the growing European destination share for energy exports, but the fundamental U.S. dependency has not yet been structurally unwound.
The next major ASX story will hit our subscribers first
Scenario Analysis: How Long Can the Surplus Hold?
Three Pathways for Canada's Trade Balance in Coming Months
The durability of Canada's trade surplus depends heavily on how several intersecting variables evolve. Based on current market signals as of early May 2026, three distinct scenarios frame the range of plausible outcomes:
Scenario 1: Geopolitical Resolution (Base Case)
Reports have emerged that the United States and Iran are in advanced discussions toward a one-page memorandum to end the conflict and reopen the Strait of Hormuz. Pakistan-mediated talks have reportedly generated productive exchanges, and U.S. officials have expressed confidence that a comprehensive agreement could be reached within days, contingent on Iran suspending its nuclear programme. If a ceasefire materialises:
- Brent crude would likely retreat toward the $85-$95/bbl range as Hormuz supply normalises
- The geopolitical premium in gold would erode further, compressing mineral export revenues
- Canada's trade balance would narrow significantly or revert to deficit within one to two months
Scenario 2: Prolonged Conflict (Upside Risk)
If ceasefire negotiations collapse or the Iran conflict escalates into broader regional involvement:
- Oil prices could retest the $110-$115/bbl range, sustaining elevated energy export revenues
- Canadian energy export concentration in Europe would likely deepen
- Domestic inflation pressures from elevated energy costs would intensify, potentially suppressing import demand further
- The surplus would persist, but as a symptom of economic stress rather than prosperity
Scenario 3: Tariff Escalation
If the United States broadens its tariff coverage to include additional Canadian goods or escalates existing tariff rates:
- Canadian export volumes to the U.S. could decline materially across automotive and manufacturing sectors
- Price-driven commodity revenues would be insufficient to offset volume-driven losses
- The trade balance would deteriorate even under elevated commodity pricing
Canada's Structural Trade Vulnerabilities: The Bigger Picture
Commodity Concentration and the Infrastructure Constraint
The March 2026 Canada trade surplus on high oil, spectacular as it appears in isolation, ultimately serves as a reminder of the structural vulnerabilities embedded in Canada's export base. The country's trade performance remains disproportionately hostage to global commodity price cycles, with oil, gas, gold, and base metals collectively accounting for the overwhelming majority of export value swings in either direction.
The pipeline infrastructure constraint is particularly acute. Canadian Natural Resources has been explicit about the need for new infrastructure to translate elevated prices into sustained volume growth. Without it, periods of high commodity prices deliver windfall revenues but not expanded productive capacity. The Trans-Mountain Expansion and proposed new pipeline corridors represent the critical investment pathway to converting price-driven surpluses into more durable, volume-driven trade strength.
Regionally, the March surplus has not been felt equally across Canada:
- Alberta and Saskatchewan have seen the most direct benefits through elevated royalty streams and producer revenues
- Ontario and Quebec face a more complex picture, where tariff pressures on automotive and manufacturing exports partially offset the commodity windfall
- Households nationwide are absorbing higher energy costs as domestic fuel prices reflect the same global oil price spike that boosted export revenues, creating an inflationary offset to the macroeconomic improvement
The interplay between Canada's commodity export windfall and its household energy cost burden illustrates a rarely discussed dimension of resource-dependent trade structures: the same price mechanism that generates trade surpluses simultaneously erodes real household purchasing power. Consequently, this internal distributional tension will likely shape the political economy of Canada's energy policy debates in the months ahead, regardless of how geopolitical conditions in the Middle East ultimately resolve.
Disclaimer: This article is for informational purposes only and does not constitute financial or investment advice. Trade data, commodity prices, and economic forecasts referenced are based on sources current as of early May 2026 and are subject to revision. Commodity markets are highly volatile, and past trade performance is not indicative of future outcomes.
Want to Catch the Next Major Mineral Discovery Before the Market Does?
While Canada's commodity export surge highlights just how dramatically resource discoveries and price movements can reshape investment landscapes, Discovery Alert's proprietary Discovery IQ model delivers real-time alerts on significant ASX mineral discoveries — turning complex data across 30+ commodities into clear, actionable opportunities. Explore how historic discoveries have generated substantial returns on Discovery Alert's dedicated discoveries page, and begin your 14-day free trial today to position yourself ahead of the broader market.