June 18, 2026
When Long-Life Assets Outperform Fast-Cycle Plays: The Oil Sands Reversal
Conventional energy investment wisdom has long favoured speed over longevity. The ability to drill a well, generate returns within months, and redeploy capital quickly made U.S. shale the darling of institutional energy portfolios through the late 2010s. Canadian oil sands, by contrast, were characterised as slow, expensive, and capital-hungry. That narrative shaped billions of dollars in capital allocation decisions. It also turned out to be wrong.
The story of how Canada's oil sands became the Canadian oil sands lowest-cost producer story in North America is not simply one of cost-cutting. It is a structural tale about what happens when high-decline, reinvestment-intensive assets meet sustained inflation, while low-decline, long-life assets quietly compound their efficiency advantages over a decade.
When big ASX news breaks, our subscribers know first
The Great Capital Migration and Its Strategic Irony
Following the 2014-15 oil price collapse, BP, Chevron, and TotalEnergies each divested their Canadian oil sands positions, classifying these assets as economically unattractive relative to alternatives. The capital raised from those exits was redirected toward U.S. shale, particularly the Permian Basin, which offered lower entry costs and faster cycle times.
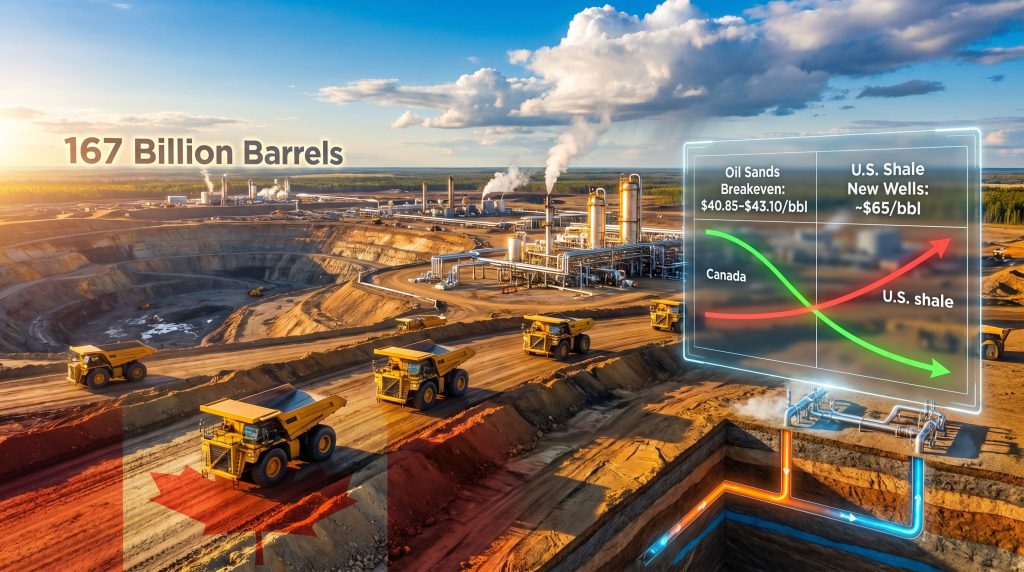
The strategic irony is now impossible to ignore. The assets sold as too expensive have since become structurally cheaper to operate than the assets purchased as the low-cost alternative. According to Bank of Montreal analysis, Canada's five largest oil sands companies can sustain production and maintain dividends at WTI prices between $40.85 and $43.10 per barrel. A Dallas Federal Reserve survey of more than 100 operators in Texas, New Mexico, and Louisiana found that U.S. shale producers now require approximately $65 per barrel WTI on average to profitably drill new wells.
That is not a marginal difference. It represents a cost gap of more than $20 per barrel, and it has inverted completely from where it stood a decade ago. Furthermore, the impact of U.S. tariffs on Canadian industries has added additional pressure on cross-border energy competitiveness, making this cost gap even more strategically significant.
Understanding What Breakeven Actually Means in the Oil Sands Context
Sustaining Costs vs. Half-Cycle Costs: A Critical Distinction
The term "breakeven" is frequently misused in energy analysis, and the distinction between sustaining costs and half-cycle costs matters enormously when comparing oil sands to shale.
-
Sustaining breakeven represents the price required to maintain current production levels, fund ongoing capital expenditure, and cover operating costs without growing the asset base.
-
Half-cycle breakeven refers to the economics of a single new well or facility in isolation, excluding sunk infrastructure costs.
For long-life oil sands assets with decades of remaining productive life, sustaining breakeven is the most relevant metric. The oil sands sector average fell from approximately $51.80 per barrel during 2017-2019 to a range of $40.85 to $43.10 per barrel by 2025-2026, representing roughly $10 per barrel of structural cost reduction across the sector over approximately seven years, according to BMO analysis.
At the individual facility level, the numbers are even more striking. Certain Steam-Assisted Gravity Drainage (SAGD) operations now achieve breakeven costs as low as approximately $8 per barrel on a half-cycle basis, with Suncor Energy identified as the sector's leading cost-efficiency operator. Suncor reduced its overall breakeven cost by approximately US$7 per barrel in a single year during 2024, with its SAGD portfolio averaging in the US$18 to $25 per barrel range. Imperial Oil represents a close competitor in the integrated mining tier, operating in the $20 to $30 per barrel range.
| Metric | 2017-2019 Average | 2025-2026 Range |
|---|---|---|
| Oil Sands Sector Avg. Breakeven | ~$51.80/bbl | $40.85-$43.10/bbl |
| U.S. Shale Avg. Breakeven (new wells) | ~$50-$52/bbl | ~$65/bbl |
| Lowest SAGD Facility Breakeven | N/A | As low as ~$8/bbl |
| Suncor Energy (SAGD avg.) | N/A | ~$18-$25/bbl |
| Industry SAGD Average | N/A | ~$27/bbl |
How Geology and Extraction Method Drive the Cost Divergence
Two Distinct Pathways to Oil Sands Production
Understanding why the oil sands have achieved such low sustaining costs requires a basic grasp of how the resource is actually extracted. Unlike conventional oil or shale, oil sands consist of bitumen, an extremely viscous form of petroleum mixed with sand, clay, and water. Two primary extraction methods are used depending on the depth of the deposit.
Open-pit mining is employed where bitumen-bearing sands lie close to the surface, typically within 75 metres. Enormous truck-and-shovel operations excavate vast quantities of material, which is then processed to separate the bitumen. Startup costs are very high, but once operational, these mines can run for 30 to 50 years or more with extremely low production decline rates. The capital has largely been spent; what remains is the ongoing, optimisable cost of extraction.
SAGD is used for deeper deposits. Two horizontal wells are drilled in parallel, with the upper well injecting steam to heat and mobilise the bitumen, which then drains by gravity to the lower production well. SAGD facilities have lower surface disturbance than open-pit mines, moderate upfront capital requirements, and sustaining costs that are highly sensitive to the steam-to-oil ratio (SOR). Operators that have successfully lowered their SOR have achieved the most dramatic cost reductions in the sector.
| Extraction Method | Capital Intensity | Operating Cost Profile | Asset Life | Decline Rate |
|---|---|---|---|---|
| Open-Pit Mining | Very High (upfront) | Low once operational | 30-50+ years | Very low |
| SAGD (In-Situ) | Moderate | Dependent on steam efficiency | 20-40 years | Low to moderate |
| U.S. Shale (horizontal) | Low (per well) | Requires continuous reinvestment | 3-5 years (primary) | 70-90% in first 3 years |
The Red Queen Syndrome: Shale's Hidden Cost Burden
The production decline dynamic in U.S. shale is one of the most underappreciated structural disadvantages in energy investment analysis. Shale wells typically lose between 70 and 90% of their peak output within the first three years of production. Without continuous new drilling activity, total basin output falls by 20 to 40% annually.
This creates what the industry refers to as the Red Queen Syndrome, borrowing from Lewis Carroll's character who must keep running just to stay in place. Shale operators are not investing to grow production; a substantial portion of each year's drilling budget simply replaces the volume lost from existing wells.
A 2025 IEA report reinforced this concern at a global scale, finding that oil and gas fields worldwide are declining at a faster rate than previously modelled. This accelerating decline trajectory amplifies the long-term value proposition of low-decline assets like oil sands, which do not require the same capital treadmill to maintain output. Canadian energy executives on oil shock scenarios have similarly highlighted this structural resilience as a key differentiator.
Research from Enverus notes that oil sands operators have achieved sustaining breakeven costs that are arguably the lowest in North America, with Trevor Rix, Director of Enverus Research Intelligence, identifying the structural efficiency gains as a defining feature of the modern oil sands landscape.
Technology as the Engine of Cost Reduction
The efficiency gains recorded across the oil sands sector over the past decade are not accidental. They reflect a systematic programme of technology deployment and operational discipline that accelerated after the 2014-15 price collapse forced producers to either reduce costs or exit the business. S&P Global's analysis of oil sands optimisation projects confirms that these improvements are set to continue increasing production even in lower price environments.
Key technology-driven improvements include:
-
Autonomous haul truck fleets operating in open-pit mines, eliminating labour costs associated with shift rotations, fatigue management, and human error while improving cycle times and equipment utilisation rates.
-
Standardised maintenance protocols deployed simultaneously across multiple mine sites, enabling economies of scale in maintenance scheduling, parts inventory management, and contractor management.
-
Robotic inspection and maintenance systems that perform routine tasks in hazardous or difficult-to-access environments previously requiring human crews.
-
Advanced water recycling and steam efficiency systems that reduce the steam-to-oil ratio in SAGD operations, directly lowering the energy cost per barrel of recovered bitumen.
-
AI-assisted predictive maintenance systems that anticipate equipment failure before it occurs, reducing unplanned downtime and extending asset life.
The next generation of cost reduction is already visible on the horizon. Machine learning applications in reservoir modelling, real-time SOR optimisation, and autonomous processing facility management represent technology levers that have not yet been fully deployed across the sector.
The Scale of the Resource Base
Cost efficiency gains are meaningful only when the underlying resource is large enough to sustain production at scale for decades. On this dimension, the Canadian oil sands are in a category of their own within North America.
Canada's oil sands contain approximately 167 billion barrels of proven recoverable oil, representing roughly 97% of Canada's total oil reserves. This places Canada third globally for proven reserves, behind only Venezuela and Saudi Arabia. In addition, the broader Canada energy superpower strategy actively positions this resource scale as a geopolitical and economic asset.
The scale of this reserve base creates a compounding advantage: the fixed costs of technology, infrastructure, and operational learning can be amortised across an enormous and long-lived production base. This dynamic is structurally impossible to replicate in shale, where individual well economics reset with each new drill.
Canadian oil exports have increased by nearly 800,000 barrels per day since 2021, driven substantially by oil sands output growth. This expansion has coincided with a tightening of global heavy crude markets, as production from competing heavy crude suppliers including Mexico and Venezuela has struggled to maintain pace with historical output levels. The U.S. Midwest and Gulf Coast refinery complex is heavily configured for heavy crude processing, creating a natural and durable demand base for Canadian bitumen-derived products.
The next major ASX story will hit our subscribers first
The Pipeline Constraint: The One Obstacle That Remains
Despite the transformation in cost economics, the Canadian oil sands continue to face a structural challenge that has persisted for decades: limited pipeline access to tidewater. The consequence is the Western Canadian Select (WCS) discount to WTI, which at times has exceeded $20 per barrel, effectively reducing the netback received by producers regardless of how efficiently they operate.
Enverus projects that oil sands production growth will fill existing pipeline capacity within approximately seven years, creating urgency around infrastructure decisions that will shape the sector's trajectory well beyond the current decade. This pipeline bottleneck also intersects with Canada's energy transition challenges, as the country navigates competing priorities between resource development and decarbonisation commitments.
Pipeline options currently under discussion or development include:
| Pipeline Project | Operator/Proponent | Status/Notes |
|---|---|---|
| Enbridge Mainline Expansion | Enbridge (TSX: ENB) | Optimisation and capacity expansion options |
| Trans Mountain System | Crown Corporation | Operational; further expansion potential |
| Prairie Connector | South Bow (TSX: SOBO) | Proposed |
| West Coast Oil Pipeline | Alberta Government | Proposed |
The pipeline question intersects directly with Canada's broader energy sovereignty agenda, particularly as trade diversification becomes a geopolitical priority. New tidewater access would allow Canadian crude to compete for Asian markets, potentially narrowing or eliminating the WCS discount permanently.
The Investment Case: Dividends, Stability, and the Volatility Premium
For institutional investors navigating a volatile oil price environment, the dividend sustainability of oil sands producers represents an underappreciated structural advantage. Canada's five largest operators can sustain dividends at WTI prices between $40.85 and $43.10 per barrel, a price floor that is materially below the operational breakeven of most shale-focused peers. Concerns around tariffs on Canadian energy exports have, however, introduced additional considerations for investors assessing long-term revenue certainty.
This creates a scenario worth examining carefully:
-
If WTI trades in the $50-$60 range, oil sands producers remain profitable and dividend-paying while many shale operators struggle to fund new well programmes.
-
If WTI falls to the $40-$45 range, oil sands sustaining production remains economically viable while shale drilling activity collapses, setting up supply tightening that eventually supports price recovery.
-
If WTI trades above $65, both sectors profit, but oil sands producers generate proportionally larger free cash flow margins given their lower cost base.
The asymmetry of this risk profile, combined with the long-life, low-decline nature of oil sands assets, positions the sector as a structurally more predictable investment vehicle than high-decline, capital-intensive shale plays.
Risks That Could Alter the Trajectory
No investment thesis is without risk, and the oil sands are no exception. Key risks warranting consideration include:
-
Carbon cost exposure: Canada's federal carbon pricing mechanism adds a regulatory cost layer absent from U.S. shale jurisdictions. As carbon pricing escalates over time, this differential could partially erode the cost advantage that oil sands operators have worked to build.
-
Energy transition demand risk: Long-term uncertainty around global crude demand, particularly for heavier grades of oil, represents a structural overhang that investors must price into long-duration asset valuations.
-
Labour and input cost inflation: While automation has substantially reduced labour cost exposure, construction and maintenance materials remain subject to inflationary pressure that affects all resource sectors.
-
Pipeline capacity constraints: Without timely infrastructure additions, production growth may be physically capped, limiting the revenue upside that current breakeven economics would otherwise support.
The Canadian oil sands are no longer simply a cost story. In a world where the IEA confirms that global field decline rates are accelerating faster than previously anticipated, the combination of reserve scale, multi-decade asset longevity, and structurally low sustaining costs positions the Canadian oil sands lowest-cost producer model as a resource of growing strategic significance for global energy supply security.
The Reuters analysis of how Canada's oil sands transformed into one of North America's lowest-cost plays provides further context on the structural shifts underpinning this sector's evolution. Consequently, what was once dismissed as a stranded asset class now commands renewed attention from institutional capital seeking long-duration, dividend-sustaining energy exposure.
This article is intended for informational purposes only and does not constitute financial or investment advice. Oil price forecasts, breakeven estimates, and production projections are subject to change and carry inherent uncertainty. Readers should conduct independent research before making investment decisions.
For ongoing coverage of Canadian crude pricing benchmarks, pipeline developments, and North American energy market dynamics, visit oilprice.com.
Want to Identify the Next Major Resource Discovery Before the Broader Market Does?
Discovery Alert's proprietary Discovery IQ model delivers real-time alerts on significant ASX mineral discoveries, transforming complex geological data into actionable investment insights for both short-term traders and long-term investors — explore historic discovery returns to understand the potential scale of opportunity, and begin your 14-day free trial at Discovery Alert to position yourself ahead of the market.