May 22, 2026
Global carbon pricing mechanisms face unprecedented challenges as countries grapple with balancing climate ambitions against economic competitiveness. The carbon border adjustment mechanism represents a departure from traditional multilateral approaches to climate governance, creating new tensions in international commerce and industrial strategy. Furthermore, the emergence of unilateral environmental trade policies creates ripple effects across global supply chains, affecting everything from tariffs impact on investments to broader geopolitical relationships.
Understanding CBAM's Economic Foundation
The carbon border adjustment mechanism addresses the economic distortion created when manufacturers in carbon-regulated jurisdictions compete against producers operating under less stringent environmental frameworks. This mechanism establishes environmental compliance as a prerequisite for market access rather than relying on traditional tariff structures or quota systems.
Carbon Leakage Prevention Strategy:
- Industrial production shifting to regions with weaker climate policies
- Estimated 10-30% emissions offset through relocation effects
- Competitive disadvantage for climate-compliant manufacturers
- Revenue protection for carbon pricing systems
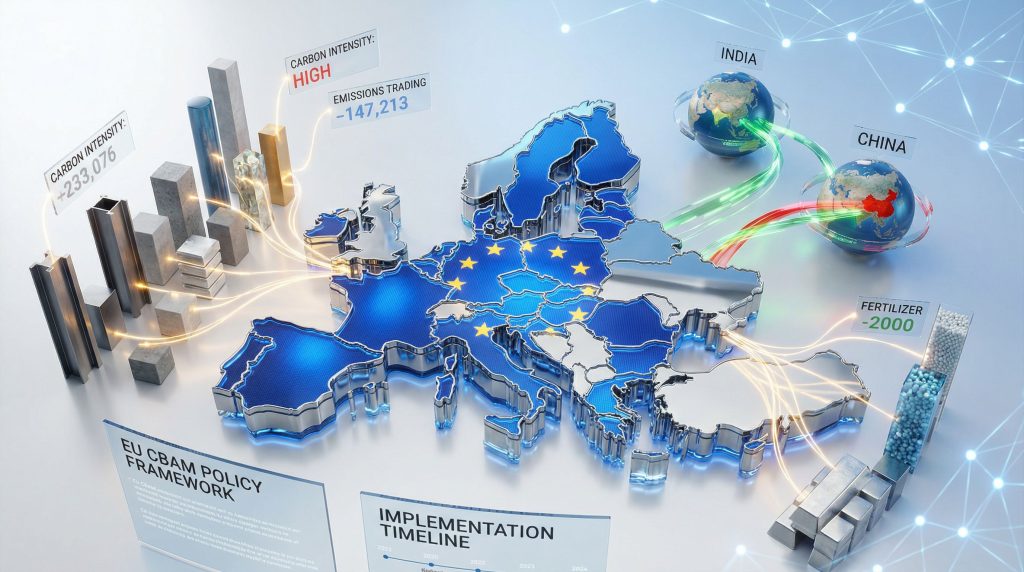
The EU's approach integrates carbon border adjustments with its existing Emissions Trading System, which has operated since 2005 and covers approximately 40% of European greenhouse gas emissions. Consequently, current carbon pricing under the EU ETS ranges between €80-95 per ton of CO2, creating substantial cost pressures for European industrial sectors including steel, cement, and aluminum production.
Historical precedents for environmental trade measures include the Montreal Protocol's trade provisions, which successfully restricted trade in ozone-depleting substances with non-compliant countries. However, the carbon border adjustment mechanism operates at a significantly larger scale, affecting major trade flows in carbon-intensive industrial commodities worth billions of dollars annually.
Implementation Framework:
- Certificate-based system requiring importers to purchase carbon credits
- Equivalency recognition for existing carbon pricing in origin countries
- Default emission values assigned based on production methodologies
- Transitional reporting phase before full financial obligations
When big ASX news breaks, our subscribers know first
Sectoral Impact Analysis Across Carbon-Intensive Industries
The carbon border adjustment mechanism initially targets sectors characterized by high emissions intensity and significant trade exposure. Steel production represents the most substantial impact area, with fundamental differences between European electric arc furnace technology and coal-fired blast furnaces predominant in major exporting countries.
| Sector | EU Emissions Intensity | Global Average | Technology Gap |
|---|---|---|---|
| Steel | 1.5-2.0 kg CO2/unit (EAF) | 2.5-3.0 kg CO2/unit | Electric vs Coal-fired |
| Cement | 0.6-0.8 kg CO2/unit | 0.8-1.0 kg CO2/unit | Process optimization |
| Aluminum | 8-12 kg CO2/unit | 12-16 kg CO2/unit | Electricity intensity |
| Fertilizers | 0.5-0.8 kg CO2/unit | 1.2-2.1 kg CO2/unit | Natural gas efficiency |
Steel Industry Transformation Requirements
Indian steel producers face conversion costs of $30-50 million per facility to transition from coal-fired blast furnaces to electric arc furnaces, with implementation periods extending 18-24 months. This technological shift requires not only capital investment but also access to low-carbon electricity supply, creating dependencies on broader grid decarbonization efforts similar to Canada's energy transition challenges.
The competitive dynamics shift dramatically under carbon border adjustments. For instance, European steel production costs incorporating ETS obligations range €65-85 per ton, while Indian blast furnace production operates at €45-55 per ton before carbon cost adjustments. The mechanism aims to eliminate this cost differential by imposing equivalent carbon pricing on imports.
Production Technology Comparison:
- Blast Furnace Route: Uses iron ore reduced with coke, generating 2.5-3.0 tons CO2 per ton of steel
- Electric Arc Furnace Route: Uses scrap steel melted electrically, producing 0.5-1.5 tons CO2 per ton depending on grid carbon intensity
- Capital Investment: EAF conversion requires substantial upfront costs but offers operational emission advantages
- Operational Flexibility: Electric systems provide greater responsiveness to demand fluctuations
Geographic Winners and Losers Under Carbon Border Adjustments
Export dependency patterns reveal significant vulnerabilities for major commodity exporters to European markets. India's steel industry faces particular exposure, with 40-67% of steel exports directed to EU markets, representing €3-4 billion in annual trade value from total exports of 13-15 million tonnes. Moreover, these disruptions contribute to broader US–China trade war effects across global commodity markets.
Market Diversification Challenges
Export redirection faces substantial obstacles beyond simple geographic substitution. Alternative markets typically offer:
- Lower price premiums (€400-500/ton vs EU €600-700/ton for equivalent quality)
- Different technical specifications reducing direct substitution feasibility
- Smaller absorption capacity relative to European demand
- Higher logistics costs for accessing distant markets
Countries with established low-carbon electricity infrastructure gain competitive advantages under carbon border adjustments. Canada, Norway, and Brazil benefit from hydroelectric capacity, while France leverages nuclear power generation to reduce production emissions across industrial sectors. These advantages align with broader energy transition challenges facing nations globally.
Market Absorption Constraints: Southeast Asian infrastructure demand growth of 6-7% annually cannot immediately absorb the volume of steel exports previously directed to Europe, creating supply chain disruption periods extending multiple years.
Alternative Market Development Strategies:
- Domestic Market Expansion: India's infrastructure investment targets of $1.4 trillion (2024-2030) provide partial absorption capacity
- Regional Market Penetration: Southeast Asia (Vietnam, Thailand, Indonesia) offers growing construction demand
- African Market Development: Nigeria, Kenya, Tanzania represent emerging infrastructure buildout opportunities
- Middle Eastern Construction: UAE, Saudi Arabia, Qatar maintain substantial project pipelines
However, these alternative markets present different competitive dynamics. Chinese steel exports of approximately 70 million tonnes annually create pricing pressure in non-EU markets, while quality specifications often differ from European standards, requiring product adaptation investments.
Technical Measurement Complexities and Implementation Challenges
Carbon border adjustment implementation faces significant technical obstacles in accurately measuring and verifying emissions across diverse production systems. Default emission values assigned to exporting countries have generated controversy, with industry executives reporting inconsistencies that could undermine the mechanism's effectiveness.
Emission Measurement Inconsistencies
According to industry analysis, default emission values for certain countries' steel production were calculated at levels lower than verified EU production emissions. This creates the paradoxical situation where high-emission imports could enter EU markets with insufficient carbon cost obligations, defeating the mechanism's competitive leveling objective.
Verification and Monitoring Framework:
- Importers must provide detailed emissions data or rely on default values
- Third-party verification required for claimed emission reductions
- Monitoring, Reporting, and Verification (MRV) standards must align with EU protocols
- Administrative burden estimated at €500-1,500 per shipment for compliance documentation
The complexity of measuring Scope 1, 2, and 3 emissions across international supply chains creates opportunities for circumvention through trans-shipment, product re-labeling, and jurisdictional arbitrage. Furthermore, countries with limited monitoring capacity may struggle to provide credible emissions data, defaulting to potentially inaccurate standardised values.
Technical Implementation Gaps:
- Data Quality: Inconsistent emissions monitoring capabilities across exporting countries
- Verification Costs: Third-party auditing expenses may exceed carbon cost obligations for smaller exporters
- System Integration: Limited interoperability between national carbon accounting systems
- Enforcement Mechanisms: Unclear penalties for misreporting or circumvention attempts
International Policy Convergence and Retaliatory Measures
The unilateral implementation of carbon border adjustments risks triggering retaliatory trade measures from affected exporting countries. Major economies including China, India, and Saudi Arabia have criticised the mechanism as protectionist, potentially leading to dispute resolution proceedings under World Trade Organization frameworks.
WTO Compatibility Challenges
CBAM's classification as an environmental measure rather than trade protection requires demonstration that the mechanism serves legitimate environmental objectives without creating unnecessary barriers to international commerce. Legal challenges may focus on:
- Discriminatory treatment between domestic and foreign producers
- Technical barriers to trade through complex verification requirements
- Violation of most-favoured-nation principles in default value assignments
Emerging Carbon Pricing Convergence
Similar mechanisms under development in other jurisdictions suggest potential for global carbon pricing harmonisation:
| Country/Region | Implementation Timeline | Sector Coverage | Design Features |
|---|---|---|---|
| United Kingdom | 2027 (pilot phase) | Steel, Cement | Border carbon adjustments |
| Canada | 2026-2028 (evaluation) | Industrial sectors | Output-based pricing |
| Japan | 2025-2030 (voluntary) | Manufacturing | Technology standards |
| United States | Under consideration | Multiple sectors | Climate club approach |
Retaliatory Response Patterns:
Export-dependent countries may implement counter-measures including:
- Tariffs on EU manufactured goods and services
- Preferential trade arrangements excluding carbon-pricing jurisdictions
- Alternative trading bloc formation with shared environmental standards
- Legal challenges through international dispute resolution mechanisms
Investment Flow Implications: Capital allocation toward clean production technologies in developing nations may accelerate under carbon border adjustment pressure, creating new opportunities for technology transfer and green financing mechanisms.
The next major ASX story will hit our subscribers first
Long-term Structural Changes in Global Supply Chains
Carbon border adjustments catalyse fundamental reorganisation of international production networks, accelerating regionalisation trends driven by environmental compliance costs rather than traditional factors such as labour costs or resource availability. This transformation connects directly to broader mining industry evolution patterns emerging across commodity sectors.
Supply Chain Adaptation Strategies
- Near-shoring to Low-Carbon Regions: Production relocation to jurisdictions with clean electricity grids
- Technology Upgrade Investment: Capital deployment for emission reduction equipment and processes
- Vertical Integration: Direct control over supply chain emissions through ownership consolidation
- Carbon Credit Integration: Offset mechanisms to achieve compliance while maintaining existing production methods
The mechanism's expansion beyond initial sectors (steel, cement, aluminum, fertilizers, electricity) to potentially include chemicals, polymers, and manufactured goods would affect supply chains worth trillions of dollars in annual trade flows.
Regional Competitiveness Shifts
Countries with abundant renewable energy resources gain structural advantages in carbon-intensive manufacturing. Norway's hydroelectric capacity, Canada's hydroelectric and nuclear resources, and Brazil's renewable energy infrastructure position these economies as attractive production locations for European market access.
Investment Pattern Evolution:
- Clean Technology Capital Flows: Estimated $200-400 billion in additional investment requirements for compliance across major exporting countries
- Stranded Asset Risks: Existing coal-fired industrial capacity faces accelerated depreciation under carbon pricing pressure
- Green Bond Financing: Debt instruments for carbon reduction projects experience increased demand from export-oriented industries
Future Policy Evolution:
The carbon border adjustment mechanism represents the initial phase of potential environmental trade policy integration. Expansion scenarios include:
- Coverage extension to additional sectors and products
- Integration with international aviation and shipping emissions
- Linkage with biodiversity and circular economy requirements
- Coordination with climate finance mechanisms for developing countries
The effectiveness of CBAM in achieving both climate objectives and competitive balance depends critically on technical implementation quality, international coordination, and adaptive management as global production systems respond to new carbon pricing realities. In addition, success requires careful navigation of the complex interplay between environmental goals and international trade law.
Disclaimer: This analysis examines complex policy developments involving international trade and environmental regulation. Implementation details and economic impacts may vary significantly as policies evolve and markets adapt to new regulatory frameworks.
Looking to Capitalise on Climate Policy Market Shifts?
Discovery Alert's proprietary Discovery IQ model delivers real-time alerts on significant mineral discoveries across carbon transition commodities, instantly empowering subscribers to identify actionable opportunities ahead of broader market movements. Begin your 30-day free trial today and explore Discovery Alert's dedicated discoveries page to understand how major mineral discoveries can lead to substantial market returns.