August 14, 2026
The Chemistry Shift Rewriting China's Energy Future
The global transition to electric mobility is often framed through the lens of vehicle sales, charging infrastructure, or the battery raw materials market. Yet the most consequential battleground sits one layer deeper: the monthly installation data that reveals which battery manufacturers are actually winning the race to power the world's largest EV market. In China, that race has a structural shape that monthly numbers alone cannot fully capture, and understanding CATL and BYD battery market share in China requires examining not just who leads, but why the gap between leaders is moving the way it is.
When big ASX news breaks, our subscribers know first
China's Power Battery Market: The July 2026 Snapshot
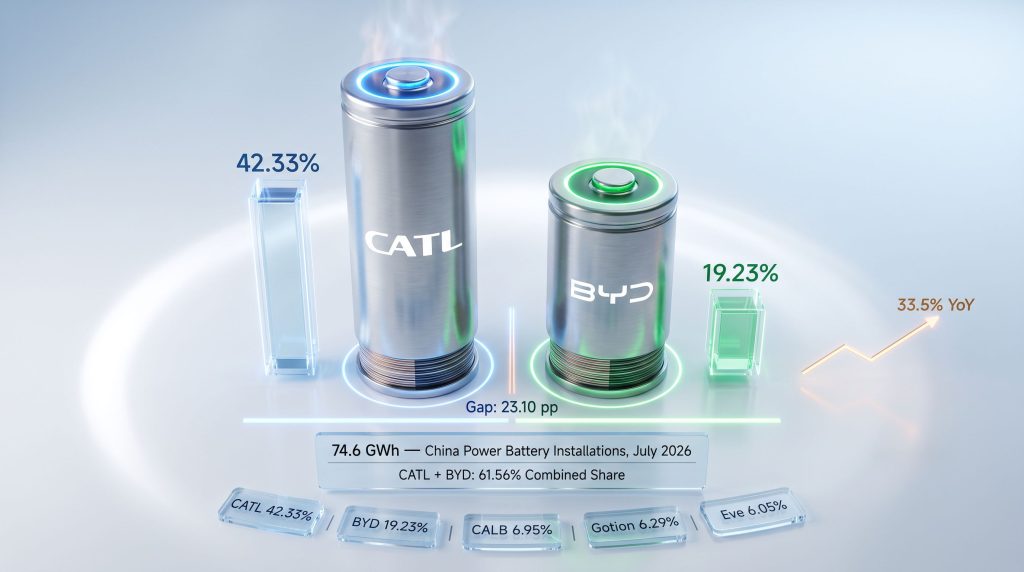
China's domestic power battery installations reached 74.6 GWh in July 2026, reflecting a 33.5% year-on-year expansion that represents the fastest growth pace recorded so far this year, according to data published by the China Automotive Battery Innovation Alliance (CABIA). That figure is striking on its own, but the month-on-month picture tells a more nuanced story.
Total installations contracted 2.5% from June's level, ending four consecutive months of sequential growth. This divergence between surging annual momentum and near-term softness is not a contradiction. It reflects the layered complexity of China's EV supply chain, where seasonal procurement cycles, automaker inventory adjustments, and model launch timing routinely interrupt short-term growth trends even as the structural trajectory remains firmly upward.
Market Context: The simultaneous occurrence of record-breaking year-on-year growth and a sequential monthly decline illustrates why single-month battery installation data should always be interpreted against a multi-period baseline rather than in isolation.
Full Competitive Landscape: Top 15 Battery Makers in China (July 2026)
July 2026 Market Share Rankings
| Rank | Company | Installations (GWh) | Market Share (%) | MoM Change (pp) |
|---|---|---|---|---|
| 1 | CATL | 31.40 | 42.33% | −0.37 |
| 2 | BYD | 14.26 | 19.23% | +0.74 |
| 3 | CALB | 5.16 | 6.95% | +0.14 |
| 4 | Gotion High-tech | 4.66 | 6.29% | −0.21 |
| 5 | Eve Energy | 4.49 | 6.05% | +0.22 |
| 6 | Rept Battero Energy | 2.90 | 3.92% | +0.37 |
| 7 | Sunwoda | 2.66 | 3.59% | +0.80 |
| 8 | Zenergy | 1.81 | 2.43% | −0.28 |
| 9 | Energee | 1.65 | 2.23% | −0.20 |
| 10 | Svolt Energy | 1.36 | 1.83% | −0.18 |
| 11 | LG Energy Solution | 0.73 | 0.98% | −0.93 |
| 12 | Yinpai Battery | 0.72 | 0.97% | −0.25 |
| 13 | Cornex | 0.66 | 0.89% | −0.18 |
| 14 | Greater Bay Technology | 0.46 | 0.62% | +0.37 |
| 15 | CNET | 0.27 | 0.36% | +0.04 |
Source: China Automotive Battery Innovation Alliance (CABIA), August 2026
The top five manufacturers collectively controlled 80.85% of total installations in July, rising from 80.34% in June. This upward creep in tier-one concentration puts significant structural pressure on mid-tier players competing for the remaining one-fifth of the market. Furthermore, Sunwoda recorded the largest month-on-month share gain of any company in the top 15, adding 0.80 percentage points to reach 3.59%, a signal worth watching for investors tracking the battery metals investment landscape and the challenger tier more broadly.
CATL's Market Position: Dominant, But the Trajectory Deserves Scrutiny
A 30-Month View of CATL's Share Evolution
| Period | Installations (GWh) | Market Share (%) |
|---|---|---|
| Jan 2024 | 15.96 | 49.41% |
| Jul 2024 | 19.42 | 47.30% |
| Dec 2024 | 34.29 | 45.48% |
| Jan 2025 | 18.25 | 47.08% |
| Jun 2025 | 25.41 | 43.67% |
| Dec 2025 | 45.71 | 46.66% |
| Jan 2026 | 20.91 | 49.79% |
| Jun 2026 | 32.59 | 42.70% |
| Jul 2026 | 31.40 | 42.33% |
Source: CABIA
CATL's 31.40 GWh of domestic power battery installations in July 2026 secured its position as China's largest battery supplier by a wide margin, but the share figure of 42.33% continues a pattern of gradual compression from the company's peak of 49.41% recorded in January 2024. That represents a contraction of more than 7 percentage points over roughly 30 months.
One critical nuance for interpreting this trajectory is the pronounced seasonality in CATL's monthly volumes. January figures consistently reset lower across all years in the dataset, reflecting post-holiday production slowdowns and the front-loading of automaker procurement in the prior December. This pattern creates optical share spikes at the start of each year that partially unwind as competitors ramp up production through the first quarter.
CATL's Ternary Battery Dominance: A Counterintuitive Insight
CATL's performance in the ternary battery sub-segment in July 2026 reveals a dynamic that is frequently misunderstood by casual observers. Its ternary installations fell approximately 8.2% month-on-month to 8.43 GWh, yet its share of the ternary segment rose by 3.25 percentage points to 75.81%. The reason is straightforward but significant: the total ternary battery market contracted even faster, falling 12.6% from June as the broader industry accelerated its transition toward lithium iron phosphate chemistry.
Structural Insight: When an entire technology category is in secular decline, even a company losing volume in absolute terms can paradoxically increase its relative share. CATL's near-total dominance of the ternary sub-market at 75.81% may therefore reflect competitive strength, concentration risk, or both simultaneously, depending on how quickly ternary chemistry continues to lose relevance.
In the LFP segment, CATL held 36.43% of the market with 22.97 GWh of installations, a slight softening of 0.34 percentage points from June. This remains a commanding position, but it is one where BYD is actively and consistently closing the gap.
BYD's Battery Strategy: Vertical Integration as a Structural Moat
BYD's Two-Year Market Share Trajectory
| Period | Installations (GWh) | Market Share (%) |
|---|---|---|
| Jan 2024 | 6.00 | 18.58% |
| Mar 2024 | 9.28 | 26.79% |
| Dec 2024 | 17.49 | 23.19% |
| Jan 2025 | 8.88 | 22.90% |
| Dec 2025 | 17.63 | 17.99% |
| Feb 2026 | 3.56 | 13.56% |
| Jun 2026 | 14.11 | 18.49% |
| Jul 2026 | 14.26 | 19.23% |
Source: CABIA
BYD's July result of 14.26 GWh and a 19.23% market share extending its recovery from a multi-year low of 13.56% in February 2026. That February trough was driven by the structural mechanics of Chinese New Year, which compresses production across the supply chain and disproportionately affects BYD given its tightly integrated manufacturing model. The recovery from 13.56% to 19.23% over five months is a meaningful swing that partially explains why the gap with CATL is once again narrowing.
BYD's battery business operates under a unique strategic architecture. Unlike CATL, which supplies batteries to a wide range of third-party automakers including international brands, BYD's battery production remains overwhelmingly oriented towards its own vehicle lineup. This vertical integration model provides cost advantages and supply chain certainty, but it also means BYD's battery market share is inherently tied to the performance of its own vehicle sales rather than the broader health of the EV market.
Every single one of BYD's battery installations in China uses LFP chemistry. This is not a recent pivot. It is a long-standing strategic commitment that has now become a major competitive advantage as LFP achieves record market dominance. In the LFP sub-market specifically, BYD holds a 22.62% share, with the gap between BYD and CATL in LFP narrowing to 13.81 percentage points from 14.61 percentage points in June. Consequently, the global lithium market is watching this LFP expansion closely, as it has direct implications for lithium demand forecasts.
The CATL vs. BYD Gap: Reading the Competitive Compression
How the Share Gap Has Shifted Over Time
| Period | CATL Share | BYD Share | Gap (pp) |
|---|---|---|---|
| 2024 Full Year | 45.2% | 25.1% | 20.1 |
| 2025 Full Year | 43.42% | 21.58% | 21.84 |
| Jan 2026 | 49.79% | 17.43% | 32.36 |
| Feb 2026 | 49.10% | 13.56% | 35.54 |
| Jun 2026 | 42.70% | 18.49% | 24.21 |
| Jul 2026 | 42.33% | 19.23% | 23.10 |
Source: CABIA; Additional Research
The gap between CATL and BYD in terms of overall CATL and BYD battery market share in China reached an extraordinary 35.54 percentage points in February 2026 before beginning a rapid compression that has continued through July. The July figure of 23.10 percentage points represents a contraction of more than 12 points in just five months.
However, context is essential here. The February gap was exaggerated by Chinese New Year seasonality that hit BYD harder than CATL, and the subsequent recovery partly reflects a normalisation of that distortion rather than a genuine structural erosion of CATL's competitive position. Whether the current compression trajectory extends into the second half of 2026 will depend significantly on BYD's progress in expanding external battery sales to third-party automakers, a strategic initiative the company has been pursuing with increasing seriousness.
Concentration Alert: CATL and BYD together controlled 61.56% of China's power battery market in July 2026, up slightly from 61.19% in June. On a full-year basis, their combined share reached approximately 70.3% in 2024 and 65.0% in 2025. This level of two-firm market concentration has material implications for component suppliers, downstream automakers negotiating battery supply agreements, and any new entrant attempting to achieve meaningful scale.
The next major ASX story will hit our subscribers first
The Chemistry War: LFP's Record Dominance and What It Means
LFP vs. Ternary Sub-Market Breakdown (July 2026)
LFP Top Suppliers:
| Company | LFP Installations (GWh) | LFP Market Share (%) | MoM Change (pp) |
|---|---|---|---|
| CATL | 22.97 | 36.43% | −0.34 |
| BYD | 14.26 | 22.62% | +0.46 |
| CALB | 4.71 | 7.47% | 0.00 |
| Gotion High-tech | 4.63 | 7.35% | −0.40 |
| Eve Energy | 4.48 | 7.10% | +0.11 |
Ternary Top Suppliers:
| Company | Ternary Installations (GWh) | Ternary Market Share (%) | MoM Change (pp) |
|---|---|---|---|
| CATL | 8.43 | 75.81% | +3.25 |
| Svolt Energy | 0.78 | 7.04% | −1.23 |
| LG Energy Solution | 0.73 | 6.55% | −4.98 |
| Sunwoda | 0.56 | 5.01% | +1.70 |
| CALB | 0.45 | 4.02% | +0.47 |
Source: CABIA
LFP batteries accounted for a record 84.6% of China's total power battery installations in July 2026, a second consecutive month in which this technology's share set a new all-time high. Ternary batteries fell to a record low of 14.9% of the total market.
The forces behind this shift are both technical and economic. LFP chemistry offers superior thermal stability, longer cycle life, and lower manufacturing cost compared to nickel-manganese-cobalt (NMC) ternary formulations. As battery manufacturers have refined LFP energy density to levels that satisfy the range requirements of mainstream EV buyers, the traditional performance premium of ternary chemistry has narrowed considerably. In addition, the lithium boom and battery storage trend has amplified demand for LFP specifically, given its superior suitability for stationary storage applications. Coupled with persistent volatility in cobalt and nickel pricing, which are key inputs for ternary batteries, the economic case for LFP has strengthened significantly.
LG Energy Solution's experience in July illustrates the structural risk facing ternary-focused suppliers acutely. The Korean manufacturer's ternary share collapsed by 4.98 percentage points as its installations halved from 1.46 GWh in June to 0.73 GWh in July, the largest single-month share decline in the ternary sub-market. All of LG Energy Solution's China installations remain in the ternary category, giving it zero exposure to the chemistry segment recording record growth.
Three Structural Forces Shaping Market Outcomes in 2026
Understanding monthly share movements requires appreciating the deeper forces operating beneath them:
-
EV sales seasonality creates predictable volatility that disproportionately affects smaller manufacturers with less diversified customer bases. Companies supplying a single major automaker are far more exposed to that automaker's monthly production rhythm than diversified suppliers like CATL.
-
LFP technology standardisation is progressively reducing the points of differentiation between battery suppliers at the chemistry level. As LFP becomes the dominant standard, competitive advantage increasingly shifts towards manufacturing scale, cost efficiency, and supply chain integration rather than chemistry innovation. This dynamic may ultimately benefit CATL and BYD most, given their scale advantages.
-
Automaker vertical integration trends are pulling battery demand in competing directions simultaneously. BYD's captive model demonstrates the viability of full integration, while CATL's third-party supply model demonstrates the scalability of an independent supplier approach. As more automakers consider partial or full vertical integration, the competitive dynamics of the battery market will become progressively more complex.
Forward-Looking Scenarios: What Could Shift the Balance?
Several plausible scenarios could meaningfully alter the CATL and BYD battery market share in China dynamic through the remainder of 2026 and into 2027:
-
Scenario 1: BYD accelerates external battery sales. If BYD successfully expands its battery supply to third-party automakers beyond its current captive base, its absolute installation volumes could grow substantially without requiring additional vehicle sales growth. This would compress the gap with CATL from the volume side rather than the share side.
-
Scenario 2: Mid-tier consolidation around chemistry niches. Suppliers like Sunwoda, Rept Battero Energy, and Greater Bay Technology are each posting above-average share gains. If these companies consolidate around specific chemistry or application niches, such as commercial vehicles or two-wheelers, they could build defensible positions even within a highly concentrated overall market.
-
Scenario 3: Solid-state battery deployment reshuffles rankings. Longer-term, the commercial deployment of solid-state battery technology represents the most significant potential disruptor to current market structure. The Chinese battery recycling breakthrough narrative further underscores how rapidly China's battery ecosystem is evolving. CATL has been investing heavily in solid-state research, and meaningful commercial deployment would likely extend rather than challenge its leadership. However, the timeline for mass-market solid-state adoption remains uncertain, with most credible industry assessments placing volume production beyond 2027.
-
Scenario 4: CATL defends share through next-generation cell technology. CATL's Shenxing and Kirin battery platforms represent its primary technology differentiation tools. If next-generation variants of these platforms achieve substantially higher energy density or faster charging at competitive cost, CATL could rebuild share from current levels. According to data tracking global EV battery market trends, Chinese manufacturers as a group continue to extend their lead over international rivals in both volume and technology development pace.
Disclaimer: The forward-looking scenarios presented above involve significant assumptions and uncertainties. They should not be construed as investment advice or financial forecasts. Battery market dynamics can shift rapidly in response to technology changes, regulatory developments, and macroeconomic conditions.
Key Takeaways: CATL and BYD Battery Market Share in China (July 2026)
-
CATL maintained its position as China's largest power battery supplier with a 42.33% share and 31.40 GWh of installations in July 2026
-
BYD ranked second at 19.23% and 14.26 GWh, gaining 0.74 percentage points month-on-month while the broader market contracted
-
The CATL-BYD share gap narrowed to 23.10 percentage points, contracting for a second consecutive month from a peak of 35.54 points in February 2026
-
Together, CATL and BYD controlled 61.56% of China's total power battery market, with full-year combined concentration reaching approximately 70.3% in 2024 and 65.0% in 2025
-
LFP batteries reached a record 84.6% of total installations in July; ternary batteries fell to an all-time low of 14.9%
-
CATL held 75.81% of the ternary sub-market despite absolute volume declines, driven by faster contraction in overall ternary demand
-
LG Energy Solution recorded the largest single-month share decline in the ternary sub-market, losing 4.98 percentage points as its installations halved
-
Sunwoda posted the largest month-on-month share gain across all top-15 companies, adding 0.80 percentage points to reach 3.59%
-
The top five manufacturers collectively held 80.85% of the overall market, a slight increase from 80.34% in June
Monthly battery installation data referenced throughout this article is sourced from the China Automotive Battery Innovation Alliance (CABIA) as reported by CnEVPost, which publishes regular coverage of China's EV and battery sector.
Want to Know Which ASX Discoveries Could Benefit From the Battery Metals Boom?
Discovery Alert's proprietary Discovery IQ model delivers real-time alerts the moment significant mineral discoveries — including battery metals like lithium — are announced on the ASX, transforming complex geological data into actionable investment insights. Explore why major mineral discoveries have historically generated substantial returns on Discovery Alert's dedicated discoveries page, and begin your 14-day free trial today to position yourself ahead of the market.