June 25, 2026
Carbon Costs Are No Longer a Footnote in Automotive Finance
The economics of vehicle manufacturing have shifted in ways that even seasoned procurement directors are still absorbing. For decades, steel and aluminium were priced as commodities with relatively predictable cost trajectories. Carbon, if it appeared at all in internal models, was treated as a compliance line item managed by sustainability teams operating at arm's length from the commercial core of the business.
That separation no longer holds. The convergence of the EU Emissions Trading System and the Carbon Border Adjustment Mechanism has embedded carbon costs directly into the bill of materials for every European original equipment manufacturer sourcing metals from outside the EU. The transition is not gradual or theoretical. It is structural, measurable, and already reshaping how leading OEMs govern procurement costs in 2026.
Understanding how CBAM and EU ETS pricing benchmarks for European automotive OEMs interact is not simply a regulatory exercise. It is one of the most consequential margin management challenges the industry faces this decade.
When big ASX news breaks, our subscribers know first
What CBAM and EU ETS Actually Mean for Automotive Input Costs
Two Mechanisms, One Commercial Reality
The EU ETS is a cap-and-trade framework that places a direct price on carbon emissions produced by covered industrial installations within the European Union. Operators receive or purchase European Union Allowances, with each EUA representing one tonne of CO2. The system has been operational for over two decades, but its commercial bite for downstream buyers has historically been softened by the distribution of free allowances.
CBAM operates as a complementary border adjustment. Importers of covered goods sourced from countries without equivalent carbon pricing are required to purchase CBAM certificates priced against EU ETS auction levels. The mechanism prevents carbon leakage — the scenario in which European producers are undercut by overseas competitors who face no equivalent emissions cost. For a detailed overview of how the EU's CBAM framework operates at a regulatory level, the European Commission's dedicated guidance offers a useful reference.
Critically, CBAM does not apply to finished vehicles. It targets upstream materials: steel, aluminium, cement, fertilisers, electricity, and hydrogen. For automotive OEMs, this means the carbon cost exposure lands at the materials procurement level rather than at the point of vehicle sale. The commercial consequence is identical either way: margins are compressed.
The Phase Timeline Every Procurement Team Must Understand
The CBAM transitional period ran from October 2023 through December 2025, requiring importers to report embedded emissions without financial liability. The definitive phase commenced in 2026, introducing mandatory certificate purchase obligations for all covered imports.
The certificate pricing architecture is specific and consequential:
- 2026: CBAM certificates are priced as a quarterly average of EU ETS auction results
- 2027 onward: Pricing shifts to a weekly average, increasing the frequency of cost adjustment and aligning CBAM more closely with live carbon market movements
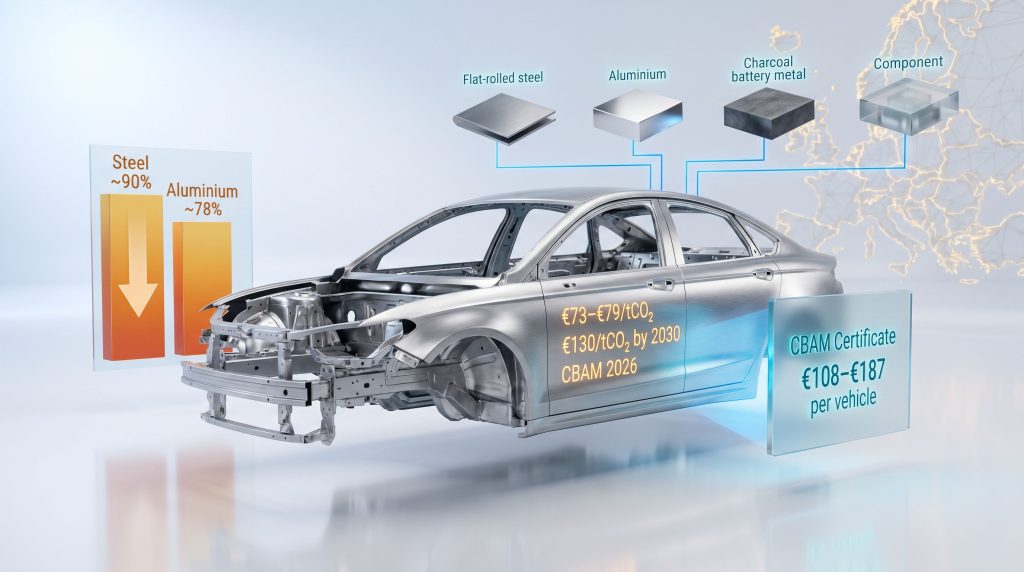
Current EU ETS prices have been trading in the €73 to €79 per tonne CO2 range in the 2025 to 2026 reference periods. Projections widely cited across carbon market analysis suggest EUA prices could approach €130 per tonne by 2030, potentially adding 7 to 17% to metal input costs for European vehicle producers as free allowances are progressively withdrawn.
Free allowance levels currently stand at approximately 90% for steel and 78% for aluminium, meaning a significant portion of the effective carbon cost is still muted. That buffer narrows materially through the late 2020s and disappears entirely by 2034, when the full phase-out is scheduled to complete.
| Input Material | CBAM Coverage | Current Free Allowance | Projected Cost Pressure by 2030 |
|---|---|---|---|
| Flat-rolled steel | Covered | ~90% | High |
| Aluminium (primary) | Covered | ~78% | High |
| Battery metals (upstream) | Partial / evolving | Varies | Medium-high |
| Tier-1 fabricated components | Indirect exposure | N/A | Medium |
The Verification Gap: Where Margin Leakage Begins
Why Default Values Are a Hidden Cost Trap
One of the least-discussed but most commercially significant aspects of CBAM implementation is the treatment of unverified emissions data. Where a supplier cannot provide validated figures for the embedded carbon intensity of their product, CBAM regulations automatically apply default emissions values. These defaults are deliberately conservative, set to reflect worst-case emissions intensity assumptions for the relevant production process.
The financial penalty for relying on default values is substantial. Analysis from Fastmarkets senior economist Ben Crick indicates that CBAM's impact on metals input prices could be 23% greater in 2026 if imports rely on default emissions values rather than verified data. That penalty compounds over time, rising to an estimated 33% by 2027 as the verification gap widens and default assumptions become more punitive relative to the actual emissions profile of modern production facilities.
This dynamic creates a new category of procurement risk that did not exist under traditional sourcing models. OEMs are now exposed not only to their own carbon performance, but to the data quality, verification infrastructure, and reporting capability of every upstream supplier in their materials chain.
The Three Categories of Carbon Cost Pass-Through Risk
When a steel or aluminium supplier presents a CBAM-adjusted invoice, that carbon component can fall into one of three distinct categories:
- Legitimate verified costs representing genuine CBAM and EU ETS exposure, properly calculated from supplier-verified emissions intensity data
- Inflated or double-counted costs where suppliers apply carbon charges without transparent methodology, using default values or commercially self-serving assumptions
- Scarcity-driven green premiums where constrained supply of certified low-carbon material allows suppliers to command above-cost pricing independent of actual regulatory exposure
Without an independent reference point, OEM procurement teams have no reliable mechanism to distinguish between these categories. This is the foundational problem that independent pricing benchmarks are designed to solve.
Why Legacy Procurement Architecture Is Failing Under Carbon Pressure
The Structural Mismatch Between Fixed Contracts and Volatile Carbon Costs
Traditional automotive procurement was engineered for a different cost environment. Annual price resets, bilateral fixed contracts, and long-cycle negotiations were appropriate tools when input costs were stable and price movements were driven primarily by supply and demand fundamentals in commodity markets.
Carbon costs do not behave like commodity costs. They are policy-driven, politically sensitive, asymmetrically applied across geographies, and subject to regulatory revision. They can move sharply in response to energy market shocks, EUA auction outcomes, or shifts in EU climate legislation — none of which correspond to the annual renegotiation cycle that governs most automotive supplier agreements.
The result is a structural mismatch. OEM finance teams are building vehicle cost models using annual carbon price assumptions that may be outdated within quarters. Procurement teams are negotiating with suppliers who have every commercial incentive to embed carbon charges at the highest defensible level, knowing that buyers lack the independent data to challenge them.
Internal vehicle cost models are losing authority. Without external reference points, OEM finance and procurement teams are forced to arbitrate between competing supplier claims with limited independent validation. This is where benchmark intelligence becomes a strategic asset rather than a discretionary tool.
How Independent Benchmarks Restore Pricing Credibility
Six Operational Applications for Automotive OEMs
Independent market benchmarks serve as neutral, third-party reference points that are not subject to the commercial interests of either buyer or seller. Their application in carbon-affected procurement spans six distinct use cases:
- Should-cost model construction: Building carbon-inclusive cost models at vehicle and component level, integrating CBAM and EU ETS assumptions directly into bill-of-materials calculations with market-linked price inputs
- Supplier invoice validation: Cross-referencing CBAM-adjusted import prices against verified benchmark data to identify inflated or misapplied carbon charges before they are absorbed into production costs
- EU ETS pass-through assessment: Evaluating whether domestic supplier ETS cost claims align with prevailing allowance market prices rather than commercially optimised estimates
- Volatility anchoring: Embedding transparent, neutral reference points into escalation and indexation contract clauses so that carbon price movements are reflected accurately rather than opportunistically
- RFQ precision: Issuing requests for quotation with carbon cost parameters pre-defined, reducing negotiation ambiguity, accelerating sourcing cycles, and supporting QCDP objectives
- Cross-border sourcing comparison: Comparing EU-produced and imported components on a carbon-inclusive landed-cost basis to test whether reshoring genuinely protects margins or simply introduces different cost risks
Aligning Procurement, Finance, and Sustainability Around a Shared Language
One underappreciated consequence of the CBAM and EU ETS regime is the internal misalignment it creates within OEM organisations. Procurement teams negotiate prices. Finance teams model costs. Sustainability teams track emissions. Under pre-CBAM conditions, these functions could operate with significant independence because carbon did not appear as a shared financial variable.
Independent benchmarks change that dynamic. By translating carbon intensity into price signals, benchmarks give procurement, finance, and sustainability teams a common reference framework for decision-making. Furthermore, this shared language directly supports broader efforts in European steel decarbonisation, where consistent carbon pricing transparency is increasingly essential across the value chain.
| Business Function | Challenge Without Benchmarks | Capability With Benchmarks |
|---|---|---|
| Procurement | Supplier carbon claims unverifiable | Evidence-based cost challenge |
| Finance | Carbon costs unpredictable | Stress-testable cost scenarios |
| Sustainability | ESG metrics disconnected from P&L | Carbon translated into price signals |
| Legal/Compliance | CBAM obligations opaque | Verified data framework for reporting |
Carbon-Inclusive Should-Cost Modelling: A Practical Framework
Building a Carbon-Adjusted Bill of Materials
The methodology for constructing a carbon-inclusive BOM follows a structured sequence that procurement and finance teams can apply at vehicle or component level:
- Map carbon-exposed inputs by origin country and production route, identifying all steel, aluminium, battery metals, and Tier-1 fabricated components subject to CBAM
- Determine CBAM applicability based on whether each input is sourced from a covered country or a jurisdiction with equivalent carbon pricing mechanisms
- Obtain or estimate verified emissions intensity using supplier-provided data where available, applying default values only as a risk-scenario floor rather than a planning baseline
- Apply market-linked ETS and CBAM certificate pricing using independent benchmark references for the quarterly (2026) or weekly (2027 onward) pricing periods
- Stress-test under multiple carbon price trajectories, modelling low (€80/t), base (€100/t), and high (€130/t) EUA price scenarios through to 2030
- Integrate into QCDP frameworks, embedding carbon cost parameters into Quality, Cost, Delivery, and Performance supplier evaluation criteria
A Practical Illustration of the Verification Cost Gap
To understand the financial stakes of the verification question at vehicle level, consider the following illustrative scenario for a European OEM sourcing flat-rolled steel from a non-EU supplier using conventional blast furnace production:
Scenario: 800 kg of imported flat-rolled steel per vehicle, sourced from a non-EU blast furnace producer
- At verified emissions intensity of 1.8 tCO2/t and €75/tCO2 EUA price: CBAM cost approximately €108 per vehicle
- At default emissions values (typically 30 to 40% higher): CBAM cost approximately €140 to €150 per vehicle
- At projected 2030 EUA price of €130/tCO2 with verified data: CBAM cost approximately €187 per vehicle
Across a production run of 200,000 vehicles, the difference between verified and default emissions data alone represents a potential annual cost variance of €6 to €8 million per model year.
That cost differential is not a regulatory abstraction. It is a direct margin variable that can be measured, managed, and in many cases recovered through more rigorous supplier engagement.
The next major ASX story will hit our subscribers first
Green Steel Competition and the Sourcing Strategy Implications
Automotive's Growing Share of European Green Steel Demand
The strategic sourcing dimension of CBAM extends well beyond near-term invoice validation. As European automotive platforms continue their transition toward battery-electric architectures, structural steel and aluminium requirements are shifting in ways that intersect directly with green materials markets. Notably, green steel pricing dynamics are evolving rapidly as demand from automotive and other sectors accelerates, adding further complexity to OEM sourcing decisions.
Automotive demand is projected to represent approximately one-third of European cumulative demand for low- and near-zero-emissions steel through to 2035, equivalent to around 31 million tonnes. This share grows as construction's proportion of green steel consumption declines. The competitive dynamic this creates is significant: as CBAM drives broader demand for verified low-carbon materials across industrial buyers, the pool of certified green tonnes available to automotive OEMs will tighten.
OEMs that have already secured long-term green material supply agreements are positioned to absorb rising carbon costs more predictably than those competing on the spot market for a constrained supply of certified low-carbon inputs. In addition, initiatives such as steel decarbonisation collaboration between major producers are gradually expanding the verified low-carbon supply pool, though not yet at the pace that automotive demand growth requires.
The Carbon-Inclusive Landed-Cost Equation
A commonly held assumption in automotive sourcing is that reshoring to EU-based production automatically provides CBAM protection. This is not straightforwardly correct. EU-based producers carry their own ETS obligations, and green steel premiums add further complexity to the cost comparison.
The relevant analytical question is not domestic versus imported, but what the total carbon-inclusive landed cost is across all available sourcing options. Benchmarks that disaggregate raw material costs, energy components, and embedded carbon charges allow OEMs to perform this comparison with commercial precision rather than strategic assumption. Consequently, the broader shifts playing out across the global iron ore market are also feeding through into production route economics that OEMs cannot afford to ignore.
Strategic Scenarios: Where OEMs Stand in 2026 and Beyond
| Scenario | Approach | Carbon Cost Outcome | Competitive Position |
|---|---|---|---|
| Reactive | Accepts supplier carbon claims; no benchmark integration | High margin leakage risk | Structurally disadvantaged |
| Defensive | Validates costs periodically; reactive benchmark checks | Partial protection | Moderate; cycle-dependent |
| Proactive | Real-time benchmark integration; green supply secured early | Controlled exposure; RFQ precision | Structurally advantaged |
The divide between these strategic postures will widen as CBAM matures. Weekly certificate pricing from 2027 will increase the velocity of carbon cost movements, making reactive or periodic approaches increasingly costly. OEMs that have embedded independent benchmarks into ongoing cost governance frameworks will be structurally better placed to absorb policy shocks, challenge supplier pass-throughs, and optimise sourcing decisions in near real-time.
Furthermore, the China steel market outlook remains a critical variable in this equation, given that Chinese-origin steel inputs continue to represent a significant share of European automotive supply chains and carry distinct CBAM certificate cost implications relative to EU-origin material.
Benchmarks do not eliminate green premiums from supply chain costs. They ensure those premiums are real, proportionate, and commercially defensible. The goal is pricing credibility, not cost avoidance.
Frequently Asked Questions: CBAM and EU ETS for Automotive OEMs
Does CBAM apply directly to imported finished vehicles?
CBAM in its current form covers upstream input materials — primarily steel, aluminium, cement, fertilisers, electricity, and hydrogen — rather than finished manufactured goods such as passenger vehicles. However, automotive OEMs carry significant indirect exposure through the carbon costs embedded in their materials supply chains.
How are CBAM certificate prices calculated?
CBAM certificate prices are directly linked to EU ETS auction outcomes. In 2026, the price is set as a quarterly average of ETS auction results. From 2027, this shifts to a weekly average, meaning CBAM costs will fluctuate more frequently and more closely track live carbon market conditions. Analysis of provisional CBAM benchmarks from Fastmarkets highlights the extent to which these certificate cost structures are already prompting significant trade flow reconsideration across metals markets.
What happens when a supplier cannot provide verified emissions data?
Where verified emissions data is unavailable, default CBAM emissions values are applied automatically. These defaults reflect worst-case emissions intensity assumptions and are typically set well above the verified emissions profile of modern production facilities. The financial penalty for unverified supply chains is estimated at approximately 23% higher CBAM costs in 2026, rising to around 33% by 2027.
How should OEMs approach the phase-out of EU ETS free allowances?
Free allowances for steel (currently around 90%) and aluminium (currently around 78%) will be progressively withdrawn through the late 2020s and early 2030s, reaching full phase-out by 2034. OEMs should begin stress-testing their materials cost models against scenarios in which the effective carbon cost floor rises materially, particularly for the 2028 to 2032 production planning cycle.
What are the priority actions for OEM procurement and finance teams?
- Immediately (2026): Audit all imported material supply chains for CBAM coverage; identify which suppliers can provide verified emissions data and which are defaulting to unverified figures
- Near-term (2026 to 2027): Integrate independent carbon pricing benchmarks into should-cost models and RFQ processes; revise supplier contract structures to include carbon escalation clauses linked to neutral market references
- Strategic (2027 to 2030): Secure long-term green material supply agreements ahead of intensifying competition for verified low-carbon tonnes; embed carbon-inclusive sourcing scenarios into platform and model-year planning cycles
This article contains forward-looking projections and scenario analyses relating to EU ETS pricing, CBAM certificate costs, and green steel market dynamics. These projections are based on publicly available forecasts and analysis as of mid-2026 and should not be treated as guaranteed outcomes. Actual carbon price trajectories, regulatory developments, and materials market conditions may differ materially from those described. Readers are advised to seek independent financial and regulatory advice before making procurement, investment, or contracting decisions based on carbon cost scenarios.
For commodity-specific benchmark data and automotive industry carbon cost analysis, Fastmarkets' automotive intelligence resources offer relevant market coverage: fastmarkets.com/industries/automotive.
Want to Stay Ahead of the Mineral Discoveries Fuelling the Green Metals Transition?
The decarbonisation of automotive supply chains is accelerating demand for verified low-carbon steel, aluminium, and battery metals — and the exploration discoveries underpinning that supply shift are already moving ASX-listed companies. Discovery Alert's proprietary Discovery IQ model delivers real-time alerts the moment significant mineral discoveries are announced on the ASX, translating complex data across 30-plus commodities into clear, actionable opportunities — explore historic discovery returns on Discovery Alert's dedicated discoveries page and begin a 14-day free trial to position yourself ahead of the market.