May 20, 2026
Carbon Costs as a Trade Architecture: Understanding CBAM's Real Function
Most regulatory frameworks reshape behaviour gradually. The EU's Carbon Border Adjustment Mechanism is different. Its architecture is explicitly designed around a hard deadline, a certificate pricing mechanism, and a phase-down schedule that creates compounding financial pressure over time. For global metals traders, that combination does not produce gradual adaptation. It produces concentrated, CBAM front-loading in aluminium and HRC trade flows clustered around predictable inflection points.
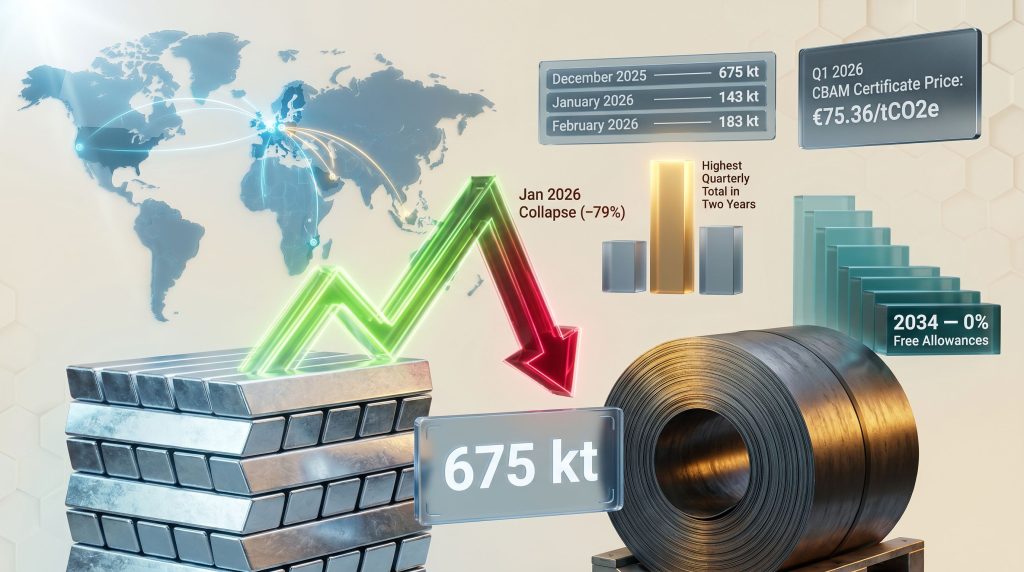
The definitive phase of CBAM commenced on 1 January 2026, converting what had previously been a data reporting obligation into a live financial liability. From that date, importers bringing regulated goods into the EU are required to surrender CBAM certificates priced at the weekly average auction price of EU Emissions Trading System allowances. For Q1 2026, that certificate price was confirmed at €75.36 per tonne of CO2 equivalent. The implications for trade volumes in unwrought aluminium and hot-rolled coil in the weeks before and after that threshold were immediate, measurable, and instructive.
When big ASX news breaks, our subscribers know first
How CBAM Default Emissions Values Create Unequal Competitive Exposure
Central to understanding CBAM front-loading in aluminium and HRC trade flows is the mechanism of default versus actual emissions values. Importers who cannot provide verified, installation-level emissions data for their goods are assigned default values by the European Commission. These defaults are calibrated to reflect the most carbon-intensive production routes typical of each product category.
For steel, that means the blast furnace-basic oxygen furnace (BF-BOF) route, which produces roughly 2.0 to 2.3 tonnes of CO2 per tonne of crude steel. For aluminium, default values reflect smelting processes that include both direct energy combustion and electricity-related emissions. The practical consequence is that exporters relying on default values carry a materially higher CBAM cost per tonne than those who can demonstrate lower-carbon production methods through verified data.
Furthermore, this asymmetry creates a structural competitive divide:
- Low-carbon producers with verified data face reduced or negligible CBAM costs and can price imports more competitively against EU domestic supply
- High-default-value exporters using coal-intensive BF-BOF routes face the full ceiling of CBAM exposure
- EU ETS-linked countries including Norway, Iceland, Switzerland, and Liechtenstein are entirely exempt from CBAM scope, because their domestic carbon pricing systems are treated as equivalent to the EU ETS
That final category is analytically important. When CBAM-exempt countries maintain stable import volumes through a period when third-country volumes are surging, the data itself confirms that the surge is carbon-cost-driven rather than demand-driven. Research on supply chain cost pressures highlights how deeply these structural costs are beginning to reshape procurement decisions across European metals supply chains.
The December 2025 Aluminium Surge: Liability Management, Not Demand
Throughout 2024 and into 2025, EU27 monthly imports of unwrought aluminium held within a stable range of 280 to 360 kt per month. In December 2025, that baseline was obliterated. Monthly volumes reached 675 kt, representing more than double the 2024 monthly average and more than triple the volume recorded in December 2024.
The post-deadline reversal was equally extreme. January 2026 imports fell 79% to 143 kt. February recovered only marginally, reaching 183 kt, still well below pre-CBAM norms.
| Period | EU27 Unwrought Aluminium Imports | Relative to 2024 Average |
|---|---|---|
| 2024-2025 monthly average | ~280-360 kt | Baseline |
| December 2025 | ~675 kt | +2x average; +3x Dec 2024 |
| January 2026 | ~143 kt | -79% from December |
| February 2026 | ~183 kt | Still below pre-CBAM baseline |
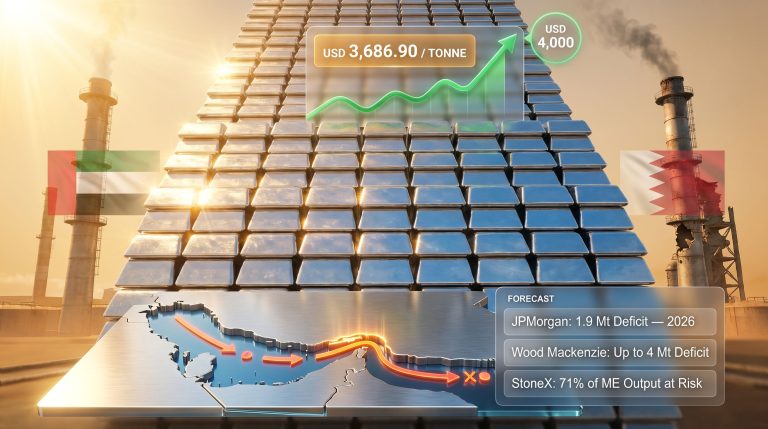
Country-level data removes any remaining ambiguity about the driver. Canada shipped 175 kt in December 2025 and roughly 10 kt in January 2026. Mozambique, which operates energy-intensive smelting dependent on hydropower but still faces CBAM default value exposure, delivered 105 kt in December before dropping to near zero. Bahrain contributed 85 kt before falling to 19 kt. Meanwhile, Norwegian and Icelandic import volumes, both exempt from CBAM, held close to their normal monthly rates throughout.
The financial logic is straightforward. With CBAM default values implying approximately €70 per tonne of aluminium, the aggregate liability avoided across December's surge reached roughly €47 million. That figure comfortably exceeds any reasonable estimate of accelerated logistics and inventory carry costs.
Why Premiums Did Not Spike After the Threshold
An important secondary observation is that the start of the definitive CBAM phase did not produce a sharp rise in European aluminium premiums. The Fastmarkets twice-weekly aluminium P1020A premium, in-warehouse duty-paid Rotterdam, averaged $330 per tonne in early December 2025. By January 2026, that figure had moved only marginally to $343 per tonne, and by February reached $361 per tonne, representing a modest drift rather than a structural repricing.
The explanation lies in inventory arithmetic. December's overshoot above the 2024 monthly average was approximately 368 kt. The combined January and February shortfall against the same average was roughly 290 kt, indicating that a meaningful volume of CBAM-free aluminium was still embedded in European supply chains when the definitive phase began. That buffer absorbed what would otherwise have been immediate upward price pressure.
| Metric | December 2025 | January 2026 | February 2026 |
|---|---|---|---|
| P1020A Rotterdam premium (mid-point) | ~$330/t | ~$343/t | ~$361/t |
| Monthly import volume | 675 kt | 143 kt | 183 kt |
| CBAM phase | Pre-definitive | Definitive | Definitive |
Hot-Rolled Coil: Larger Financial Stakes, Constrained Front-Loading
The dynamics in hot-rolled coil followed the same structural logic, but with two complicating variables: the scale of CBAM exposure per tonne is significantly larger for steel, and EU safeguard quotas placed a hard ceiling on how much pre-deadline volume could physically be accelerated.
Q4 2025 EU27 HRC imports reached approximately 3.0 million tonnes, the strongest quarterly total in two years and roughly 40% above the two-year average. October 2025 alone registered 1.42 million tonnes, the highest single monthly total since July 2024. It should be noted that October regularly sees elevated volumes as the quarterly safeguard quota allocation resets at the beginning of each quarter, but the scale of the Q4 2025 figure goes well beyond seasonal norms.
The reversal in Q1 2026 was sharp. January and February combined reached only 1.3 million tonnes, approximately 470 kt below the average for the first two months of a quarter over the preceding two years, a shortfall of roughly 25%. In addition, the global crude steel outlook for 2025 had already pointed to mounting pressure on trade flows from shifting carbon-cost dynamics.
The implied CBAM liability at stake was substantially larger than in aluminium. Under default emissions values assuming BF-BOF production, the CBAM cost for HRC in 2026 works out to approximately €257 per tonne. Across Q4 2025's 3.0 million tonnes, the aggregate liability avoided amounted to approximately €776 million. The January and February import shortfall, in turn, implies the EU collected roughly €140 million less in CBAM revenues than would have been expected under normal import pacing.
The aggregate CBAM liability avoided through HRC front-loading was approximately 16 times larger than the equivalent figure for aluminium, reflecting both the volume scale of steel trade and the substantially higher carbon intensity of blast furnace production under default assumptions.
Country-Level HRC Data: Exposure Drives Behaviour
The country-level breakdown confirms that the sharpest front-loading occurred precisely where CBAM unit costs were highest under default values.
| Country | Oct-Nov 2025 Imports | Jan-Feb 2026 Imports | Change | Default Value Context |
|---|---|---|---|---|
| Indonesia | ~503 kt | ~64 kt | -87% | Highest default values; BF-BOF production |
| Malaysia | ~163 kt | ~0 kt | -100% | High default value; emissions-intensive route |
| South Korea | ~172 kt | ~93 kt | -46% | Moderate; some actual emissions data available |
| Norway/Iceland/Liechtenstein | 0 kt | 0 kt | No change | CBAM-exempt; no front-loading incentive |
Indonesia's implied CBAM unit cost under default values in 2026 is approximately €580 per tonne of HRC, one of the highest of any major exporting nation. Malaysia's BF-BOF dominated production chain carries a similarly elevated exposure. South Korea's more moderate decline reflects both the partial availability of actual emissions data and the constraining effect of safeguard quota exhaustion, which prevented some exporters from front-loading as aggressively as they might otherwise have chosen to.
The Safeguard Quota Effect on Price Trajectories
The quota constraint on HRC front-loading had a direct consequence for European domestic steel pricing. Because HRC importers could not accumulate the same pre-CBAM inventory buffer that aluminium importers built, European buyers were pushed toward domestic mills earlier in the cycle. The Fastmarkets daily Northern European HRC domestic index averaged €589 per tonne in October 2025 and climbed to €708 per tonne by March 2026, a gain of €119 per tonne over that period.
Price recovery was driven primarily by trade policy uncertainty, including CBAM-related import hesitation and new safeguard measures, rather than any meaningful strengthening of underlying demand conditions. However, the China steel and iron ore market dynamics were simultaneously complicating global supply patterns, adding further pressure on price trajectory forecasting for European buyers.
The contrast with aluminium is direct. Aluminium importers, unconstrained by per-country volume ceilings, built a large CBAM-free inventory overhang that muted premium movements. HRC importers lacked that option, which is why European steel prices responded more sharply and immediately to the definitive phase transition.
CBAM as a Recurring Front-Loading Trigger: The Free Allowance Phase-Down
The December 2025 pattern is not a one-time anomaly. The underlying incentive structure is permanent and intensifies as the free allowance phase-down accelerates toward zero.
| Year | Free Allowance Rate | Year-on-Year Change |
|---|---|---|
| 2026 | 97.5% | Definitive phase begins |
| 2027 | ~90% | Moderate reduction |
| 2028 | ~77.5% | Accelerating step-down |
| 2029 | ~64% | Continued reduction |
| 2030 | 51.5% | -26 percentage point drop from 2029 |
| 2034 | 0% | Full phase-in; no free allowances remain |
The 2029 to 2030 transition represents the single largest year-on-year liability step-change in the schedule. A 26 percentage point reduction in free allowances will compress the financial benefit of clearing goods before 31 December 2029 to a scale potentially exceeding the December 2025 event, particularly for importers still operating under default values rather than verified actual emissions.
The end of 2026 is unlikely to produce a repeat at the same scale given the modest free allowance reduction involved, but every subsequent year-end will carry a version of this incentive until full phase-in is complete. Consequently, understanding tariffs and iron ore trade alongside CBAM dynamics is increasingly necessary for any comprehensive view of where metals trade flows are heading.
Three Horizons of CBAM Market Impact
Short-term (2025-2027): Import surges concentrated in high-default-value origins ahead of each annual threshold. Increasing adoption of DDP (Delivered Duty Paid) contract structures where traders absorb CBAM compliance risk. Buyers delaying spot import decisions pending regulatory clarity on actual versus default emissions pathways.
Medium-term (2027-2031): Widening price spreads between verified low-carbon supply origins and default-value competitors. Accelerating investment by Asian mills in actual emissions measurement and third-party verification to preserve EU market access. Furthermore, green steel pricing trends suggest that decarbonisation investment is increasingly viewed as a commercial imperative rather than a compliance cost, particularly for exporters targeting EU buyers.
Long-term (2031-2034+): Structural trade rerouting toward lower-carbon production origins. Higher-carbon exporters face a binary choice between decarbonisation investment and loss of EU market share. Advances in hydrogen iron ore reduction technology are accelerating this transition for steelmakers seeking to compete in a CBAM-inclusive pricing environment. CBAM functions as a permanent competitive filter embedded into global metals pricing rather than a transitional regulatory measure.
The next major ASX story will hit our subscribers first
Frequently Asked Questions: CBAM Front-Loading in Aluminium and Steel Trade
What exactly is CBAM front-loading and why does it happen?
Front-loading refers to the practice of accelerating import shipments ahead of a regulatory threshold to reduce or eliminate carbon cost liability. Because CBAM certificates must only be surrendered for goods entering the EU after the definitive phase commencement date, goods cleared through customs before that date carry no certificate obligation. When the financial saving per tonne, approximately €70 for aluminium and up to €257 for HRC, exceeds the logistical cost of accelerating shipments, rational actors will consistently choose to front-load.
Which countries are exempt from CBAM and why does this matter analytically?
Norway, Iceland, Switzerland, and Liechtenstein are excluded from CBAM scope because their domestic emissions trading systems are formally recognised as equivalent to the EU ETS. This exemption matters analytically because it creates a natural control group within trade data. When CBAM-exempt countries maintain stable import volumes during a period when third-country volumes are surging, the data pattern itself functions as confirmation that the surge is carbon-cost-driven rather than a reflection of underlying demand changes.
How is the CBAM certificate price determined?
CBAM certificate prices are calculated as the weekly average auction clearing price of EU ETS allowances. This creates a direct, ongoing linkage between EU carbon market conditions and import costs for regulated goods. Because EU ETS prices fluctuate with policy developments, energy market conditions, and economic activity, CBAM import costs are inherently variable, introducing a layer of pricing uncertainty that import contract structures must increasingly account for. European price analyses indicate that this variability is already influencing forward contract structures for major import categories.
What is the difference between default and actual emissions values under CBAM?
Default values are standardised emissions factors set by the European Commission, calibrated to the most carbon-intensive production methods typical of each product category. Actual values are verified, installation-level emissions figures submitted by the exporting facility. For steel producers using electric arc furnaces or renewable-powered smelting, actual values may be substantially below defaults, translating directly into lower CBAM certificate obligations and a structural cost advantage over default-value competitors. Investing in actual emissions verification is therefore both a compliance activity and a commercial competitive strategy for exporters targeting EU market access.
Will front-loading happen again at future phase-down thresholds?
The incentive is permanent and scales with the size of each annual free allowance reduction. The 2029 to 2030 transition, involving a 26 percentage point reduction in free allowances, is the most significant upcoming trigger and has the potential to produce a December import surge exceeding the scale observed in late 2025. The end-of-2026 effect is expected to be modest given the small free allowance step-down, but any importer still operating under default values rather than verified actual emissions will face a recurring incentive to concentrate shipments ahead of each annual reset. This is why CBAM front-loading in aluminium and HRC trade flows will remain a defining structural feature of European metals import patterns for the remainder of this decade.
Disclaimer: This article contains forward-looking analysis, scenario projections, and market commentary based on publicly available trade data and regulatory information. It does not constitute financial or investment advice. Readers should conduct independent research and seek professional guidance before making commercial or investment decisions based on this analysis. All figures cited are drawn from publicly available sources and may be subject to revision as final trade statistics are confirmed.
Want to Stay Ahead of the Next Major Mineral Discovery on the ASX?
While CBAM is reshaping global metals trade flows and carbon cost structures, Discovery Alert's proprietary Discovery IQ model delivers real-time alerts on significant ASX mineral discoveries — instantly translating complex data across more than 30 commodities into clear, actionable insights for traders and investors at every level. Explore how historic mineral discoveries have generated substantial returns and begin your 14-day free trial today to position yourself ahead of the market.