May 16, 2026
The European Union's Carbon Border Adjustment Mechanism represents a pivotal shift in global fertilizer trade dynamics, with profound implications for nitrogen exporters worldwide. The CBAM impact on US nitrogen exports introduces unprecedented complexity to traditional trade patterns, fundamentally altering competitive advantages based on verified carbon performance rather than conventional cost structures. This regulatory framework, becoming fully operational in 2026, specifically targets energy-intensive manufacturing processes that generate substantial greenhouse gas emissions.
Traditional fertilizer trade patterns have historically prioritised geographic proximity, production costs, and logistical efficiency. However, emerging carbon regulations introduce a new variable that could override conventional competitive factors. Furthermore, the mechanism specifically addresses carbon leakage concerns while promoting global decarbonisation through market-based incentives that reward low-emission production technologies and renewable energy solutions.
What is CBAM and Why Does It Target Nitrogen Fertilizers?
The Carbon Border Adjustment Mechanism establishes a carbon pricing framework that becomes fully operational on January 1, 2026. This regulatory structure applies carbon charges to imports of carbon-intensive products, including nitrogen fertilizers such as ammonia, urea, and urea ammonium nitrate (UAN). In addition, the mechanism aims to prevent carbon leakage by ensuring that imports face similar carbon costs as products manufactured within the EU's emissions trading system.
Nitrogen fertilizer production involves energy-intensive processes that generate substantial CO2 emissions through natural gas or coal consumption. The Haber-Bosch process for ammonia synthesis requires high temperatures and pressures, making it one of the most carbon-intensive industrial processes globally. Additionally, nitric acid production for certain nitrogen products generates nitrous oxide (N2O) emissions, a greenhouse gas with significantly higher global warming potential than CO2.
The mechanism differs from traditional trade tariffs by linking charges directly to the carbon content of imported products. While conventional tariffs apply uniform rates regardless of production methods, CBAM creates incentives for cleaner production technologies by offering lower charges for verified low-carbon products.
Which Nitrogen Products Face the Highest Carbon Penalties?
Carbon intensity calculations reveal significant variations across different nitrogen fertilizer products. Ammonia production typically generates 1.5-3.5 tonnes of CO2 equivalent per tonne of product, depending on feedstock choice and production efficiency. Natural gas-based production generally achieves lower emissions than coal or petroleum coke-based processes, contributing to broader energy transition insights.
Urea manufacturing adds additional emissions from the reaction between ammonia and CO2, resulting in total emissions of 1.4-2.5 tonnes CO2e per tonne of product. However, when calculated on a per-unit-nitrogen basis, urea's 46% nitrogen content makes it relatively efficient compared to lower-concentration products.
Ammonium nitrate production faces the steepest penalties due to the carbon intensity of nitric acid manufacturing. The nitric acid production process generates substantial N2O emissions, which have a global warming potential approximately 265 times higher than CO2. Consequently, this makes UAN particularly vulnerable to carbon charges, despite its lower absolute emissions per tonne of product.
When big ASX news breaks, our subscribers know first
What Are the Default Carbon Charges for US Nitrogen Exports?
How Did the EU Calculate US Default Emissions Values?
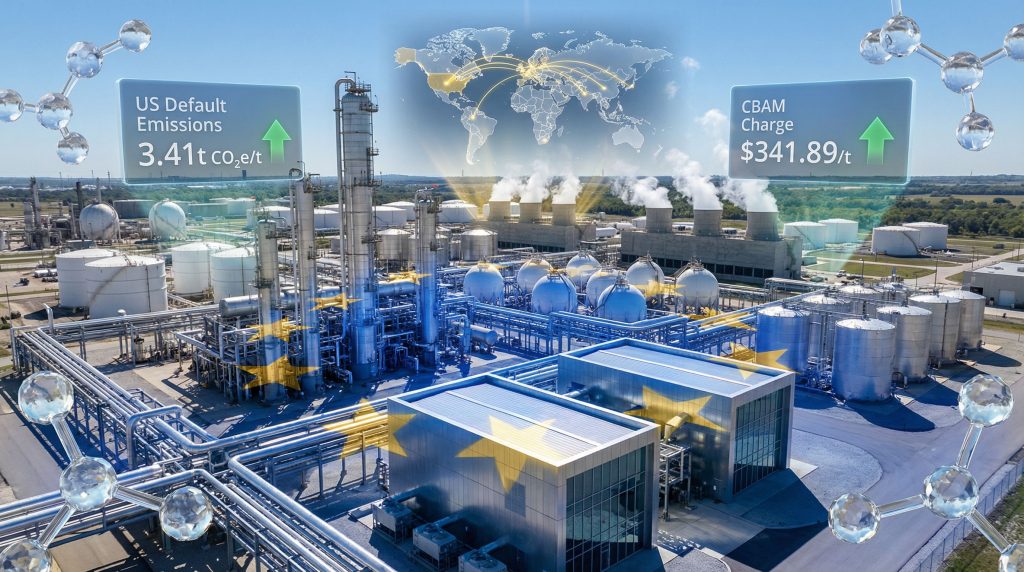
The European Commission's revised US default emissions calculations assume petroleum coke feedstock utilisation rather than the natural gas predominantly used by American nitrogen producers. This methodology resulted in a default value of 3.41 tonnes CO2e per tonne of ammonia, representing a substantial increase from earlier assessments of 2.0 tonnes CO2e per tonne.
This calculation approach appears to reflect the emissions profile of specific inland facilities that utilise petroleum coke rather than the Gulf Coast plants that dominate US exports. Natural gas-based production typically achieves emissions intensities of 2.0-2.5 tonnes CO2e per tonne of ammonia, significantly lower than petroleum coke-based processes that can exceed 3.5 tonnes CO2e per tonne.
The methodology creates an opportunity for US producers to demonstrate actual emissions through verification processes. Moreover, companies utilising natural gas feedstock and implementing carbon capture technologies can potentially achieve verified emissions well below the default assumptions, which aligns with global trade dynamics influencing international markets.
What Will US Exporters Pay Under CBAM in 2026?
Based on the EU ETS price of $100.26/tonne recorded on December 29, 2025, US nitrogen exporters face the following default carbon charges:
| Product | US Default Emissions (t CO2e/t) | CBAM Charge ($/t) | Charge per Tonne Nitrogen ($/t) |
|---|---|---|---|
| Ammonia | 3.41 | $341.89 | $401.05 |
| Urea | 2.31 | $231.60 | $503.48 |
| UAN | 1.76 | $176.46 | $588.20 |
These charges represent significant cost additions that could impact export competitiveness. The per-nitrogen calculations reveal that UAN faces the highest effective carbon cost per unit of nutrient delivered, despite having lower absolute emissions per tonne of product. For instance, this reflects UAN's lower nitrogen concentration compared to urea or ammonia.
The carbon charges fluctuate with EU ETS pricing, creating additional volatility in fertilizer trade economics. When ETS prices rise, CBAM charges increase proportionally, potentially making exports uneconomical during periods of high carbon pricing.
How Can US Producers Reduce Their CBAM Burden?
What Verification Options Exist for Lower Emissions?
US nitrogen producers can achieve lower CBAM charges through emissions verification processes that document actual production emissions rather than default values. This requires comprehensive monitoring of scope 1 emissions, including direct combustion, process emissions, and fugitive releases throughout the production chain.
The verification pathway demands third-party auditing and EU regulatory acceptance of emissions calculations. Companies must demonstrate measurement accuracy, data integrity, and compliance with European methodology requirements. However, this process involves significant administrative costs and timeline commitments that smaller producers may find challenging to navigate.
CF Industries reported scope 1 emissions of 2.11 tonnes CO2e per tonne of ammonia across all facilities in 2024, substantially below the 3.41 tonne default assumption. Nevertheless, this figure includes emissions from downstream processing units, suggesting that pure ammonia production emissions are even lower than reported company-wide averages.
Which US Facilities Are Best Positioned for CBAM Compliance?
The Donaldsonville facility in Louisiana, operated by CF Industries, represents the most advanced positioning for CBAM compliance among US nitrogen producers. This facility combines 3.84 million tonnes per year of ammonia capacity with carbon capture infrastructure and natural gas feedstock utilisation, demonstrating the industry evolution trends affecting major producers.
Carbon sequestration capabilities at Donaldsonville include partnerships with ExxonMobil for enhanced oil recovery and plans for permanent geological storage pending regulatory permits. The facility can potentially sequester 2 million tonnes of CO2 per year while producing 1.9 million tonnes of low-carbon ammonia annually.
The facility already incorporates N2O abatement technology on approximately one-third of its nitrate production units. Additionally, this demonstrates technical capabilities for emissions reduction across multiple production pathways. Additional technology deployment could further reduce verified emissions below current levels.
Woodside Energy's Beaumont facility in Texas represents new capacity specifically designed with lower-carbon operations in mind. The 1.1 million tonne per year facility began producing ammonia in December 2025 and plans to commence low-carbon ammonia production in the second half of 2026.
How Much Can Emissions Reduction Lower CBAM Costs?
Achieving zero CBAM charges requires substantial emissions reductions from current default assumptions. Urea production would need 62% reduction from the 2.31 tonne CO2e default, requiring achievement of approximately 0.88 tonnes CO2e per tonne of product. Similarly, UAN would require 65% reduction from 1.76 tonnes CO2e, targeting approximately 0.62 tonnes CO2e per tonne.
These reduction targets are technically achievable through combinations of:
- Natural gas feedstock utilisation instead of petroleum coke or coal
- Carbon capture and sequestration technologies for process emissions
- N2O abatement systems for nitric acid production
- Energy efficiency improvements across production operations
- Renewable electricity integration for auxiliary power requirements
CF Industries' existing blue ammonia production demonstrates commercial-scale achievement of significantly lower emissions. The company exported its first low-carbon ammonia cargo to Europe in October 2025, achieving emissions described as significantly lower than conventional natural gas-based production.
What Competitive Advantages Will CBAM Create?
How Will US Exports Compare to Traditional Suppliers?
Traditional nitrogen exporters face varying CBAM charges based on their default emissions assumptions and production technologies. The competitive landscape reveals significant disparities in carbon cost burdens:
| Origin | Product | Default Emissions (t CO2e/t) | CBAM Charge ($/t) | Competitive Position |
|---|---|---|---|---|
| Algeria | Urea | 1.40 | $52-57 | Low-cost baseline |
| Egypt | Urea | 1.40 | $52-57 | Low-cost baseline |
| Trinidad & Tobago | UAN | 1.43 | $82-104 | Moderate carbon burden |
| Russia | UAN | 1.65 | $82-104 | Higher carbon burden |
| US (default) | Urea | 2.31 | $231.60 | Significant disadvantage |
| US (verified low-carbon) | Various | Variable | $0-50 | Potential advantage |
US producers operating under default assumptions face competitive disadvantages of $170-180 per tonne compared to North African urea suppliers. However, successful verification of low-carbon production could create competitive advantages over all traditional suppliers, particularly for UAN where competing origins face moderate to high carbon charges.
The verification pathway represents a critical competitive differentiator. Producers achieving verified emissions below 0.5 tonnes CO2e per tonne could essentially eliminate CBAM charges while competitors continue paying carbon penalties based on default assumptions or less efficient production technologies.
Which Market Segments Offer the Greatest Opportunity?
UAN represents the highest-value opportunity for US low-carbon nitrogen exports under CBAM. Traditional UAN suppliers from Trinidad & Tobago and Russia face carbon charges ranging from $82-104 per tonne, creating substantial competitive gaps for verified low-carbon US production.
European UAN demand patterns favour liquid nitrogen solutions for precision agriculture applications, creating premium market segments where carbon credentials could command price premiums beyond simple carbon cost avoidance. These applications typically serve higher-value crop production where sustainability credentials influence purchasing decisions, reflecting broader investment strategy insights in sustainable sectors.
The seasonal nature of European fertilizer demand creates additional opportunities for US exporters. Summer and fall periods traditionally represent off-peak demand when US domestic markets are less active, allowing producers to compete more aggressively for European market share without sacrificing domestic sales.
What Are the Implementation Challenges and Uncertainties?
Which Regulatory Hurdles Remain Unresolved?
Verification process complexities create significant uncertainty around implementation timelines and compliance costs. The European Union has not published detailed guidance on acceptable monitoring methodologies, third-party verification standards, or appeals processes for disputed emissions calculations.
Administrative capacity constraints may delay verification approvals, potentially forcing producers to operate under default assumptions longer than anticipated. The EU's regulatory infrastructure must process verification applications from global suppliers while maintaining accuracy and consistency across different production technologies and regional standards.
Potential implementation postponements remain possible as European regulators address technical challenges and industry feedback. Furthermore, the complexity of implementing carbon border adjustments across multiple sectors simultaneously may require phased approaches or delayed enforcement timelines.
Harmonisation issues between EU member states could create inconsistent enforcement and administrative requirements. Different national authorities may interpret verification standards differently, creating compliance uncertainties for exporters serving multiple European markets.
How Will Global Trade Flows Adjust?
CBAM implementation will likely trigger significant shifts in global nitrogen trade patterns. High-carbon suppliers may redirect exports toward non-European markets, increasing competition in regions without carbon border adjustments while potentially tightening European supply balances.
Export diversion effects could impact global pricing dynamics as suppliers traditionally focused on European markets seek alternative destinations. This reallocation may benefit low-carbon producers by reducing competition in European markets while creating oversupply pressures in unregulated regions.
Long-term structural adjustments may include investment in carbon reduction technologies by traditional suppliers seeking to maintain European market access. However, the capital intensity and technical complexity of retrofitting existing facilities may limit the speed of competitive responses.
What Investment Implications Emerge from CBAM?
Which Infrastructure Investments Will CBAM Drive?
Carbon capture and sequestration projects represent the most direct response to CBAM requirements. CF Industries' partnership with ExxonMobil for permanent CO2 storage demonstrates the infrastructure investments required for verified emissions reductions. The partnership targets 2 million tonnes of annual sequestration capacity, requiring substantial capital commitments for capture equipment, transportation infrastructure, and storage facilities.
Emissions monitoring and verification systems require comprehensive upgrades to meet European regulatory standards. These investments include continuous emissions monitoring equipment, data management systems, and third-party verification protocols that ensure accuracy and regulatory compliance.
Green ammonia production facilities represent longer-term investment opportunities as electrolysis technologies mature and renewable electricity costs decline. These projects could achieve near-zero carbon emissions while serving both fertilizer and industrial markets, according to recent analysis from the Carbon Trust examining the implications for importers and exporters.
How Will Production Economics Change?
The CBAM impact on US nitrogen exports fundamentally alters the cost-benefit analysis for emissions reduction investments. Previously, carbon reduction technologies competed primarily on energy efficiency or regulatory compliance bases. Under CBAM, verified emissions reductions translate directly into market access advantages and potential price premiums.
The economic value of carbon reduction now includes avoided CBAM charges, enhanced market access, and potential premium pricing for low-carbon products. This expanded value proposition may justify investments in carbon capture, renewable energy, and process optimisation that were previously uneconomical.
Production facilities with natural advantages for low-carbon operations gain strategic value beyond traditional metrics. Locations with renewable electricity access, CO2 storage potential, or efficient natural gas supply may command investment premiums as carbon credentials become competitive differentiators.
The next major ASX story will hit our subscribers first
Regional Market Impact Analysis
How Will North American Nitrogen Markets Respond?
Increased European export opportunities for verified low-carbon US nitrogen could tighten domestic supply balances, particularly during traditional off-peak periods when exports typically increase. Competition between European importers and North American buyers may support domestic pricing during summer and fall periods.
Spring application seasons may experience supply constraints if significant volumes redirect toward European markets during winter shipping periods. US agricultural buyers traditionally rely on winter inventory building to meet spring demand, creating potential supply chain pressures.
Strategic stockpiling behaviour may increase as market participants anticipate supply tightness. Agricultural retailers and distributors could accelerate inventory accumulation to hedge against potential shortages during critical application windows.
What Does This Mean for Global Nitrogen Trade Balance?
CBAM accelerates the evolution toward carbon-differentiated commodity markets where environmental performance becomes a primary competitive factor. This transformation extends beyond Europe as other regions consider similar carbon border adjustment mechanisms, as highlighted in recent research from S&P Global examining fertilizer sector challenges.
Long-term competitive positioning increasingly favours producers with demonstrated decarbonisation capabilities. Investment decisions will prioritise facilities and technologies that can achieve verified low-carbon production, potentially stranding high-carbon assets in markets with environmental regulations.
The integration of environmental compliance into trading strategies requires new risk management approaches. Price volatility may increase as carbon markets influence fertilizer values, while supply chain security becomes linked to environmental performance verification.
Strategic Outlook: Preparing for the CBAM Era
What Should Market Participants Expect in 2026-2027?
The initial CBAM implementation period will likely feature significant market volatility as participants adjust to new competitive dynamics. Price discovery mechanisms must incorporate carbon costs alongside traditional supply-demand factors, creating complexity in pricing models and contract structures.
Market share redistribution among global nitrogen suppliers appears inevitable as low-carbon producers gain competitive advantages over traditional cost-based competitors. US producers with verification capabilities may capture European market share previously dominated by North African and Eastern European suppliers.
Transition period challenges include administrative delays, verification backlogs, and regulatory clarifications that could create temporary competitive distortions. Early movers in verification processes may gain first-mover advantages in European market access.
How Will CBAM Influence Long-Term Industry Structure?
The CBAM impact on US nitrogen exports signals fundamental restructuring around carbon performance rather than purely cost-based competition. This shift parallels broader industrial decarbonisation trends where environmental credentials become essential for market access and premium pricing.
Investment patterns will increasingly prioritise carbon reduction technologies, renewable energy integration, and emissions monitoring capabilities. Traditional competitive advantages based on low-cost feedstocks or geographic proximity may become secondary to verified environmental performance.
The development of carbon-differentiated pricing mechanisms creates new market segments where premium products command price advantages based on sustainability credentials. This segmentation may drive industry consolidation as scale becomes necessary for verification investments and technology deployment.
The transformation of global nitrogen trade through carbon border adjustments represents one of the most significant regulatory developments in fertilizer markets. Success in this evolving landscape will depend on companies' abilities to adapt production technologies, navigate complex verification processes, and develop market strategies that capitalise on environmental performance advantages. As CBAM implementation approaches, the industry stands at the threshold of a new competitive era where carbon credentials may prove as important as traditional cost advantages.
Important Disclaimer: This analysis involves forecasts and projections based on current regulatory proposals and market conditions. However, CBAM implementation remains subject to regulatory changes, enforcement delays, and technical modifications that could materially affect competitive dynamics and investment outcomes. Market participants should conduct independent analysis and consult with regulatory and technical specialists before making strategic decisions based on these projections.
Ready to Capitalise on the Fertilizer Market's Carbon Transformation?
Discovery Alert's proprietary Discovery IQ model delivers real-time alerts on significant mineral discoveries across critical commodities, including potash and phosphate resources essential for the evolving fertilizer sector. As CBAM reshapes global nitrogen trade and creates new investment opportunities in low-carbon production technologies, explore Discovery Alert's discoveries page to understand how major mineral discoveries have generated substantial returns for early investors. Begin your 30-day free trial today to position yourself ahead of the market as carbon-driven transformations create new competitive advantages in agricultural commodities.