
July 13, 2026
When Fewer Rigs Produce More Oil: The Productivity Revolution Reshaping US Energy Markets
The relationship between drilling activity and oil output has always been one of the most closely watched dynamics in global energy markets. For decades, a rising rig count reliably signalled an imminent increase in production, while a falling count warned of future supply constraints. That predictability gave investors, traders, and policymakers a simple framework for interpreting weekly data releases from Baker Hughes. However, something fundamental has changed in the structure of US shale production.
The latest drilling figures for the week ending May 8, 2026 offer a striking illustration of just how dramatically that framework needs updating. The US oil rig count jumps amid rising crude prices driven by the ongoing Strait of Hormuz closure, with the headline number telling only a fraction of the story. The deeper narrative involves a productivity transformation that has allowed American shale operators to approach all-time production records while running fewer rigs than at any comparable output level in history.
When big ASX news breaks, our subscribers know first
Understanding the Baker Hughes Rig Count: Why This Weekly Metric Moves Markets
What the Baker Hughes Rig Count Actually Measures
The Baker Hughes Rig Count is the energy industry's most widely cited benchmark for measuring active drilling activity across North America, providing a real-time pulse on how many rotary drilling rigs are physically engaged in boring new wells at any given moment. Crucially, the count excludes rigs that are in transit between locations, standing by for permits, or engaged in workover operations on existing wells. This specificity makes it a precise measure of forward investment intent rather than a broad gauge of industry activity.
The data is segmented into three primary categories: oil-directed rigs, gas-directed rigs, and miscellaneous rigs. This granular breakdown allows analysts to detect shifts in operator preference between hydrocarbon types, which can reveal important intelligence about where capital is flowing and what production trajectories are likely in the months ahead.
How Rig Count Data Is Collected and Published
Baker Hughes field representatives contact drilling contractors and operators each week to verify the operational status of individual rigs across every major US basin. This ground-level verification process is cross-referenced against drilling permits filed with state regulatory agencies, including the Texas Railroad Commission and the North Dakota Industrial Commission, creating a multi-layered quality control process that has maintained the integrity of the dataset since Hughes Tool Company began tracking the metric in 1944.
The official report is published each Friday afternoon, after US markets close. The timing is deliberate, allowing market participants to digest the data over the weekend rather than generating immediate intraday volatility. Despite this, the figures consistently influence oil futures trading on the following Monday, as the rig count feeds into the supply-side models underpinning price forecasts at major investment banks and trading desks globally.
Why Energy Analysts, Traders, and Policymakers Watch This Number Closely
The Baker Hughes Rig Count functions as a leading indicator for future production trends, providing approximately 4 to 12 weeks of advance warning before new wells begin contributing to measured output. This lag creates an important forecasting window that gives market participants a meaningful head start in adjusting supply expectations before the EIA's official production figures reflect any change.
Beyond financial markets, US policymakers at the Department of Energy and the Federal Reserve monitor US drilling activity decline as an economic barometer, given the sector's significant employment footprint and its broader influence on inflation dynamics in energy-producing regions. Since the shale revolution elevated the United States to the position of the world's largest crude oil producer, what was once a domestic industry curiosity has become a globally consequential signal that factors into OPEC+ deliberations and geopolitical risk assessments worldwide.
The Current State of US Drilling Activity: A Structural Snapshot
Key Metrics at a Glance (Week Ending May 8, 2026)
The Baker Hughes data for the week ending May 8, 2026 presents a picture of selective drilling expansion against a backdrop of structural restraint. According to Baker Hughes weekly reporting, the figures are as follows:
| Metric | Current Reading | Week-over-Week Change | Year-over-Year Change |
|---|---|---|---|
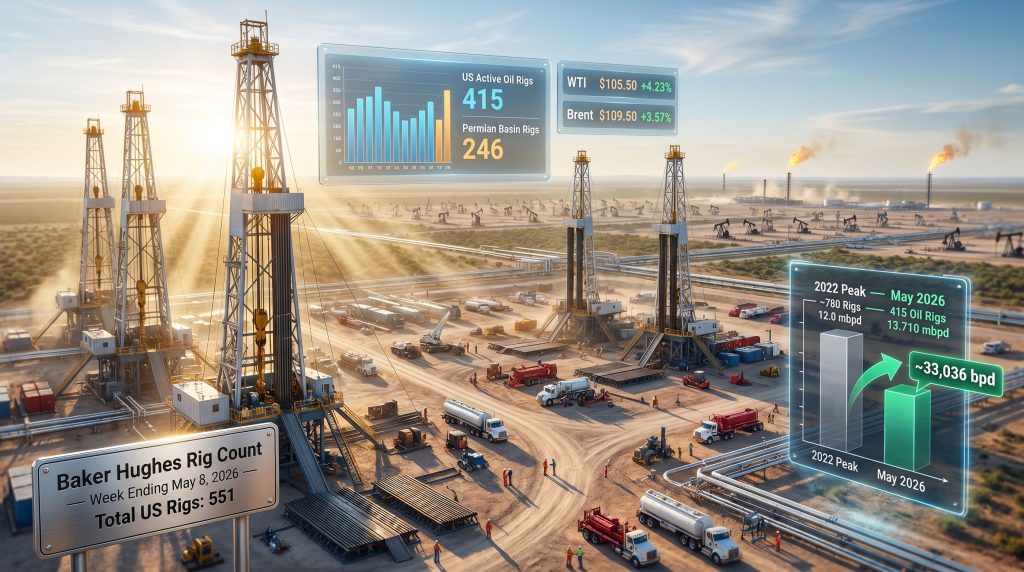
| Total US Rig Count | 551 | +3 | -25 |
| Active Oil Rigs | 415 | +5 | -50 |
| Active Gas Rigs | 128 | -1 | +20 |
| Miscellaneous Rigs | 8 | -1 | N/A |
| Permian Basin Rigs | 246 | +4 | -36 |
| Eagle Ford Rigs | 42 | -1 | -4 |
Despite the meaningful week-over-week increase in oil rig activity, the total count remains 25 rigs below the same period in 2025. This structural divergence between rising production and falling rig counts is one of the defining efficiency stories of the modern shale era.
Oil Rigs vs. Gas Rigs: Diverging Trajectories in 2026
The simultaneous rise in oil rigs and decline in gas rigs reflects sharply different economic incentives across the two hydrocarbon categories. With WTI crude trading at $105.50 per barrel and Brent at $109.50 per barrel, the margin above breakeven for oil-directed drilling is historically wide. Natural gas, by contrast, remains under pressure at approximately $2.959 per MMBtu, offering far narrower economics for dedicated gas drilling programmes.
Furthermore, this divergence is structurally reinforced by the way associated gas production functions in oil-heavy plays. In basins like the Permian, natural gas emerges as a byproduct of oil extraction rather than a primary target, meaning gas production volumes continue growing even as dedicated gas-directed rig counts decline. This dynamic has created ongoing infrastructure and flaring pressure in the basin, prompting increasing scrutiny from state regulators.
What the Permian Basin's Rig Additions Reveal About Operator Confidence
The Permian Basin's addition of 4 rigs to reach 246 active units signals a measured increase in operator confidence, driven by crude oil price trends well above the basin's typical breakeven range of $40 to $55 per barrel. Examining crude oil price trends at current WTI levels, the net present value of new well development in core Permian acreage is compelling even under conservative price assumptions.
However, the fact that the Permian still sits 36 rigs below year-ago levels despite $105 crude underscores the structural shift toward capital discipline that has become the industry's dominant operating philosophy since 2022. Operators are clearly exercising restraint, prioritising shareholder returns and debt reduction over maximum drilling activity even when price signals would traditionally justify a more aggressive response.
Why the Eagle Ford Decline Deserves Separate Attention
The Eagle Ford Shale's slip to 42 active rigs, down 4 year-over-year, reflects a set of basin-specific challenges that distinguish it from the Permian. The Eagle Ford's geology features generally shallower, thinner reservoir intervals that tend to generate higher per-well development costs relative to the stacked pay formations accessible in the Permian's Wolfcamp and Spraberry zones. As operators allocate finite capital budgets across competing opportunities, the Eagle Ford's relative cost disadvantage is becoming more pronounced.
Additionally, much of the Eagle Ford's highest-quality acreage has been developed over the past decade, meaning the incremental wells being drilled today often target less productive rock than those drilled in earlier cycles. This acreage maturation dynamic, combined with higher per-well economics, explains why operators are consolidating activity in the Permian rather than expanding the Eagle Ford programme at current price levels.
Is Rising Crude Price the Primary Driver Behind the Rig Count Increase?
The Historical Price-to-Rig Correlation: How Strong Is It Really?
Historically, a sustained move above $80 per barrel for WTI has served as the threshold that triggers meaningful rig additions across the US shale sector. At current WTI levels of $105.50 per barrel, the economic incentive to deploy additional rigs is theoretically significant. Yet the 5-rig weekly gain in oil-directed activity is remarkably modest relative to the magnitude of the price signal.
This muted response reveals that the traditional price-to-rig correlation has substantially weakened since 2022. The reasons are structural rather than cyclical:
- Large US shale producers now operate under formal capital return frameworks that cap reinvestment rates regardless of commodity prices
- Board-level commitments to dividend growth and share buyback programmes create institutional constraints on discretionary spending
- Post-2020 investor activism has permanently altered the incentive structure for management teams, making production maximisation a secondary priority behind free cash flow generation
- Debt reduction remains a priority for many operators still carrying leverage from the 2014 to 2016 downcycle
The Capital Discipline Factor: Why Producers Aren't Chasing Price Spikes With Rigs
The era of unconstrained drilling in response to rising prices is structurally over for US shale. Operators are now governed by capital allocation frameworks that treat rig additions as deliberate, board-approved decisions rather than reflexive responses to commodity price movements.
This transformation in corporate governance has created a new paradigm where the relationship between price and drilling activity is mediated by shareholder return commitments. Even at $100+ crude, rig additions tend to be measured rather than aggressive, with operators preferring to capture the windfall margin through buybacks and dividends rather than reinvesting it into new wells that might not come online until prices have corrected. Consequently, oil price volatility has become a less reliable trigger for rapid drilling expansion than it once was.
Efficiency Gains Are Doing the Heavy Lifting: Longer Laterals, Better Completions
Perhaps the most underappreciated dimension of current US drilling data is the role that per-well productivity improvements have played in decoupling rig count from production growth. The average lateral length of a horizontal shale well in the Permian has extended significantly over the past five years, with some operators now routinely drilling wells exceeding 15,000 feet of lateral exposure compared to the 6,000 to 8,000 foot laterals that were standard a decade ago.
Longer laterals mean more reservoir contact per well, which translates directly into higher initial production rates and greater ultimate recovery volumes. When combined with optimised hydraulic fracturing designs that use higher proppant loadings and more closely spaced perforation clusters, the result is a step-change improvement in what each rig can ultimately contribute to the national production base.
How the Frac Spread Count Adds a Second Layer of Insight
For market participants seeking a more timely signal than the weekly rig count, Primary Vision's Frac Spread Count provides a complementary dataset that tracks the number of completion crews actively working across the US at any given time. For the week ending May 8, 2026:
- The Frac Spread Count rose by 5 crews to reach 179 active completion units
- This represents the highest frac spread count since November, indicating a meaningful acceleration in well completion activity
- The divergence between rig count growth and completion crew growth points to a growing inventory of drilled-but-uncompleted (DUC) wells being activated in response to elevated prices
The DUC inventory functions as a strategic buffer that allows operators to accelerate production without committing to new drilling programmes. When prices rise sharply, as they have in response to the Hormuz closure, operators can deploy completion crews to bring forward-drilled wells online relatively quickly, bypassing the lead time associated with spudding entirely new wellbores. This mechanism partially explains why US oil production trends can respond to price signals faster than the formal rig count would suggest.
US Crude Production: How Close Is the Industry to Breaking Records?
Weekly Output Hits 13.710 Million Barrels Per Day
EIA data for the week ending May 8, 2026 confirms that US crude oil production averaged 13.710 million barrels per day, a figure that sits just 152,000 barrels per day below the all-time production record. Achieving this output level with a significantly reduced rig count compared to prior peak periods represents one of the most consequential efficiency stories in the history of the global oil industry.
To contextualise the magnitude of this productivity transformation, consider the following comparison:
| Period | Approximate Oil Rig Count | US Production (mbpd) | Implied Output Per Rig (bpd) |
|---|---|---|---|
| 2022 Peak (Rig Activity) | ~780 | ~12.0 | ~15,385 |
| May 2026 | 415 | ~13.71 | ~33,036 |
US shale is now producing roughly twice as much oil per active rig compared to the previous peak period in 2022. This productivity revolution fundamentally changes how rig count data should be interpreted as a forward production signal.
What Near-Record Production With Fewer Rigs Means for Global Supply Forecasts
The structural efficiency gains embedded in these figures have significant implications for global supply models. International energy agencies and investment bank research desks that continue to model US production as a linear function of rig count risk systematically underestimating American output capacity. The practical consequence is that consensus supply forecasts may be persistently too bearish on US production, contributing to cycles of surprise upside in domestic output data.
For OPEC's market influence and its strategists, this efficiency dynamic creates a persistent uncertainty around how much US production can be induced by elevated prices. In addition, if the marginal rig deployed in 2026 can generate more than double the output of its 2022 equivalent, then the effective supply response capacity of the US shale sector is considerably larger than historical rig count analysis would suggest.
The EIA's Role in Translating Weekly Data Into Market-Moving Narratives
The Energy Information Administration publishes weekly petroleum supply data through its Short-Term Energy Outlook and the Weekly Petroleum Status Report, providing the official production figures that complement Baker Hughes' drilling activity data. The EIA's methodology uses a combination of operator surveys, pipeline flow data, and statistical modelling to produce weekly production estimates, which are then revised as more complete data becomes available.
This revision cycle means that the weekly production figure of 13.710 million barrels per day may be subject to upward or downward adjustment in subsequent releases, a nuance that sophisticated market participants incorporate into their analysis but that often goes unreported in headline coverage of the data.
The Geopolitical Catalyst: How the Strait of Hormuz Closure Is Reshaping US Drilling Economics
Why Hormuz Matters to US Producers Even Though They Don't Ship Through It
The Strait of Hormuz carries an estimated 20% of global oil trade, representing approximately 17 to 21 million barrels per day of crude oil, condensate, and petroleum products flowing between the Persian Gulf and international markets. The United States does not route its own exports through this waterway, yet the Hormuz closure has generated one of the most significant crude price increases of the current decade, directly benefiting the economics of every barrel produced in American shale basins.
The mechanism is straightforward: a supply shortfall in one region of the globally integrated crude oil market ripples immediately into benchmark prices worldwide. When Hormuz transit is restricted, the physical barrels that would have moved through the strait cannot easily be replaced by alternative supply routes in the short term, creating an effective reduction in globally available crude that bids up Brent and WTI regardless of where the barrels are produced or consumed.
The Price Transmission Mechanism: From Hormuz Disruption to Permian Rig Deployment
The pathway from geopolitical disruption to incremental US drilling activity follows a sequence that unfolds over several weeks:
- Hormuz transit restrictions reduce effective global crude supply available to markets
- Brent and WTI respond with sharp upward movements, gaining approximately $9 to $10 per barrel week-over-week as of May 15, 2026
- Elevated price signals improve the net present value calculation for new well development across all major US shale basins
- Operators activate existing DUC inventories, deploying completion crews before committing to new drilling programmes
- The Frac Spread Count rises, as evidenced by the jump to 179 active crews for the week ending May 8, 2026
- Formal rig count additions follow as operators gain confidence that elevated prices will persist, with a typical lag of several weeks after completion activity accelerates
- Production volumes begin climbing approximately 4 to 8 weeks after new wells are completed and brought online
Brent at $109.50 and WTI at $105.50: What These Levels Mean for US Breakeven Economics
Most US shale plays carry breakeven costs ranging from approximately $40 to $65 per barrel depending on basin geology, operator efficiency, and acreage quality. At current WTI levels above $105, the margin above breakeven is historically wide, creating powerful economic incentives for measured drilling expansion while still preserving the capital return frameworks that define modern shale operating strategy.
The Permian Basin's core Midland and Delaware sub-basins represent the lowest-cost acreage in the US, with some operators able to generate attractive returns at WTI prices below $40 per barrel on premium locations. At $105 WTI, the economics of even secondary and tertiary Permian locations become commercially viable, which helps explain the basin's 4-rig weekly addition despite the broader capital discipline environment.
Could US Shale Realistically Offset Hormuz-Related Supply Losses?
The honest answer is: not quickly, and not fully. Even if US operators responded to the Hormuz closure with an aggressive drilling campaign, the production response would arrive with a 3 to 6 month lag at minimum. Furthermore, the volumes that could be mobilised are constrained by pipeline takeaway capacity, completion crew availability, and the capital discipline frameworks discussed above. As OilPrice.com has noted, structural constraints make it essentially impossible for US drillers to solve a world oil supply crisis on a short-term basis, regardless of price levels.
The IEA's revised 2026 forecast reflects this reality, with the agency projecting a widening oil deficit as Iranian war-related production cuts combine with the Hormuz disruption to create a supply gap that no single alternative producer can rapidly bridge.
The next major ASX story will hit our subscribers first
Basin-Level Analysis: Where Are the Rigs Going and Why?
The Permian Basin: Still the Engine of American Oil Growth
With 246 active rigs accounting for approximately 59% of all US oil-directed drilling activity, the Permian Basin's dominance in American shale remains absolute. The basin's geological advantages are multifaceted:
- Multiple stacked pay zones within the Wolfcamp, Spraberry, Bone Spring, and Delaware formations allow operators to drill multiple wells from a single surface pad, dramatically reducing per-barrel development costs
- The basin's thick reservoir intervals and high organic content generate superior initial production rates compared to shallower plays like the Eagle Ford
- Decades of seismic acquisition and well data have created an unparalleled subsurface understanding that allows operators to optimise well placement with precision
- Existing infrastructure density in terms of pipelines, processing facilities, and water handling networks reduces incremental development costs for new wells
Despite these advantages, the Permian's rig count of 246 remains 36 units below year-ago levels, a reminder that even America's most productive basin is operating under the constraints of capital discipline rather than at its theoretical maximum capacity.
Eagle Ford: Reading the One-Rig Decline Correctly
The Eagle Ford's decline to 42 active rigs, down 4 year-over-year, should not be interpreted as a signal of basin failure but rather as a rational capital allocation decision in a market where the Permian offers superior economics. The Eagle Ford's tight carbonate reservoir requires precise horizontal well placement within relatively thin pay intervals of 100 to 300 feet, compared to the much thicker stacked intervals accessible in the Permian. This geological constraint limits the productivity upside from extended lateral drilling and reduces the efficiency gains that have driven Permian productivity improvements.
Operators in the Eagle Ford are increasingly focused on optimising production from existing wellbores through refracking programmes and artificial lift optimisation rather than committing capital to new well development, a strategic posture that reflects the basin's maturation rather than any fundamental impairment of its resource base.
Other Key Basins to Watch: Bakken, DJ Basin, and Haynesville
Beyond the Permian and Eagle Ford, the Williston Basin's Bakken formation in North Dakota continues to contribute meaningfully to national production, though its higher operating costs in an extreme-weather environment limit its competitiveness relative to Permian economics. The DJ Basin in Colorado offers attractive economics but faces ongoing regulatory challenges related to setback requirements and permitting timelines that constrain the pace of development. The Haynesville Shale in Louisiana and East Texas, primarily a gas play, is benefiting from the year-over-year increase in gas-directed rig activity as LNG export demand continues to grow, with the Hormuz crisis amplifying global appetite for US LNG as an alternative to Middle East supply.
What Does a Year-Over-Year Rig Count Decline Mean When Production Is Near Record Highs?
The Productivity Paradox: Fewer Rigs, More Oil
The juxtaposition of a 50-rig year-over-year decline in oil-directed drilling alongside near-record production of 13.710 million barrels per day represents a fundamental challenge to traditional supply analysis frameworks. Analysts who continue to use rig count as a direct proxy for production trajectory risk systematically underestimating US output potential in the current efficiency environment.
Several technological and operational advances are driving this productivity step-change:
- Extended reach horizontal drilling: Modern drill bits and rotary steerable systems enable lateral lengths exceeding 15,000 feet, exposing far more reservoir rock per well than was achievable a decade ago
- High-intensity hydraulic fracturing: Increased proppant loading (often exceeding 3,000 pounds per lateral foot) and tighter perforation cluster spacing create denser fracture networks that dramatically improve well productivity
- Multi-well pad development: Drilling multiple wells from a single surface location reduces per-well costs by sharing infrastructure and allowing completion crews to move between wells without rig-down time
- Data-driven completion optimisation: Real-time downhole monitoring and machine learning algorithms allow operators to adjust fracturing parameters on the fly, maximising the efficiency of each completion stage
- DUC inventory management: Strategic accumulation and selective activation of drilled-but-uncompleted wells gives operators a flexible production lever that decouples short-term output decisions from the formal rig count
Why Traditional Rig Count Analysis Can Mislead Investors and Analysts
Important Notice: The information presented in this article is for educational and informational purposes only and does not constitute financial or investment advice. Commodity markets carry significant risk, and past relationships between indicators such as rig counts and production levels may not reliably predict future outcomes. Readers should consult qualified financial professionals before making investment decisions.
Using rig count as a direct proxy for future production growth, as was common practice before 2020, risks significantly underestimating US output potential in the current era. A complete framework for interpreting US drilling activity in 2026 should incorporate:
- The Frac Spread Count as a more timely leading indicator of near-term production additions
- DUC inventory levels as a measure of latent production capacity that can be mobilised without new drilling
- Average lateral length trends as a multiplier on the productivity of each rig deployed
- Per-well initial production rates as a direct measure of the output contribution from new wells
- Basin-level breakeven economics to assess which plays are likely to attract incremental capital at different price levels
FAQ: US Oil Rig Count and Crude Price Dynamics
What Is the Current US Oil Rig Count?
As of the week ending May 8, 2026, the US active oil rig count stands at 415, reflecting a gain of 5 rigs during the reporting period, according to Baker Hughes data published on May 15, 2026.
Why Did the US Oil Rig Count Jump This Week?
The increase is broadly attributed to elevated crude prices driven by geopolitical supply disruptions, particularly the ongoing closure of the Strait of Hormuz, which has pushed WTI above $105 per barrel and Brent above $109 per barrel, improving the economics of new well development across major US shale basins.
Is a Rising Rig Count Bullish for Oil Production?
In the medium term, a rising rig count suggests operators are expanding drilling programmes, which should translate into higher production with a lag of approximately 4 to 12 weeks. However, the Frac Spread Count is a more timely leading indicator of near-term production additions, as it measures completion activity on wells that are closer to first oil than newly spudded drill sites.
How Does the Permian Basin Rig Count Compare to Other US Basins?
The Permian Basin accounts for 246 of the 415 active oil rigs, representing approximately 59% of all US oil-directed drilling activity, making it by far the dominant basin in American shale.
What Is the Baker Hughes Rig Count and How Often Is It Published?
Baker Hughes publishes its North American and international rig count data every Friday. The report is the industry's primary benchmark for tracking active drilling activity and has been published continuously since 1944, creating one of the longest and most consistent datasets in the energy sector.
Why Is the US Rig Count Below Last Year's Levels Despite High Oil Prices?
US producers have embraced capital discipline and operational efficiency as core strategic priorities following the investment excesses of the pre-2020 shale era. Rather than rapidly deploying rigs in response to price spikes, operators are maximising output from existing wells through efficiency improvements while maintaining shareholder return commitments through dividends and buybacks.
Key Takeaways: What the US Oil Rig Count Jump Signals for Energy Markets in 2026
Three Scenarios for US Rig Activity Over the Next 90 Days
The trajectory of US drilling activity over the coming quarter will depend heavily on how the Hormuz situation evolves:
| Scenario | Trigger Condition | Likely Rig Count Direction | Production Impact |
|---|---|---|---|
| Hormuz Remains Restricted | Ongoing geopolitical standoff | Gradual increase (+5 to +15 rigs/month) | Modest production lift in Q3 2026 |
| Hormuz Partially Reopens | Diplomatic resolution or partial transit restoration | Stabilisation or slight decline | Price moderation, reduced drilling incentive |
| Hormuz Fully Reopens | Full resumption of normal tanker traffic | Rig count pullback likely | Price correction, operators revert to capital discipline |
Why Efficiency, Not Rig Count, Is Now the Defining Metric of US Shale Competitiveness
The most important insight from the current data cycle is that the US oil rig count jumps amid rising crude prices story is fundamentally a secondary narrative. The primary story is that American shale has undergone a productivity revolution so profound that the industry can approach all-time production records with roughly half the drilling activity required just four years ago.
For investors and analysts monitoring the energy sector, this efficiency transformation demands a recalibration of analytical frameworks. The weekly Baker Hughes release remains valuable as a directional signal of operator sentiment and capital deployment intent, but it must now be read alongside frac spread counts, DUC inventory trends, lateral length data, and per-well productivity metrics to construct an accurate picture of where US production is headed.
The broader implication for global oil markets is equally significant. A US shale sector capable of generating near-record production with fewer rigs represents a structurally more resilient and flexible supply source than historical analysis would suggest — one that can respond to geopolitical disruptions through DUC activation and completion acceleration even when formal drilling programmes remain constrained by capital discipline. Understanding this dynamic is essential for anyone seeking to accurately model global supply balances in an era defined by both geopolitical volatility and technological transformation in the world's most productive oil patch.
For further context on US drilling activity and crude market dynamics, the original Baker Hughes rig count data and weekly market commentary are available at OilPrice.com.
Want to Capitalise on Major ASX Mineral Discoveries Before the Broader Market?
Discovery Alert's proprietary Discovery IQ model delivers real-time alerts on significant ASX mineral discoveries, instantly transforming complex geological data into actionable investment insights for both short-term traders and long-term investors — explore Discovery Alert's discoveries page to understand how historic finds have generated substantial market returns, then begin your 14-day free trial to secure a market-leading edge.