July 14, 2026
The Reserve Asset Calculus That Price Corrections Cannot Override
There is a category of financial decision-making that operates almost entirely outside the gravitational pull of short-term market pricing. Sovereign reserve management sits firmly in that category. When a government institution responsible for managing decades worth of national wealth evaluates its reserve composition, quarterly price charts carry far less weight than geopolitical exposure, currency concentration risk, and the multi-generational mandate to preserve purchasing power. Understanding this distinction is the starting point for interpreting one of the most analytically significant developments of 2026: central banks buying gold in volumes that accelerated precisely as prices fell to eight-month lows.
The gap between how institutional reserve managers and market participants respond to the same price signal reveals something fundamental about gold's dual identity. To a hedge fund or retail trader, a 14.1% quarterly price decline is a bearish event that triggers position reduction. To a sovereign reserve manager accumulating against a twenty-year mandate, that same decline represents an improved entry point into a strategic asset class that has just overtaken US Treasuries in global reserve composition for the first time in nearly three decades.
When big ASX news breaks, our subscribers know first
What a 14.1% Quarterly Decline Actually Tells Us
Gold recorded its steepest quarterly decline since 2013 between April and June 2026, falling 14.1% across the period. Spot prices briefly breached the psychologically significant $4,000 per ounce level on June 24, touching territory last visited in November 2025, before partially recovering to close the quarter at approximately $4,008.
For context, a drawdown of this magnitude had not occurred in over a decade. Yet the more instructive data point is not the price itself but the behaviour of the largest and most strategically motivated buyers in the gold market during that correction window. The gold and bond dynamics at play during this period underscore why these two forces often move in opposing directions during periods of monetary policy uncertainty.
The Two Macro Forces Behind the Decline
Two identifiable and interconnected macro forces drove real yields higher during Q2 2026, and higher real yields are the primary cyclical headwind for non-yielding assets like gold.
Force 1: Federal Reserve Policy Ambiguity
At its June 17, 2026 meeting, the Federal Reserve held its benchmark rate unchanged at 3.50-3.75%. What made this meeting unusual was the decision by Chair Kevin Warsh to withhold a dot-plot projection, making him the first Fed chair to do so since the tool was introduced in 2012. This was not a minor procedural detail. The dot plot had become one of the most widely referenced forward guidance mechanisms in financial markets. Removing it amplified uncertainty over the path of future interest rates at precisely the moment when 9 of 18 voting participants were projecting at least one additional rate hike before year-end.
The July 8 meeting minutes subsequently identified tariffs, elevated energy costs, and supply disruptions linked to the Strait of Hormuz as upside inflation risks, reinforcing expectations of a hawkish policy trajectory and keeping real yields elevated.
Force 2: Strait of Hormuz and the Oil Price Transmission Mechanism
A US-Iran ceasefire that had briefly stabilised energy markets collapsed in early July 2026 following attacks on commercial vessels transiting the Strait of Hormuz. US retaliatory strikes and a broader Iranian military response across the Gulf followed, pushing Brent crude toward $79 per barrel, its highest level since June 19. Tanker traffic through the strait slowed to near-standstill conditions.
The transmission pathway from energy disruption to gold weakness operates through a chain that is worth understanding explicitly:
- Higher oil prices elevate inflation expectations
- Elevated inflation expectations reinforce the case for tighter Federal Reserve policy
- Tighter policy expectations support higher nominal and real yields
- Higher real yields increase the opportunity cost of holding non-yielding gold
- Gold prices face downward pressure despite concurrent safe-haven demand
This mechanism explains why gold's rebound between July 8 and July 10 was constrained even as geopolitical risk intensified. Furthermore, the gold safe-haven dynamics that typically support prices during conflict were, on this occasion, offset by simultaneous yield pressure operating in the opposite direction.
Central Banks Buying Gold Through the Correction: Why This Changes the Analysis
The behaviour that separates this correction from a standard bear-market episode is the uninterrupted continuation of sovereign gold accumulation throughout the decline. This is not a subtle nuance; it is analytically decisive.
China's June 2026 Purchase and What It Signals
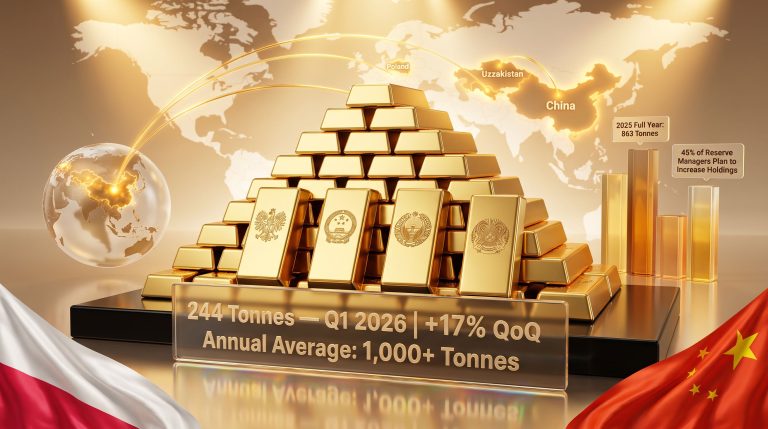
China's central bank added 15 tonnes of gold in June 2026, its largest single-month acquisition since October 2023, according to data published by the State Administration of Foreign Exchange. Critically, this purchase occurred while spot gold was trading near an eight-month low of approximately $4,002 per ounce. China's cumulative reserve position now stands at 2,346 tonnes, accumulated across more than 20 consecutive months of uninterrupted buying.
| Indicator | Data Point | Significance |
|---|---|---|
| China's June 2026 gold purchase | 15 tonnes | Largest single-month purchase since October 2023 |
| China's consecutive buying streak | 20+ months | Continued at an eight-month price low |
| China's total gold reserves | 2,346 tonnes | Reflects sustained long-term accumulation strategy |
| WGC survey: banks planning to increase reserves | 45% of 76 surveyed | Record high since survey inception in 2018 |
| WGC survey: banks expecting global holdings to rise | 89% | Near-unanimous directional consensus |
| Poland's April 2026 purchase | 14 tonnes | Largest single-month buyer globally in April |
| Global central bank net purchases, April 2026 | 19 metric tons | Return to meaningful net buying after subdued January |
The World Gold Council Survey: Forward Intentions at a Record High
The World Gold Council's 2026 Central Bank Gold Reserves Survey, published in June and covering 76 central banks, found that a record 45% of respondents plan to increase gold reserves over the next 12 months. That is the highest proportion recorded since the survey began in 2018. More striking still, 89% of respondents expect total global official gold holdings to rise across the same period. According to World Gold Council reserve data, the geographic distribution of this accumulation has shifted substantially toward emerging economies.
Reserve managers are not price-momentum investors. The record proportion planning to increase gold holdings, measured at a time when prices had already reached multi-year highs, confirms that sovereign accumulation decisions are driven by allocation mandates rather than price timing.
This forward-looking consensus has an important implication for anyone modelling the structural floor for gold demand. Even in a sustained price correction environment, official-sector purchasing behaviour appears highly resistant to price signals alone.
Gold Overtakes US Treasuries in Global Reserves for the First Time Since 1996
The European Central Bank's June 2026 review of the international role of the euro confirmed a reserve allocation milestone that carries implications well beyond a single quarterly report.
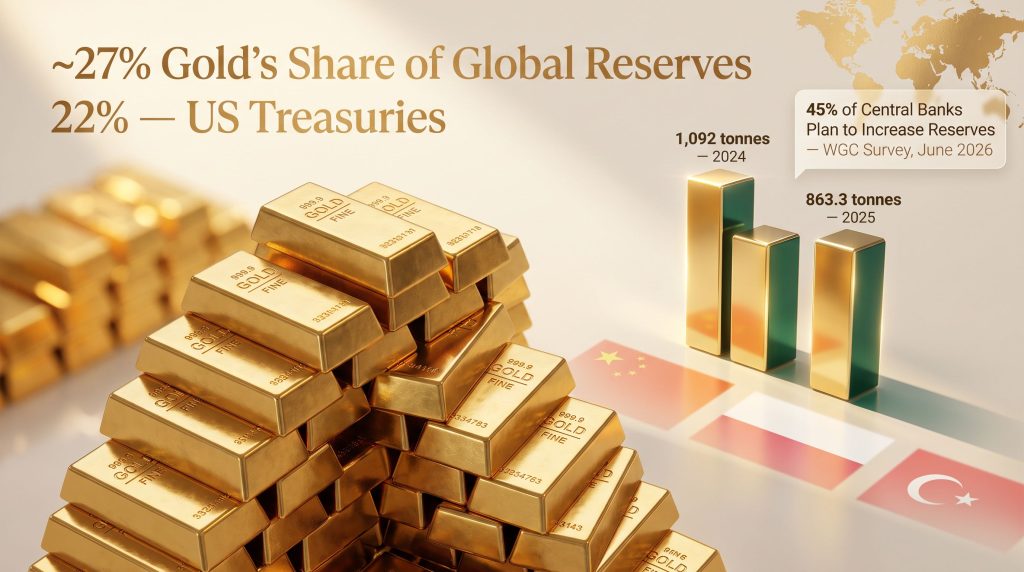
Gold's share of global reserve assets has risen to approximately 27%, up from around 20% at the end of 2024. Over the same period, the share held in US Treasuries declined from roughly 25% to 22%. The result is that gold now commands a larger portion of global reserves than US government debt, a configuration last observed in 1996.
Four Strategic Drivers Behind the Reallocation
| Driver | Explanation |
|---|---|
| Dollar Concentration Risk | Reserve managers are actively reducing exposure to a single currency, particularly given the dollar's use as a geopolitical instrument |
| Sanctions Insulation | Physical gold held domestically cannot be frozen, sanctioned, or defaulted upon by foreign governments |
| Inflation Store of Value | Gold's purchasing power preservation across long monetary cycles aligns with multi-decade reserve mandates |
| Crisis Performance Record | Approximately 90% of central banks cite gold's behaviour during systemic financial stress as a primary justification for holding it |
A pattern worth noting within this reallocation is the geographic distribution of accumulation. Traditional gold-heavy reserve holders such as the United States, Germany, and France have maintained broadly static positions. The accumulation wave is being driven by emerging and frontier economies, including China, Russia, Turkey, India, Poland, Kazakhstan, Bulgaria, and others across Eastern Europe and Central Asia.
An additional and frequently overlooked dimension of this shift is the growing preference for domestic custody. An increasing proportion of central banks are choosing to store gold within their own borders rather than relying on offshore custodians, reducing exposure to geopolitical risk embedded in the custody chain itself. Central bank gold reserves data confirms this structural development has accelerated meaningfully since 2022, representing a qualitative change in how sovereign institutions relate to their gold holdings.
How Development-Stage Gold Projects Are Designed to Withstand Price Volatility
Understanding why central banks keep buying gold during corrections is one analytical lens. A complementary lens examines how the development-stage mining sector is positioning project economics to remain viable across a range of gold price environments.
The Margin of Safety Framework in Feasibility Studies
The most defensible project economics are built on gold price assumptions that sit meaningfully below prevailing spot prices. This approach mirrors the margin of safety principle in value investing: the wider the gap between the assumed price and the current market price, the more resilient the project economics become under adverse conditions.
U.S. Gold Corp is advancing the fully permitted CK Gold Project in Wyoming using a definitive feasibility study anchored to a gold price assumption of $3,250 per ounce. At that base case, the study generates an after-tax net present value of approximately $630 million and an internal rate of return of around 30%, with copper contributing roughly 30% of project value. The fact that this base case sits well below even the corrected Q2 2026 spot price illustrates the extent of the economic buffer built into the study. U.S. Gold Corp's Executive Chairman Luke Norman has noted publicly that pushing the price assumption toward prevailing spot levels produces a substantial uplift in project valuation metrics.
| Gold Price Assumption | Project NPV Range | IRR Range | Sensitivity Risk |
|---|---|---|---|
| Conservative (~$3,250/oz) | Moderate but defensible | ~25-35% | Low – economics hold in corrections |
| Spot-price aligned (~$4,000+/oz) | High | 40%+ | Moderate – sensitive to pullbacks |
| Aggressive (above spot) | Very high | 50%+ | High – economics break in corrections |
Not all projects carry the same cost structure, and operating cost differences create significant divergence in price sensitivity. Hycroft Mining Holding Corporation's June 2026 independent economic study for its Nevada project estimated total costs of just over $2,100 per gold-equivalent ounce, placing project economics in a higher sensitivity band relative to lower-cost operations. Even so, the study estimated an after-tax net present value of $4.3 billion at base-case metal prices, rising to $10.0 billion under spot-price assumptions.
Near-Term Production as a Structural Hedge Against Price Risk
Cabral Gold's Cuiú Cuiú heap-leach project in Brazil illustrates a different form of price resilience: operational proximity. The project was more than 70% constructed as of April 2026, with financing already secured and commercial production targeted for Q4 2026. The short timeline to cash flow generation reduces the project's dependence on gold prices remaining elevated over a multi-year development horizon. Cabral's President and CEO Alan Carter has stated publicly that the project retains a healthy operating margin at current gold prices, with expected production returns of approximately $3,000 per ounce of gold produced.
Permitting, Resources, and Multi-Commodity Exposure as Independent Value Drivers
Price-independent catalysts play an underappreciated role in development-stage valuations. New Found Gold's Queensway project in Newfoundland received a decision letter on July 3, 2026 requiring an Environmental Preview Report before advancing through the provincial environmental review process. This outcome extended the timeline to a construction decision by approximately six to nine months under the province's published regulatory calendar, illustrating how permitting milestones can be the primary driver of project value in periods where gold prices are temporarily suppressed.
Resource estimate evolution presents another layer of complexity. Tudor Gold's Goldstorm deposit within British Columbia's Golden Triangle has undergone significant recalculations over successive study cycles, moving from approximately 15 million gold-equivalent ounces in 2021 to approximately 28 million ounces on an open-pit basis in 2024, before being recalculated to approximately 25 million ounces of gold alone on an underground basis in 2025. These movements reflect changes in mining method assumptions and reporting conventions as much as they reflect new geological data, a distinction that investors in development-stage assets need to interpret carefully.
P2 Gold's Gabbs copper-gold porphyry project in Nevada offers commodity diversification within a single asset, providing exposure to both the sovereign reserve-driven gold market and the industrially driven copper market. Management is advancing optimisation work ahead of a feasibility study, targeting annual throughput of 12 million tonnes, up from 9 million in the preliminary economic assessment, while also working to accelerate mill start-up from year six to year three of operations. CEO Joseph Ovsenek has indicated publicly that a resource estimate update is targeted by the end of the northern summer of 2026, which will feed directly into the feasibility study timeline.
A similar multi-commodity profile is being advanced by Cobra Resources through its Manna Hill project in South Australia, where reverse-circulation drilling at the Blue Rose prospect returned intercepts of up to 74 metres grading 1.02% copper and 0.25 grams per tonne gold, prompting a follow-up six-hole, 1,800-metre diamond drilling program launched in June 2026. The program is designed to test for a larger porphyry system at depth, a geological target with the potential to materially expand the project's resource base.
The Macro Indicators That Will Shape Gold's Near-Term Trajectory
Understanding the structural case for gold through sovereign accumulation data does not eliminate the need to track the cyclical forces that drive quarterly price behaviour. Several specific indicators will determine whether the Q2 2026 correction extends or reverses.
Bearish near-term factors to monitor:
- Core US CPI has trended upward across three consecutive months: 2.6% in March, 2.8% in April, and 2.9% in May 2026
- If this trajectory continues, expectations of a rate hike at the July 28-29 Fed meeting will intensify
- A temporary decline in headline inflation driven by gasoline price relief following the ceasefire may obscure core inflation dynamics, which carry greater weight for monetary policy decisions
- Higher real yields extend the opportunity cost argument against gold, regardless of geopolitical conditions
Structural support factors that remain intact:
- Central banks buying gold at an eight-month price low confirms that official-sector demand operates on a different decision-making framework
- Gold's share of global reserve assets has exceeded US Treasuries for the first time since 1996, a milestone driven by deliberate policy reallocation rather than price appreciation alone
- Record survey intentions across 76 sovereign institutions indicate sustained forward buying that is highly insensitive to price levels
- The 2022-2024 era averaged over 1,000 tonnes of annual central bank purchases, a historically unprecedented level that established a new structural baseline for official-sector demand
The role of central banks influencing gold prices through sustained accumulation cannot be overstated in any comprehensive assessment of these structural support factors. Furthermore, the central bank gold demand data from recent quarters reinforces the view that sovereign purchasing represents a durable, non-cyclical force within the broader gold market. According to Brookings Institution analysis, the strategic importance of central bank gold holdings continues to grow within global monetary frameworks.
Disclaimer: This article contains forward-looking statements, forecasts, and analytical interpretations that involve uncertainty. Commodity prices, central bank policy decisions, and geopolitical developments are subject to rapid change. Nothing in this article should be construed as financial advice. Investors should conduct independent due diligence before making any investment decisions.
The next major ASX story will hit our subscribers first
Key Data Summary: Central Bank Gold Demand in 2026
| Metric | Figure | Context |
|---|---|---|
| Q2 2026 gold price decline | -14.1% | Worst quarterly performance since 2013 |
| Gold spot price on June 24, 2026 | Below $4,000/oz | First time below that level since November 2025 |
| Gold's share of global reserves | ~27% | Exceeds US Treasuries (22%) for first time since 1996 |
| Central banks planning reserve increases | 45% | Record high in WGC survey history since 2018 |
| Global banks expecting holdings to rise | 89% | Near-unanimous directional consensus |
| China's June 2026 purchase | 15 tonnes | Largest monthly buy since October 2023 |
| China's total reserves | 2,346 tonnes | After 20+ consecutive months of buying |
| Poland's April 2026 purchase | 14 tonnes | Largest single-month buyer globally in April |
| Global central bank net purchases April 2026 | 19 metric tons | Recovery from 5 tonnes in January |
| 2025 global central bank purchases | 863.3 tonnes | Approximately 20% below 2024 but above pre-2022 averages |
| 2022-2024 average annual purchases | 1,000+ tonnes | Historically unprecedented accumulation era |
| Fed rate at June 17, 2026 meeting | 3.50-3.75% | Held unchanged; dot-plot withheld |
Frequently Asked Questions: Central Banks Buying Gold
Why do central banks keep buying gold even when prices fall?
Sovereign reserve managers operate on multi-year mandates that prioritise strategic diversification, geopolitical risk management, and purchasing power preservation over quarterly price signals. When prices fall, the opportunity cost of adding to reserves decreases rather than increases from their perspective, which is precisely the opposite of how market participants typically respond. China's largest monthly purchase in over two years occurred while gold was trading near an eight-month low, illustrating this framework in practice.
Which central banks bought the most gold in 2026?
China has been the most consistent buyer over the longest continuous window, with more than 20 consecutive months of reserve additions totalling 2,346 tonnes cumulatively. Poland was the single largest buyer in April 2026, adding 14 tonnes in that month alone. Eastern European and Asian central banks have collectively maintained average monthly purchase volumes of 12 and 11 tonnes respectively over the prior 36-month period.
Is gold now more important than US Treasuries in global reserves?
According to the European Central Bank's June 2026 review, gold accounts for approximately 27% of global reserve assets compared to 22% for US Treasuries, marking the first such inversion since 1996. The ECB attributes the shift to a combination of gold price appreciation and deliberate diversification away from dollar-denominated instruments by reserve managers globally.
What percentage of central banks plan to increase gold holdings?
The World Gold Council's June 2026 survey of 76 central banks found that a record 45% intend to increase gold reserves over the next 12 months, while 89% expect total global official holdings to rise over the same period. Both figures represent the highest readings since the survey began in 2018.
How much gold did central banks buy globally in 2025?
Global central banks added a net 863.3 metric tons in 2025, approximately 20% below the 1,092 tonnes purchased in 2024. However, 2024 was itself a near-record year, and the 2025 figure remains substantially above the pre-2022 historical average. The 2022-2024 period averaged over 1,000 tonnes annually, establishing a new structural baseline for official-sector accumulation. The Conversation's analysis of gold holdings provides further context for understanding why these figures represent a 50-year high in sovereign gold accumulation.
What is the connection between real yields and gold prices?
Real yields represent the opportunity cost of holding gold, which generates no income. When real yields rise, as they did in Q2 2026 through a combination of Fed policy hawkishness and energy-price-driven inflation expectations, the relative attractiveness of gold declines and prices face downward pressure. This relationship is cyclical and well-documented, but it does not alter the structural reserve allocation trends that drive sovereign gold accumulation over longer time horizons.
Want to Know Which ASX Gold Discoveries Are Happening Right Now?
Discovery Alert's proprietary Discovery IQ model delivers real-time alerts on significant ASX mineral discoveries, cutting through the noise to identify actionable opportunities the moment they are announced — explore historic discoveries and their remarkable returns to see what early positioning in major finds can mean, then begin your 14-day free trial at Discovery Alert to ensure you never miss the next significant move in the gold market.