
July 31, 2026
The Hidden Architecture of Global Copper Supply
Every tonne of copper extracted from the Atacama Desert carries weight far beyond its physical mass. The metal underpins the electrification of modern economies, from grid infrastructure and electric vehicle drivetrains to industrial motors and telecommunications networks. Yet the supply chain feeding this demand is remarkably concentrated. A single nation, Chile, accounts for roughly 26 to 28 percent of global copper mine output, meaning that fluctuations in its monthly production data send ripple effects through futures markets, long-term supply contracts, and downstream manufacturing schedules worldwide.
Understanding what Chile's June 2026 copper production data actually reveals requires more than reading a single headline figure. The story is layered, sometimes contradictory across reporting agencies, and rich with structural implications for the copper market in the years ahead. Furthermore, the copper supply crunch facing global markets makes this data particularly consequential.
When big ASX news breaks, our subscribers know first
Chile Copper Output Rises in June: What the Headline Figure Actually Means
Chile copper output rises in June 2026, with the national statistics agency INE confirming that production rose 5.1% year-on-year, reaching 447,294 metric tons. On the surface, this is an encouraging result for a market that has faced persistent supply-side anxiety. However, the national aggregate figure masks significant divergence at the individual mine level, and treating the headline as a uniform signal would be a fundamental analytical error.
Chile operates two distinct reporting frameworks for copper production. INE publishes aggregate national output, while Cochilco, the Chilean Copper Commission, tracks production at the company and mine level. These frameworks can produce figures that appear contradictory when read in isolation.
Reconciling the National Figure Against Mine-Level Performance
| Data Source | Reported Figure | Year-on-Year Change |
|---|---|---|
| INE (National Aggregate) | 447,294 metric tons | +5.1% YoY |
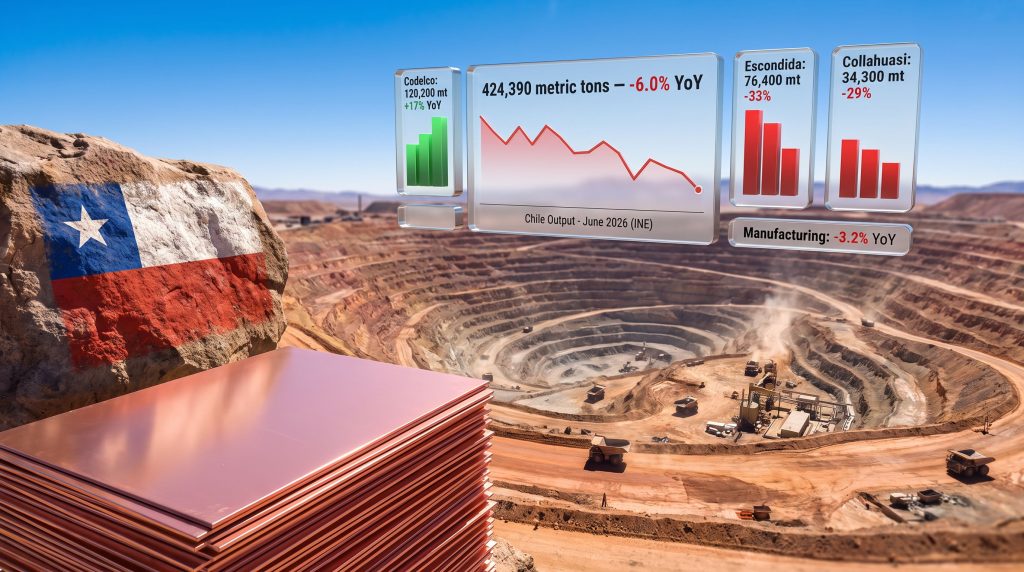
| Cochilco (Codelco output) | ~120,200 metric tons | +17.0% YoY |
| Escondida (Cochilco data) | ~76,400 metric tons | -33.0% YoY |
| Collahuasi (Cochilco data) | ~34,300 metric tons | -29.0% YoY |
Data Integrity Note: Discrepancies exist across sources for individual mine figures. Alternative Cochilco release versions have cited Escondida at approximately 105,800 tonnes and Codelco at approximately 131,900 tonnes. Investors and analysts should cross-reference primary INE and Cochilco releases before drawing firm conclusions.
The national-level increase does not mean all of Chile's copper infrastructure is performing well. It means aggregate tonnage is up, driven in meaningful part by Codelco's operational recovery, while two of the largest privately operated mines in the world recorded severe single-month contractions. According to Chile's biggest copper output this year, this June figure represents the strongest monthly result in a tight global market.
Breaking Down Performance at Chile's Major Copper Mines
Codelco: State-Owned Recovery Driving the Aggregate Gain
Codelco production recovery has been a defining story in Chilean copper this year. The state-owned giant reported June output of approximately 120,200 metric tons, a 17% year-on-year increase. This recovery is structurally significant because Codelco spent several years contending with declining ore grades at its mature operations, deferred maintenance backlogs, and cost overruns at its major underground expansion projects.
The improvement reflects the early-stage payoff from a multi-billion dollar modernisation programme, which includes the underground transition at Chuquicamata and deep-level development at El Teniente, the world's largest underground copper mine. These projects have faced delays and capital intensity challenges, but their contribution to output recovery is beginning to materialise.
What makes Codelco's trajectory particularly important is its strategic dimension. As a state asset, its production performance directly affects Chilean government revenues and the country's fiscal capacity. Sustained output improvement at Codelco would provide Chile with considerably more flexibility in managing its copper royalty and taxation reform agenda.
Escondida: The World's Largest Copper Mine Posts a Sharp Contraction
Escondida's June production of approximately 76,400 metric tons represented a 33% year-on-year decline, a contraction of significant magnitude for any mining asset, let alone the single largest copper mine on Earth. Operated by BHP with minority stakes held by Rio Tinto and JECO Corporation, Escondida contributes a disproportionately large share of both Chilean and global copper supply.
Sharp single-month contractions at Escondida are not unprecedented and can be driven by several intersecting factors:
- Ore grade variability: Open-pit operations cycle through higher and lower grade ore zones as mining progresses through the deposit. A shift to lower-grade material can reduce recoverable copper tonnes without any change in ore volume processed.
- Planned maintenance windows: Concentrator and processing plant shutdowns for scheduled maintenance create predictable but sharp output dips that distort year-on-year comparisons.
- Water access constraints: Escondida operates in one of the driest environments on Earth. The mine has invested heavily in desalination infrastructure, but water availability and energy costs tied to desalination can influence processing throughput.
- Mine sequencing decisions: Stripping campaigns and pit development phases periodically reduce ore access, temporarily compressing output.
Collahuasi: A Tier-One Asset Under Production Pressure
Collahuasi, the joint venture between Glencore and Anglo American situated at approximately 4,500 metres above sea level in northern Chile, produced approximately 34,300 metric tons in June, representing a 29% year-on-year decline. As one of the largest copper porphyry deposits in the world, Collahuasi's output compression is a meaningful signal for market watchers.
High-altitude operations face distinct operational challenges, including reduced equipment efficiency, workforce acclimatisation logistics, and elevated energy consumption. Combined with the ore grade depletion dynamic affecting virtually all of Chile's mature porphyry copper deposits, Collahuasi's performance reflects both operational and geological headwinds.
Geological Context: Copper porphyry deposits, which host the majority of Chile's copper resources, are characterised by large tonnages but progressively declining average ore grades as surface and near-surface high-grade material is exhausted. This structural grade decline is an industry-wide phenomenon, not specific to any single operator.
Chile's Manufacturing Sector: A Secondary Signal Worth Tracking
Alongside copper production data, INE reported that Chilean manufacturing output declined 3.2% year-on-year in June 2026. This figure is notable for two reasons. First, economists polled by Reuters had anticipated a considerably steeper contraction of approximately 6%, meaning the actual result represented a meaningful positive surprise. Second, manufacturing performance provides a window into Chile's domestic industrial economy, which is intertwined with mining activity through equipment supply chains, energy demand, and labour markets.
The relationship between copper mining and manufacturing in Chile is bidirectional. Mining drives significant demand for locally manufactured industrial inputs, while a deteriorating manufacturing base can signal broader competitiveness challenges for the Chilean economy. Currency dynamics add another layer of complexity: a weaker Chilean peso improves the export revenue position of copper miners but raises costs for import-dependent manufacturers.
What Chile's June Data Means for Global Copper Markets
Chile's copper supply role as the dominant copper-producing nation means that its monthly output data functions as a leading indicator for global copper market tightness. The downstream industries most sensitive to Chilean supply conditions include:
- Electric vehicle battery and drivetrain manufacturing, where copper intensity per vehicle is substantially higher than for internal combustion alternatives
- Grid infrastructure buildout, where copper demand is accelerating in line with electrification investment across North America, Europe, and Asia
- Semiconductor and electronics production, where copper interconnects are essential
- Industrial machinery and construction, particularly in emerging markets undergoing rapid urbanisation
How Chile Compares Against Other Major Copper Producers
| Producer Nation | Approximate Global Share | June 2026 Trend |
|---|---|---|
| Chile | ~26-28% | National output +5.1% YoY |
| Peru | ~10-12% | Data pending confirmation |
| Democratic Republic of Congo | ~10-11% | Data pending confirmation |
| Australia | ~5-6% | Data pending confirmation |
| China (domestic) | ~8-9% | Data pending confirmation |
Peru's concurrent output trajectory is particularly critical context. Should Peru and Chile both record strong output simultaneously, global supply tightness concerns ease considerably. Conversely, divergent national performances create asymmetric price pressure in futures markets. Secondary copper supply, primarily through scrap recycling, provides a partial buffer against primary mine shortfalls but cannot substitute for large-volume primary output at current recycling infrastructure scales.
In addition, understanding the copper price drivers shaping market sentiment helps contextualise why Chile's monthly data attracts such intensive analyst scrutiny.
The Structural Forces Reshaping Chile's Long-Term Copper Capacity
Ore Grade Decline: The Industry's Slow-Moving Crisis
Perhaps the most consequential and least discussed dynamic in Chilean copper is the long-term structural decline in ore grades across the country's porphyry copper deposits. Average ore grades at major Chilean mines have fallen significantly over the past two decades, meaning miners must process substantially more rock to produce the same quantity of refined copper. This increases energy consumption, water usage, processing costs, and carbon emissions per tonne of output simultaneously.
This trend is not reversible through capital expenditure alone. It reflects the fundamental geology of deposits that have been mined for decades. New discoveries and resource extensions can partially offset grade decline but rarely at the scale required to compensate for depletion at operations like Escondida or Collahuasi. Furthermore, according to Chile copper production data, this structural challenge will continue to define output trajectories well beyond the current decade.
Water Scarcity and Renewable Energy Transition
The Atacama Desert, which hosts a disproportionate share of Chile's copper resources, is one of the driest places on Earth. Mining operations in this region depend on either continental water sources, which are increasingly subject to regulatory restrictions to protect ecosystems and indigenous communities, or desalinated seawater pumped from the Pacific coast. Desalination solves the water availability problem but introduces enormous energy demands and significant capital costs.
Chile's mining sector is simultaneously under pressure to decarbonise its energy supply, with government policy frameworks encouraging a shift to solar and wind energy. The Atacama's solar irradiance levels make this transition technically feasible, but the capital investment required and the intermittency management challenges are substantial.
Fiscal Reform and Investor Confidence
Chile's ongoing copper royalty and taxation reform debate continues to influence operator investment decisions. Higher royalty rates improve state revenue capture but compress the economic returns available to private operators, potentially discouraging new greenfield investment and expansion capital at existing operations. Consequently, the Chile copper price outlook remains tied not only to supply volumes but also to the stability and predictability of the country's fiscal and regulatory environment.
This tension between fiscal maximisation and long-term production capacity maintenance is one of the defining policy challenges facing Chilean copper governance.
The next major ASX story will hit our subscribers first
Frequently Asked Questions: Chile Copper Output June 2026
What was Chile's total copper production in June 2026?
Chile's national statistics agency INE reported total copper output of 447,294 metric tons in June 2026, representing a 5.1% year-on-year increase.
Did Codelco's production increase in June 2026?
Yes. Cochilco data indicated Codelco's June 2026 output reached approximately 120,200 metric tons, a 17% year-on-year increase, reflecting the early benefits of the company's ongoing capital reinvestment and underground expansion programme.
Why did Escondida's copper output fall so sharply in June 2026?
Escondida's output declined approximately 33% year-on-year. Factors typically driving such contractions include ore grade variability, planned maintenance shutdowns, water access constraints, and mine sequencing decisions within quarterly operational plans.
What happened to Chile's manufacturing sector in June 2026?
Manufacturing production fell 3.2% year-on-year in June 2026, a meaningfully smaller contraction than the 6% decline economists had forecast, suggesting some resilience in Chile's industrial base.
Why do different sources report different Chilean copper production figures?
INE reports aggregate national production while Cochilco tracks individual mine and company-level output. Reporting lags, methodology differences, and revision cycles create apparent discrepancies between data releases that require careful cross-referencing.
How does Chile's copper output affect global copper prices?
As the world's largest copper producer, Chile's monthly output data directly influences global supply forecasts. Significant year-on-year movements can tighten or loosen market balances and exert corresponding pressure on copper futures prices, particularly when demand from electrification and grid infrastructure sectors remains elevated.
Key Takeaways: Reading Chile's June 2026 Copper Data With Analytical Precision
- National output rose 5.1% YoY to 447,294 metric tons in June 2026, a positive headline driven significantly by Codelco's recovery
- Codelco's 17% output increase reflects operational and capital programme benefits at the state producer, with strategic implications for Chile's production trajectory
- Escondida and Collahuasi posted severe contractions of approximately 33% and 29% respectively, highlighting concentration risk within Chilean copper supply
- Manufacturing production fell 3.2%, considerably less than the 6% decline forecast, providing a modest positive signal for Chile's broader economy
- Data reconciliation between INE and Cochilco sources remains essential before drawing definitive analytical or investment conclusions
- Structural headwinds including ore grade decline, water scarcity, energy transition costs, and fiscal reform uncertainty continue to shape Chile's medium and long-term production capacity
This article is intended for informational purposes only and does not constitute financial advice or a solicitation to trade commodities or securities. Production figures, forecasts, and market projections involve uncertainty and may be subject to revision. Readers seeking primary data should consult official releases from Chile's National Statistics Institute (INE) and the Chilean Copper Commission (Cochilco). Additional commodity market context is available at Reuters.com.
Want To Be First When the Next Major Copper Discovery Hits the ASX?
Discovery Alert's proprietary Discovery IQ model scans ASX announcements in real time, delivering instant alerts on significant mineral discoveries — including copper — so subscribers can act ahead of the broader market. Explore historic discovery returns that demonstrate just how transformative early positioning can be, and start your 14-day free trial at Discovery Alert today.