August 6, 2026
The Industrial Logic Behind a Manufacturing Imbalance With No Modern Parallel
When a single nation builds enough production capacity to supply an entire planet's worth of a strategically critical technology, the implications extend far beyond conventional economics. Battery manufacturing has reached exactly this inflection point. Understanding how this happened, what it means for energy security, and where the global industry goes from here requires moving beyond headline figures and examining the structural mechanics that created one of the most concentrated industrial positions in modern history.
The starting point is not a single policy decision or investment cycle. It is the compounding result of decades of state-coordinated industrial development, vertical supply chain integration, and a feedback loop in which cost advantages reinforced market share gains, which in turn justified further capacity investment. The result is a situation where China battery manufacturing capacity exceeds global demand projections, and where OECD economies now face a strategic reckoning about how to respond.
When big ASX news breaks, our subscribers know first
Quantifying the Gap: What Structural Overcapacity Actually Looks Like
Not all overcapacity is created equal. Cyclical oversupply occurs when demand temporarily lags investment, corrects within a few years, and normalises pricing. Structural overcapacity is different: it reflects a persistent, policy-reinforced mismatch between installed capacity and achievable demand that reshapes global pricing for an extended period.
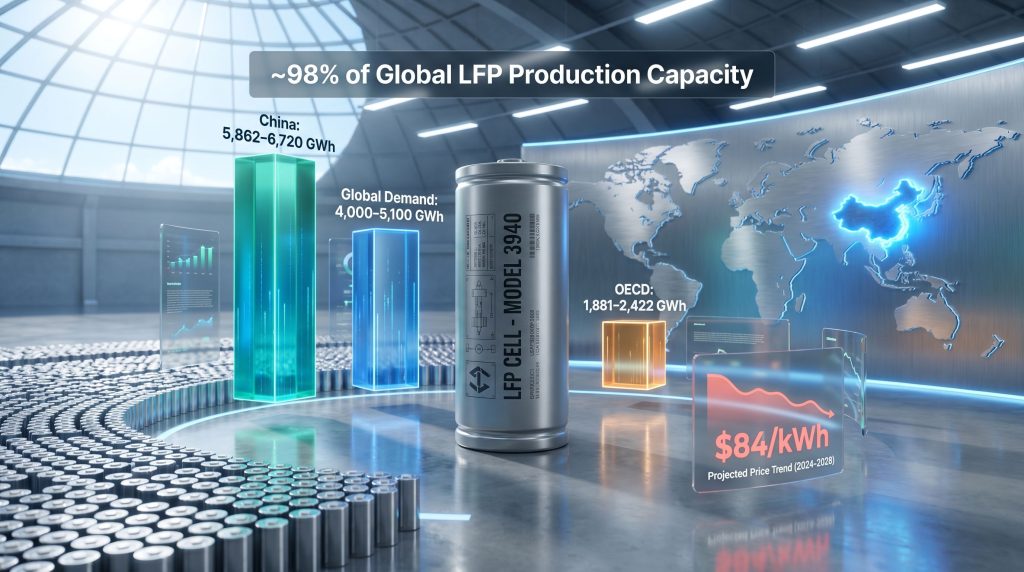
According to a 2026 report from the Carnegie Endowment for International Peace, China's projected battery cell manufacturing capacity by 2030 sits between 5,862 GWh and 6,720 GWh. Against a global demand forecast of 4,000 GWh to 5,100 GWh, the implied surplus is not marginal. It is potentially larger than the entire installed capacity of every other region on earth combined.
BloombergNEF tracking of announced capacity figures puts the total at approximately 7.9 TWh, though announced figures consistently exceed realisable output due to project delays, capital constraints, and utilisation challenges. Even applying significant haircuts to the headline numbers, the structural imbalance remains pronounced.
China's 2024 lithium-ion production capacity alone already exceeded 2 TWh, representing roughly 60% above total global battery demand for that year. This is not a future projection. It is a present reality.
Regional Capacity Comparison: 2030 Projections
| Region | Projected 2030 Capacity (GWh) | Global Share |
|---|---|---|
| China | 5,862 – 6,720 | ~69–75% |
| OECD Economies | 1,881 – 2,422 | ~20–25% |
| Emerging Markets (India, Indonesia, etc.) | ~217 | ~2–3% |
| Rest of World | Remainder | <5% |
A critical and often overlooked detail: OECD capacity, even at its maximum projected build-out of 2,422 GWh, would still fall short of projected global demand on its own. Consequently, even in scenarios where OECD economies successfully accelerate domestic manufacturing, full supply chain independence remains mathematically impossible before the mid-2030s at the earliest.
How China Built an Unassailable Cost Position
The cost differential between Chinese-manufactured cells and locally produced alternatives in Western markets is not a temporary pricing anomaly. It reflects structural advantages that have been compounding for over a decade. Furthermore, the dynamics shaping the global lithium market have only reinforced China's dominant position throughout this period.
The Carnegie Endowment report documents a 10% to 27% price gap for Chinese-made NMC (nickel manganese cobalt) cells compared to European alternatives, and a far wider 24% to 50% discount for LFP (lithium iron phosphate) cells. These are not spot-price fluctuations. They represent embedded cost advantages derived from:
- Vertical integration extending from raw material processing through cell assembly to module production
- Decades of process optimisation investment at gigafactory scale
- Proximity to the world's most cost-competitive lithium, graphite, and manganese processing infrastructure
- Automation deployment rates that outpace most Western manufacturing equivalents
- Subsidised financing structures that reduce the capital cost burden on Chinese producers
By 2025, Chinese battery exports were exceeding $6 billion per month, with European markets absorbing nearly half of all outbound shipments. Estimated Chinese operating capacity was running at approximately four times current demand, which has established a global price floor around $84/kWh. Below this level, even Chinese manufacturers face margin compression, providing a natural floor that has profound implications for BESS project economics worldwide.
The Utilisation Rate Dynamic: A Hidden Deflationary Engine
One underappreciated dimension of the overcapacity problem is what happens when plants operate below full capacity. Chinese manufacturers facing utilisation rate pressure have consistently used price reductions as a lever to stimulate volume, creating a deflationary pricing spiral in global cell markets.
This has a paradoxical effect on Western energy transition goals: lower battery prices accelerate renewable energy storage deployment, however they simultaneously undermine the economic case for building domestic manufacturing capacity outside China. The short-term benefit and the long-term vulnerability are structurally linked.
Chemistry-Level Risk: Where Supply Chain Concentration Is Most Dangerous
The aggregate capacity figures tell one story. The chemistry-level breakdown tells a more alarming one.
LFP: The Dominant Chemistry With Near-Total Geographic Concentration
LFP batteries now account for approximately half of the global lithium-ion battery market, driven by EV adoption and the rapid battery storage expansion into utility-scale applications. LFP's thermal stability, long cycle life, and relatively low raw material cost have made it the chemistry of choice for stationary storage applications globally.
Approximately 98% of global LFP production capacity is currently located within China. For energy security planners in the US, EU, Japan, and South Korea, this represents the single most acute supply chain concentration risk in the entire energy transition.
This level of geographic concentration has no close parallel in modern industrial history for a technology of comparable strategic importance. Oil supply concentration, by comparison, involves dozens of producing nations. LFP production is effectively a single-nation dependency.
Sodium-Ion: A Potential Repeat of the LFP Pattern
Sodium-ion batteries are attracting significant attention as a potential alternative to LFP for stationary storage applications. Their key advantages include the absence of lithium in the active chemistry, lower thermal risk profiles, and the availability of sodium as a near-universally distributed resource.
However, commercial-scale sodium-ion manufacturing is currently concentrated almost entirely within China. The trajectory here mirrors LFP's consolidation pattern in the mid-2010s, when Chinese producers rapidly scaled production ahead of international competitors and established a cost position that proved essentially impossible to replicate at comparable economics.
If OECD industrial policy does not intervene early in the sodium-ion scaling cycle, the chemistry could consolidate into the same geographic dependency pattern that now characterises LFP. OECD economies currently retain stronger competitive positions in silicon-anode and lithium-metal next-generation technologies, but these are still at pre-commercial scale.
How Chemistry Shifts Reshape Critical Mineral Demand
Battery chemistry transitions do not just affect manufacturers. They restructure entire upstream mineral supply chains, with significant consequences for critical minerals demand across producing nations. The Carnegie Endowment analysis projects that wider adoption of sodium-ion and lithium-metal technologies could, by 2035, produce the following demand shifts:
| Mineral | Projected Demand Impact by 2035 |
|---|---|
| Graphite | Down approximately 25.6% |
| Cobalt | Down approximately 8.7% |
| Lithium | Up approximately 5.4% |
For lithium-producing nations, including Australia, this represents a structural tailwind. For graphite producers, the picture is more challenging, particularly given that China controls the majority of global synthetic and natural graphite processing capacity.
The Demand Engine: What Is Actually Consuming These Batteries
Electric Vehicles and the Primary Consumption Pathway
EV adoption remains the largest single driver of battery demand growth. China leads both in production volume and domestic consumption, creating a self-reinforcing dynamic where domestic demand partially absorbs manufacturing output even as export volumes surge.
European and North American EV adoption rates, while growing, lag China's trajectory. This regional demand asymmetry means that Chinese manufacturers are simultaneously supplying the fastest-growing domestic market on earth while exporting aggressively to markets where local production alternatives are limited.
Stationary Storage: The Fastest-Growing Demand Category
The scale of China's stationary energy storage build-out is frequently underappreciated outside specialist circles. Chinese battery manufacturers added over 600 GWh of ESS-focused capacity in early 2026 alone. Total Chinese annual ESS output reached approximately 900 GWh, which is roughly ten times the 58 GWh installed across the entire United States in 2025.
This is not simply a manufacturing story. It reflects the pace at which China is deploying renewable generation capacity and the grid stabilisation requirements that accompany it. In addition, the battery raw materials ecosystem underpinning this growth continues to evolve rapidly, with upstream supply chains adapting to shifting chemistry preferences.
Data Centers as an Underappreciated Battery Demand Catalyst
One of the less discussed structural tailwinds for battery storage demand is the rapid expansion of data centre infrastructure globally. The electricity intensity of AI compute, cloud infrastructure, and digital services is creating baseload demand growth that grid operators increasingly manage through battery-based frequency regulation and backup systems.
As data centre density increases in the US, Europe, and Asia-Pacific, the requirement for grid-scale BESS as a reliability backstop grows proportionally. This creates a durable, long-duration demand signal for battery storage that extends well beyond the EV adoption curve and reinforces the strategic importance of resolving supply chain dependencies.
Strategic Response Architecture: What OECD Economies Can Realistically Do
Full decoupling from Chinese battery supply chains within a five-year horizon is not economically viable. The capacity arithmetic simply does not support it, and attempting rapid disengagement risks delaying the energy transition itself.
The Carnegie Endowment's recommended framework centres on selective cooperation rather than blanket decoupling. This involves engaging Chinese manufacturers through joint ventures and industrial partnerships in segments where no viable alternative supplier exists, while simultaneously investing in domestic capacity and next-generation technologies where OECD economies hold genuine advantages.
Furthermore, innovations such as the Chinese battery recycling breakthrough of 2025 demonstrate that China battery manufacturing capacity exceeds global demand not only in production but in the circularity of its supply chain ecosystem. A coordinated OECD industrial policy response would need to address several dimensions simultaneously:
- Harmonised capacity incentive frameworks to prevent intra-OECD competition from fragmenting manufacturing investment across too many sub-scale facilities
- Targeted support for sodium-ion manufacturers outside China, intervening in the consolidation cycle before geographic concentration replicates the LFP pattern
- Manufacturing efficiency investment deploying automation, digital twin technology, and AI-driven process optimisation to close the cost gap with Chinese producers
- Joint venture governance standards that enable selective cooperation without creating technology transfer exposure
- Demand aggregation mechanisms coordinating procurement across OECD buyers to provide demand certainty for non-Chinese manufacturers and reduce project risk premiums
The next major ASX story will hit our subscribers first
Scenario Modelling: Three Futures for the Global Battery Market by 2030
Scenario 1: Managed Interdependence (Base Case)
Selective cooperation frameworks take hold. OECD capacity grows toward the 2,422 GWh maximum build-out trajectory. Chinese overcapacity continues suppressing global cell prices, which accelerates energy storage deployment rates globally. Supply chain vulnerability persists in LFP and sodium-ion but is managed through governance frameworks rather than market separation.
Scenario 2: Accelerated Decoupling (Stress Case)
Tariff escalation and geopolitical tension force rapid supply chain restructuring. OECD manufacturing investment surges but cannot close the capacity gap before 2032 to 2035. Battery prices in non-Chinese markets rise 15% to 30%. Energy transition timelines are delayed in Europe and North America as project economics deteriorate.
Scenario 3: Technology Leapfrog (Optimistic Case)
OECD economies achieve commercial-scale deployment of silicon-anode and lithium-metal technologies ahead of Chinese manufacturers, reducing dependence on LFP supply chains through chemistry substitution. Sodium-ion manufacturing diversifies globally as coordinated policy support takes effect before 2028.
Frequently Asked Questions
Why does China battery manufacturing capacity exceed global demand?
State-directed capital allocation, subsidised financing, and vertical supply chain integration enabled Chinese manufacturers to expand at a pace that outstripped global demand growth. The feedback loop of cost leadership, market share gains, and further investment justification created a self-reinforcing expansion cycle with no equivalent in the energy sector.
What is the LFP battery supply chain concentration risk?
Approximately 98% of global LFP production capacity sits within China. For utilities, grid operators, and energy storage developers in OECD economies, this means that LFP-based storage systems are effectively sourced from a single national supply chain, creating both price exposure and geopolitical risk.
Can OECD economies build enough capacity to reduce dependence on China before 2030?
At maximum projected build-out, OECD capacity reaches approximately 2,422 GWh by 2030, which is still insufficient to independently meet projected global demand. Meaningful reduction in Chinese supply chain dependence requires both capacity investment and selective cooperation rather than unilateral decoupling. The IEA has noted that the battery industry has fundamentally shifted into a new phase, one in which geographic concentration and policy responses are now central to market outcomes.
How does Chinese overcapacity affect global battery prices?
Operating at approximately four times current demand, Chinese manufacturers have established a global price floor near $84/kWh. Utilisation-rate pressure drives ongoing price reductions, which benefits BESS project economics globally but undermines the investment case for non-Chinese manufacturing.
Key Strategic Findings
Five analytically significant conclusions emerge from this assessment:
- China's 69% to 75% projected share of global battery manufacturing capacity by 2030 creates a structural dependency with no short-term resolution pathway
- The 98% LFP concentration figure represents the most acute single supply chain risk in the global energy transition, exceeding even rare earth dependency concerns
- Sodium-ion's trajectory toward Chinese consolidation represents an early-stage intervention opportunity that OECD policy is currently failing to capitalise on
- The $84/kWh price floor simultaneously accelerates global storage deployment and disincentivises the domestic capacity investment required for long-term energy security
- The decisions made by OECD governments and manufacturers between now and 2028 will largely determine whether the global battery supply chain remains structurally dependent on a single geography for the remainder of the energy transition
Disclaimer: This article contains forward-looking projections and scenario analyses based on third-party research, including the Carnegie Endowment for International Peace report published in July 2026. Capacity figures, demand forecasts, and price projections involve inherent uncertainty and should not be interpreted as investment advice. Readers should conduct independent research before making financial or strategic decisions.
Readers seeking ongoing coverage of battery storage markets, manufacturing developments, and energy storage policy may find value in the reporting available at ESS News (ess-news.com).
Want to Capitalise on the Next Major Mineral Discovery Shaping the Energy Transition?
As battery supply chains reshape global critical mineral demand — driving structural tailwinds for lithium and creating new upstream opportunities across the ASX — Discovery Alert's proprietary Discovery IQ model delivers real-time alerts the moment significant mineral discoveries are announced, turning complex data across 30-plus commodities into clear, actionable insights. Explore Discovery Alert's discoveries page to see how historic ASX discoveries have generated substantial returns, and begin your 14-day free trial today to position yourself ahead of the market.