August 6, 2026
When Two Metals Share the Same Mine But Tell Different Stories
For most of the past two decades, institutional investors treated platinum group metals as a single category. Both platinum and palladium come from the same layered intrusions in South Africa and Russia, both flow through the same refining infrastructure, and both historically landed in the same automotive catalyst applications. Treating them as a unified asset class made intuitive sense. In 2026, however, that logic is breaking down in real time, and the China BEV transition and palladium demand relationship is the primary reason why.
The separation is not a matter of short-term price divergence. It reflects a structural realignment of end-market demand, where one metal's largest consumption category is being systematically dismantled by electrification while the other retains demand diversity robust enough to sustain consecutive supply deficits. Understanding how this split unfolds, and what it means for producers, developers, and investors, requires examining each metal on its own terms rather than as part of a unified basket.
When big ASX news breaks, our subscribers know first
The May 2026 Production Crossover: Why It Matters Beyond the Headline
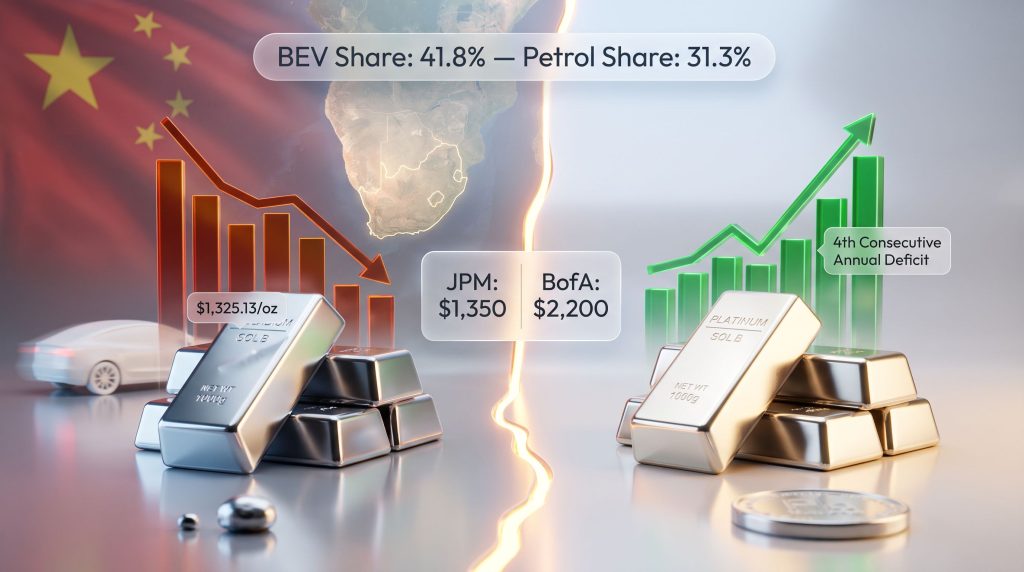
In May 2026, Chinese automakers produced 937,000 battery electric vehicles versus 702,000 petrol-powered passenger cars, according to data from SFA Oxford. It was the first calendar month in which BEV output exceeded petrol vehicle production in the world's largest automotive market. That single data point would be notable on its own. Placed in context, it becomes a structural inflection signal.
Over the first five months of 2026, the share breakdown for China's passenger vehicle production shifted decisively:
| Production Category | Share (Jan-May 2026) | Share (Jan-May 2025) | Direction |
|---|---|---|---|
| Battery Electric Vehicles | 41.8% (May alone) | 32.6% | Accelerating |
| New Energy Vehicles (total NEV) | 52.4% | 48.4% | Rising |
| Petrol Vehicles | 42.5% (Jan-May avg) | 47.9% | Falling |
| Petrol share (May alone) | 31.3% | 44.9% | Sharply lower |
Petrol vehicle production declined 17% over the first five months of 2026 and fell 32% year on year in May alone. Heraeus, the precious metals technology group, attributes this trajectory primarily to the widening cost-of-operation advantage that electric vehicles hold over internal combustion engine alternatives, rather than attributing the shift to any single policy measure. The economics are doing the work. Furthermore, the critical minerals demand outlook for 2025 and beyond underscores just how consequential these shifts in vehicle technology are proving to be.
Why Palladium Bears the Greatest Structural Risk
The asymmetry in how electrification affects each PGM is rooted in demand architecture. Palladium's end-market consumption is overwhelmingly concentrated in gasoline vehicle autocatalysts. There is no meaningful industrial substitute demand waiting to absorb displaced automotive volumes. Each additional BEV produced is a direct, one-for-one subtraction from palladium's demand base.
Platinum's situation is materially different. Its demand profile spans:
- Diesel vehicle autocatalysts, which are less exposed to the BEV transition
- Hydrogen fuel cell components, where platinum is a core catalyst material
- Industrial applications including chemical processing and glass manufacturing
- Jewellery demand, particularly concentrated in China and Japan
- Hybrid and plug-in hybrid autocatalysts, which retain exhaust aftertreatment requirements
This breadth provides a structural buffer that palladium simply does not possess. Global automotive palladium demand is projected to fall more than 5% in 2026, according to Heraeus, and spot palladium traded at $1,325.13 per ounce on July 22, 2026, down more than 40% from its January 2026 peak. Those interested in a deeper examination of platinum and palladium market dynamics will find the investment landscape increasingly nuanced.
Three Demand Scenarios for Palladium Through 2028
Given the scale of analyst disagreement on palladium's outlook, a scenario-based framework is more useful than a single price target. The following three pathways bracket the realistic range of outcomes:
Scenario 1: Accelerated BEV Penetration (Bear Case)
- China's BEV share continues rising at its current trajectory, with petrol vehicle production falling below 25% of total output by 2028
- Global automotive palladium demand declines between 8% and 12% annually
- Platinum-palladium substitution accelerates as the price gap widens further
- Palladium price remains structurally suppressed in the $900 to $1,300 per ounce range
Scenario 2: Hybrid Stabilisation (Base Case)
- Growth in hybrid and extended-range electric vehicles partially offsets pure BEV-driven demand losses, as these vehicles still require exhaust aftertreatment
- Chinese gross autocatalyst palladium demand declines approximately 7% from 2024 levels, with further but slower erosion through 2026 and 2027
- Export demand to the EU provides partial offset due to higher catalyst loading requirements under stricter European emissions standards
- Palladium stabilises in the $1,200 to $1,600 per ounce range
Scenario 3: Supply Shock Interruption (Bull Case)
- A favourable outcome in the US trade court case restricts Russian palladium imports, tightening supply meaningfully
- Hybrid vehicle demand provides sustained demand support alongside the supply constraint
- Palladium recovers toward the $2,000 to $2,200 per ounce range, consistent with Bank of America's published 2026 forecast
Analyst Divergence Alert: J.P. Morgan forecasts palladium at an average of $1,350 per ounce for 2026, while Bank of America projects $2,200 per ounce. The $850 per ounce gap reflects fundamentally different assumptions about the pace of China's electrification and the durability of hybrid demand buffers. Neither institution is making an unreasonable argument, which is precisely what makes the range so wide.
Why the Decline Is Not a Straight-Line Collapse
The Hybrid and EREV Buffer in China's NEV Mix
A common analytical error is to conflate China's NEV transition entirely with pure battery electric vehicles. In practice, China's NEV category includes a substantial proportion of plug-in hybrids and extended-range electric vehicles (EREVs). Both vehicle types retain internal combustion engines and therefore require catalytic converters compliant with domestic and export emissions standards.
This distinction matters enormously for palladium demand modelling. The hybrid buffer does not reverse the structural decline, but it meaningfully moderates the pace at which demand erodes. According to research on hybrid and EREV market share growth, these vehicle types are increasingly overtaking pure BEVs in certain segments, supporting longer-term automotive PGM demand. A market that declines 5% to 7% annually behaves very differently from one collapsing at 15% per year in terms of price formation and the investment window for supply-side adjustment.
The EU Export Premium: A Demand Offset Most Analysts Underweight
An underappreciated dynamic in the palladium demand picture is the growing role of Chinese vehicle exports. Chinese-manufactured ICE, hybrid, and plug-in hybrid vehicles destined for the European Union must comply with significantly stricter EU emissions standards than apply in many other markets. Meeting those standards requires higher catalyst loadings per vehicle.
As Chinese automakers expand their European export volumes, per-vehicle palladium content in export-specification vehicles creates an incremental demand channel that partially compensates for the domestic BEV displacement. This does not reverse the overall demand trajectory, but it adds nuance to the timing and magnitude of demand erosion that a purely domestic-focused analysis would miss. The European electric vehicle market trends further illuminate how this export dynamic plays out across different regulatory environments.
Engineering Friction in Platinum-Palladium Substitution
Platinum and palladium can technically substitute for one another in autocatalyst formulations on approximately a one-to-one basis. With platinum trading at a significant premium to palladium, the theoretical economic incentive to reduce palladium loadings is clear. In practice, however, substitution has proceeded far more slowly than the price differential alone would suggest.
The reason is engineering friction. Changing the catalyst formulation in a production vehicle requires redesigning the entire emissions control system, completing regulatory recertification, and qualifying the new configuration across model lines. That process is capital-intensive and typically takes multiple years to complete. Substitution is happening, but it is a gradual, coordinated engineering programme rather than a rapid market response.
Platinum's Supply Deficit: Four Consecutive Years and Counting
While palladium navigates demand erosion, platinum is experiencing the opposite structural pressure. The World Platinum Investment Council projects a fourth consecutive annual platinum market deficit in 2026, with above-ground stocks progressively drawn down since 2022.
South Africa, which supplies more than 70% of global platinum mine output, recorded a 5.4% year-on-year production decline in May 2026. The seasonally adjusted PGM production index fell from 104.6 in April to 91.8 in May, a 12.2% month-on-month contraction that signals broad-based weakness across the mining sector.
Nick Smart, Chief Executive Officer of ValOre Metals, has noted that global platinum mine production peaked at just over 6 million ounces in 2021 and is forecast at approximately 5.5 million ounces in 2026 — a meaningful decline occurring against the backdrop of a metal price that has roughly doubled over the intervening period. This is the textbook definition of supply inelasticity: higher prices are not translating into proportionally higher output because the structural constraints on new mine development are not price-sensitive on a 3 to 5 year horizon. Greenfield PGM mine development timelines typically run from 10 to 15 years from discovery to first production.
Divergent Producer Performance Within a Weak National Index
The aggregate South African production index obscures meaningful variation at the individual operator level:
| Producer | Output Metric | Result | Change |
|---|---|---|---|
| South Africa national PGM index (May 2026) | Seasonally adjusted | 91.8 | -12.2% MoM, -5.4% YoY |
| Northam Platinum (FY2026) | 4E basis (Pt, Pd, Rh, Au) | 938.8 koz | +4.4% YoY (record) |
| Tharisa (Q2 2026) | Platinum only | 20.9 koz | +22% YoY |
The record output from Northam and the strong quarterly result from Tharisa demonstrate that mine supply growth is achievable at specific, well-managed operations. However, neither company's incremental production is sufficient to close the projected market deficit. Consequently, the platinum supply shortfall reflects systemic capacity constraints across the South African mining sector rather than operational failures at individual mines.
The ETF Paradox: Falling Holdings Despite Physical Tightness
One of the most analytically puzzling features of the 2026 platinum market is the divergence between tightening physical supply and falling investment demand. Platinum ETF holdings dropped to a two-year low of 3.07 million ounces by mid-2026, following approximately 700,000 ounces of net outflows in H1 2026. Between March and May alone, 402,000 ounces (approximately 11.5% of total holdings) were liquidated as investors raised cash following losses in other asset classes.
Four consecutive years of projected platinum market deficits should theoretically attract institutional investment. Instead, ETF holders are selling. This disconnect between physical market fundamentals and investment behaviour represents one of the most significant unresolved analytical questions in the PGM market, and its resolution will likely determine whether platinum prices ultimately reflect supply constraints or remain anchored by weak sentiment.
J.P. Morgan forecasts platinum averaging $1,800 per ounce by end-2026, while Bank of America projects $3,000 per ounce in Q4 2026. The $1,200 per ounce gap is extraordinary by any historical standard and signals that the market has not yet formed a consensus view on the relative weight of supply deficits versus weak investment demand. For broader context, the mining commodity outlook for 2025 highlights how divergent analyst views are similarly shaping copper and uranium price expectations.
The US Trade Case: A Binary Legal Catalyst for Palladium Supply
Separate from China's electrification trajectory, a US legal proceeding has introduced a defined supply-side catalyst for palladium with a binary outcome:
- February 13, 2026: The US Department of Commerce issued a preliminary antidumping determination imposing a 132.83% duty on unwrought palladium imports from Russia.
- May 29, 2026: The International Trade Commission found insufficient harm to the US domestic industry, preventing the preliminary duty from being finalised.
- July 21, 2026: Sibanye-Stillwater, the operator of the Stillwater mine in Montana, the only primary palladium mine in the United States, appealed the ITC ruling to the US Court of International Trade.
The appeal matters because the court will ultimately deliver one of two outcomes. If the ITC's finding is overturned, the antidumping case could proceed toward trade measures that restrict Russian palladium access to the US market, creating a domestic supply premium. If the court upholds the ITC ruling, Russian palladium continues flowing without trade barriers and the China BEV transition and palladium demand relationship remains the dominant driver of global price dynamics. The geopolitical landscape for metals and mining in 2025 provides essential background on how trade disputes of this nature shape commodity markets more broadly.
This is a rare example of a clearly defined legal milestone that functions as a genuine binary catalyst, giving investors a specific event to monitor rather than a diffuse macro trend. Furthermore, analysis of the bullish case for palladium argues that supply constraints of this kind, combined with limited new mine development, could prove more significant than bearish demand projections currently suggest.
The next major ASX story will hit our subscribers first
Geographic Concentration Risk and the Case for Supply Diversification
With approximately 90% of global PGE reserves located in South Africa, the platinum group metals market carries a degree of geographic concentration risk that is unmatched by most other industrial metals. Operational disruptions, labour actions, or sustained energy constraints in South Africa do not merely affect individual producers — they affect global supply balances for both platinum and palladium simultaneously.
Only two major greenfield PGM mines are expected to enter production in the near term, leaving the development pipeline thin relative to the scale of the projected deficits. Exploration-stage assets in alternative jurisdictions therefore represent early-stage supply optionality that carries growing strategic value as South African output stagnates. In addition, the lithium boom driven by battery storage expansion illustrates how rapidly demand can shift the economics of alternative mineral projects when supply concentration risks become apparent.
ValOre Metals holds the Pedra Branca PGE project in Ceará State, Brazil, which contains an NI 43-101 Inferred Resource of 2.2 million ounces of platinum, palladium, and gold across 63.3 million tonnes grading 1.08 grams per tonne (effective March 8, 2022). A preliminary economic assessment is targeted for Q4 2026, which will provide one of the first formal economic benchmarks for a non-South African PGM project evaluated under the current structurally diverging price environment.
Why Diverging Prices Fundamentally Change Project Economics
For any project containing both platinum and palladium, the separation of the two metals' price outlooks introduces a meaningful modelling challenge. Under a scenario where platinum trades at $2,500 to $3,000 per ounce and palladium trades at $1,200 to $1,500 per ounce, the revenue weighting between the two metals shifts substantially compared with any period when they traded at comparable levels.
Projects that are platinum-heavy in their resource composition benefit from the current divergence. Projects with higher palladium ratios face a more cautious revenue profile under the same assumptions. Economic studies published in late 2026 will test whether PGM project returns remain robust under these structurally separated price assumptions, replacing the historical convention of using a single blended PGM basket price.
Frequently Asked Questions: China BEV Transition and Palladium Demand
Why does China's shift to BEVs affect palladium more severely than platinum?
Palladium's end-market demand is overwhelmingly concentrated in gasoline vehicle autocatalysts. Because BEVs eliminate the need for catalytic converters entirely, each additional BEV produced is a direct subtraction from palladium's demand base. Platinum, however, serves a broader range of applications including diesel autocatalysts, hydrogen fuel cells, industrial processes, and jewellery, providing demand channels that are substantially insulated from BEV penetration.
Is the demand decline from China's BEV transition a rapid collapse?
No. The growth of hybrid and extended-range electric vehicles within China's NEV mix provides a partial demand buffer, as these vehicles still require exhaust aftertreatment systems. Additionally, Chinese vehicle exports to the EU require higher catalyst loadings to comply with stricter European emissions standards, generating export-driven demand that partially offsets domestic BEV displacement. The decline is structural and directional, but moderated in pace by these offsetting factors.
What conditions would support a meaningful palladium price recovery?
A combination of factors could support recovery: a slower-than-expected pace of BEV penetration in China, sustained hybrid vehicle production growth, a favourable ruling in the US trade court case restricting Russian palladium imports, or a simultaneous reduction in South African PGM supply affecting both metals. The convergence of more than one of these factors would be required to generate a recovery of the magnitude that Bank of America's $2,200 per ounce forecast implies.
Why are analyst price forecasts for platinum and palladium so far apart in 2026?
The gaps reflect genuine uncertainty about which market forces will dominate over the remainder of 2026. Analysts disagree on the pace of China's electrification, the durability of hybrid demand buffers, the investment community's willingness to re-engage with platinum ETFs in the face of persistent physical deficits, and the probability of a favourable trade court outcome for US palladium supply. When the key variables are genuinely contested, wide forecast ranges are an accurate representation of market uncertainty rather than an analytical failure.
Want to Identify the Next Major ASX Mineral Discovery Before the Market Does?
Discovery Alert's proprietary Discovery IQ model delivers real-time alerts on significant ASX mineral discoveries across 30+ commodities — including PGMs and critical minerals tied to the energy transition — turning complex data into actionable investment insights the moment they are announced. Explore Discovery Alert's dedicated discoveries page to understand how historic mineral discoveries have generated substantial returns, and begin your 14-day free trial today to position yourself ahead of the broader market.