
August 11, 2026
The Paradox of Peak Volume: When Record Import Figures Mask a Structural Decline
Global commodity markets have a well-documented tendency to mislead. Traders, analysts, and policymakers frequently anchor their outlook to the most recent headline number, overlooking the structural currents flowing beneath the surface. In coal markets, this cognitive trap is particularly hazardous. A single month of record-breaking import volumes can simultaneously represent the apex of a temporary anomaly and the beginning of a multi-year demand contraction. Understanding which scenario is unfolding requires moving beyond the headline and interrogating the mechanisms driving the data.
That is precisely the challenge confronting observers as China coal imports taper off heading into the second half of 2026. A 23% year-on-year surge in July total coal imports to 43.73 million tons looks, at first glance, like a market in rampant health. Dig beneath that figure, however, and the picture that emerges is fundamentally different. The conditions that generated that record volume were temporary by design, self-correcting by nature, and already beginning to unwind as August data takes shape.
When big ASX news breaks, our subscribers know first
Why a Safety Inspection Cycle Distorted the Mid-2026 Import Picture
The starting point for understanding China's coal import surge is a single catastrophic event. On 22 May 2026, a fatal accident at a coal mine in Shanxi province, one of China's most prolific coal-producing regions, killed 82 workers. The incident triggered a mandatory wave of safety inspections across Chinese coal operations, a regulatory response that follows an established and well-documented pattern in the country's mining sector.
Safety inspection cycles in China's coal industry function as a predictable, if blunt, instrument of supply disruption. When inspections are mandated at scale, domestic production slows sharply as mines pause operations to demonstrate compliance. The resulting output gap is filled through imports, causing seaborne and overland volumes to spike. This is not a demand story. It is a supply disruption story with a built-in expiration date.
The numbers confirm the pattern. Domestic coal production fell 9.7% year-on-year in June 2026, reaching 380.8 million tons in total. Average daily output of 12.7 million tons was the lowest recorded since July 2025, according to official Chinese government data. With domestic supply constrained, utilities, steel mills, and industrial users turned to international markets to bridge the gap, lifting total imports to 42.78 million tons in June and 43.73 million tons in July. These coal supply challenges are symptomatic of a broader structural dynamic playing out across the sector.
Import surges triggered by domestic safety inspection cycles are structurally self-correcting. Once inspection activity concludes and mines return to operational capacity, the incremental demand for imports evaporates, often within one to two months. The import premium generated by supply disruption carries a built-in reversal mechanism.
Analysts tracking Chinese domestic production reported in early August that output in that month was on course to return to levels broadly consistent with 2025 volumes. If that trajectory holds, the justification for elevated import volumes disappears almost entirely.
August Data Signals the First Crack in the Import Surge
Seaborne Volumes Begin Their Retreat
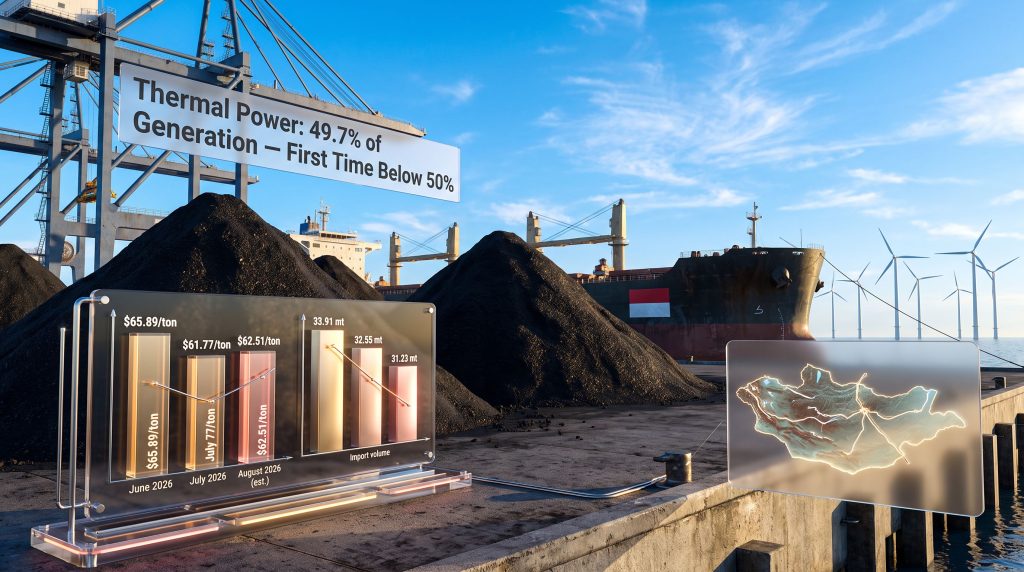
The leading edge of the correction is visible in August seaborne coal import estimates. Analysts at DBX Commodities assessed August seaborne coal imports at 31.23 million tons, down from 33.91 million tons in July. If confirmed, this would represent the first month-on-month decline in four months and would push seaborne volumes back toward the April 2026 low of 33.1 million tons that preceded the safety-inspection-driven rebound.
It is worth clarifying terminology here for readers less familiar with the mechanics of seaborne coal trade. Seaborne imports refer to coal delivered by bulk carrier vessels from overseas suppliers, principally Indonesia and Australia, as opposed to coal transported overland across land borders. Seaborne volumes account for approximately 75% of China's total coal imports, making them the primary barometer of international market demand.
The August estimate remains subject to upward or downward revision as additional cargo assessments are completed, but the directional signal from multiple independent data streams points consistently toward lower volumes.
China Shenhua's Procurement Pause: A State Enterprise Sends a Signal
Among the most telling behavioural indicators of easing import demand is the decision by China Shenhua Energy, the country's largest coal producer and a significant market participant, to halt spot coal purchases as port stockpiles accumulated. When a state-owned enterprise of this scale and sophistication reduces spot buying activity, it functions as an early warning signal to the broader market.
Port inventory accumulation, reduced spot cargo bookings, and a pullback in discretionary purchasing are the three hallmarks of an import normalisation phase. All three were visible in the August data window. The behaviour of large state-owned enterprises in China's energy sector tends to anticipate market turning points more reliably than headline trade statistics, precisely because their procurement teams operate with access to real-time inventory, production, and demand data that lags in official reporting.
Mapping China's Dual Import Architecture: Seaborne and Overland
A nuanced understanding of how China's coal import system is structured reveals a less commonly discussed dynamic that is reshaping the market over the medium term.
| Import Channel | Approximate Share of Total | Primary Commodity | Key Suppliers |
|---|---|---|---|
| Seaborne | ~75% (declining) | Thermal and metallurgical coal | Indonesia, Australia |
| Overland | ~25% (growing) | Metallurgical coal | Mongolia, Russia |
While seaborne volumes dominate aggregate import figures, the overland channel, primarily Mongolian metallurgical coal transported by rail and truck across China's northern border, has been expanding its share consistently. Mongolian met coal serves China's steel industry, supplying coking coal that is geologically and logistically distinct from the thermal coal grades used in power generation.
The strategic implication is significant. As Mongolian supply grows, it compresses the addressable market for seaborne exporters, particularly for metallurgical coal grades. Furthermore, China steel demand dynamics mean Australian metallurgical coal exporters, who compete directly in this segment, face structurally intensifying competition from overland Mongolian volumes that cannot be replicated through seaborne channels.
Price Signals: How Indonesian Coal Benchmarks Are Responding
Seaborne coal pricing has begun reflecting the demand easing that volume data foreshadowed. Indonesia, the world's largest coal exporter and China's primary seaborne supplier, produces the 4,200 kilocalorie per kilogram (kcal/kg) thermal coal grade that represents the most liquid benchmark for Chinese buyer preferences. This specific calorific rating matters because it sits at a price point accessible to smaller Chinese utilities and industrial users that cannot economically burn higher-grade coal without blending.
Commodity price reporting agency Argus assessed 4,200 kcal/kg Indonesian thermal coal at $62.51 per ton for the week ending 7 August. This compared to a July monthly average of $61.77 per ton and a June monthly average of $65.89 per ton, representing a 5.1% price decline from the June peak to the August assessment.
| Period | Seaborne Import Volume (Est.) | Indonesian Coal Price (4,200 kcal/kg) | Price Direction |
|---|---|---|---|
| June 2026 | Over 40 million tons | $65.89/ton | Rising |
| July 2026 | 33.91 million tons (seaborne est.) | $61.77/ton | Flattening |
| August 2026 (est.) | 31.23 million tons | $62.51/ton (week of 7 Aug) | Stabilising/Softening |
The fact that prices have not collapsed more sharply despite the volume pullback reflects several structural buffers. Indonesia's own production scheduling and export logistics create natural supply-side rigidity. Freight market dynamics, including vessel availability constraints and port congestion at major Indonesian coal terminals, also cushion price declines during demand transition periods. However, these buffers do not change the directional trajectory over a multi-week horizon.
The Energy Transition Variable: China Crosses a Historic Threshold
Fossil Fuels Fall Below 50% of Electricity Generation for the First Time
The most structurally significant data point in China's energy mix during 2026 is one that extends well beyond the coal import discussion. In the first half of 2026, fossil fuels accounted for less than 50% of China's total electricity generation for the first time on record. Official government data showed thermal power, predominantly coal with a minor gas component, contributing 49.7% of total generation. Thermal power output did grow in absolute terms, rising 2.9% year-on-year in H1 2026, but its share of total generation continued to contract as renewable capacity additions outpaced thermal growth.
This milestone matters for coal import dynamics because it represents a structural inflection point, not a cyclical fluctuation. The broader energy transition in mining and power generation sectors is reshaping demand ceilings at a pace that even optimistic forecasters did not anticipate. Once renewable generation capacity reaches the scale required to displace marginal thermal output, the ceiling on coal demand begins compressing even when absolute generation volumes are rising.
Three Forces Compressing China's Coal Import Ceiling
| Force | Mechanism | Impact on Coal Imports |
|---|---|---|
| Domestic production recovery | Safety inspections resolve; mines return to capacity | Reduces import substitution need |
| Renewable energy expansion | Wind and solar displace marginal coal generation | Lowers thermal coal demand ceiling |
| Overland supply growth from Mongolia | Seaborne market share shrinks as overland volumes expand | Reduces seaborne market exposure for international exporters |
Wind power capacity additions in China are accelerating even as solar installation growth has moderated following a scaling back of incentive programmes. The compound effect of both technologies expanding simultaneously means that coal's share of the electricity mix faces sustained structural compression over the medium term, regardless of short-term fluctuations in thermal output.
If China maintains domestic coal production at or near current levels while renewable generation continues expanding, months where total coal imports exceed 40 million tons are increasingly likely to become statistical outliers rather than indicators of a new demand baseline.
The next major ASX story will hit our subscribers first
Contextualising 2026 Within the Multi-Year Import Decline
China's total coal imports fell approximately 9.6% in 2025, reaching around 490 million tons. Industry forecasts heading into 2026 pointed to continued moderation. The safety-inspection-driven rebound in June and July should not be interpreted as a reversal of that downtrend. The critical analytical distinction is between supply-disruption-driven import surges and genuine demand-driven import growth.
-
Demand-driven surges reflect new consumption growth, sustained purchasing at elevated prices, and inventory drawdowns that require ongoing replenishment.
-
Supply-disruption surges reflect temporary domestic output gaps being filled by imports. They are characterised by rapid reversals once the disruption resolves, regardless of underlying demand trends.
The June and July 2026 surge exhibits every characteristic of the latter category: a discrete triggering event, a predictable inspection-driven production decline, spot buying spikes rather than long-term contract increases, and an early reversal in August seaborne estimates as domestic output normalises. Research into China's unwinding coal demand further reinforces that these structural headwinds are well-established and multi-year in character.
What Tapering Chinese Demand Means for Global Exporters and Freight Markets
Indonesia Faces the Sharpest Near-Term Exposure
Indonesia's position as China's largest seaborne coal supplier places it at the direct receiving end of any demand moderation. The 4,200 kcal/kg grade most favoured by Chinese buyers is already showing price softening from June peaks, and further volume reductions would apply additional downward pressure. Indonesian exporters are under growing pressure to diversify toward alternative markets, particularly India and the broader Southeast Asian region, as Chinese buying activity moderates.
Australia Navigates a More Complex Dynamic
Australian metallurgical coal exports to China operate under a different demand framework than thermal coal. Steel production requirements, not electricity generation, determine met coal import volumes, making Australian exports partially insulated from the renewable energy displacement story. However, the growing competitiveness of overland Mongolian met coal supply creates a separate and equally durable competitive headwind for Australian exporters serving the Chinese steel sector. Consequently, trade impacts on bulk commodities are reshaping the competitive landscape for Australian producers navigating these shifting flows.
Dry Bulk Shipping: The Cascading Secondary Effect
Declining seaborne coal volumes from China reduce demand for dry bulk shipping capacity, particularly Capesize and Panamax vessel classes that handle large coal cargoes. Freight rate softening in major coal trade routes cascades into broader dry bulk market sentiment and creates a well-established feedback loop with the Baltic Dry Index. In addition, commodity market volatility in shipping adds a further layer of uncertainty for market participants who anchor their outlook to Chinese coal import volumes, making the August directional shift an early signal of reduced cargo demand over the months ahead.
Frequently Asked Questions: China Coal Imports Taper Off
Why did July 2026 show record import volumes if the overall trend is declining?
A mine accident in Shanxi province in May 2026 triggered mandatory safety inspections that suppressed domestic coal output by 9.7% year-on-year in June to 380.8 million tons. China increased seaborne and overland purchases to compensate, pushing July totals to 43.73 million tons. This type of supply-shock-driven surge is historically short-lived and reverses once inspection activity concludes and domestic production normalises.
What are August 2026 seaborne import estimates indicating?
DBX Commodities estimates August seaborne coal imports at 31.23 million tons, down from 33.91 million tons in July. This would mark the first month-on-month decline in four months and aligns with the broader 2025 to 2026 downtrend in Chinese coal import volumes.
How significant is renewable energy development for long-term coal import demand?
Fossil fuels fell below 50% of China's electricity generation for the first time in H1 2026, with thermal power contributing 49.7% of total generation. As wind and solar capacity continues expanding, the structural demand ceiling for coal-fired generation, and therefore imported coal, compresses over the medium to long term.
Which exporters are most exposed to softening Chinese coal demand?
Indonesia carries the most direct exposure as China's largest seaborne coal supplier, with price softening already evident in the benchmark 4,200 kcal/kg grade. Mongolia's overland coal volumes may continue growing. Australia faces a more nuanced picture, with met coal exports partially insulated by steel demand but facing growing competition from Mongolian overland supply.
Is the current decline in imports structural or cyclical?
The evidence points to both forces operating simultaneously. The mid-2026 surge was cyclical, driven by a discrete safety inspection event. The broader multi-year decline of approximately 9.6% in 2025 reflects structural forces including rising domestic production capacity, accelerating renewable energy deployment, and expanding overland supply from Mongolia. Structural forces are expected to dominate the medium-term outlook.
Key Takeaways: The Strategic Outlook for China Coal Imports
-
The July 2026 total import figure of 43.73 million tons was anomalous, driven entirely by a safety-inspection-induced domestic production shortfall rather than new structural demand.
-
August seaborne coal imports are estimated at 31.23 million tons, down from 33.91 million tons in July, marking the beginning of a demand normalisation phase.
-
Chinese domestic coal production is recovering as inspection cycles conclude, removing the primary justification for elevated import substitution.
-
Thermal power's share of electricity generation fell below 50% for the first time in H1 2026, confirming a structural inflection point in China's energy mix.
-
Indonesian 4,200 kcal/kg coal prices softened from $65.89 per ton in June to approximately $62.51 per ton in early August, reflecting easing Chinese purchasing activity.
-
China's total coal imports declined approximately 9.6% in 2025, and the structural forces driving that trend remain intact heading through 2026 and beyond.
The forces behind China coal imports tapering off over the medium term, domestic production recovery, accelerating renewable energy deployment, and growing overland supply from Mongolia, are durable and multi-year in character. The mid-2026 volume surge was a temporary deviation from a well-established structural downtrend, not a reversal of it. Investors and market participants who interpret record monthly volumes as signals of renewed import demand risk misreading one of the most consequential commodity market transitions of the decade.
Disclaimer: This article contains forward-looking statements, market forecasts, and commodity price projections sourced from publicly available data and industry analysis. These projections are inherently uncertain and should not be construed as financial advice. Readers should conduct independent due diligence before making investment decisions based on commodity market analysis. Import volume estimates cited are subject to revision as additional cargo assessment data becomes available.
For further reading on global seaborne coal market dynamics and China's energy transition trajectory, Mining Weekly at miningweekly.com provides ongoing coverage across coal, critical minerals, and energy sectors.
Want to Identify the Next Major ASX Mineral Discovery Before the Broader Market?
While structural shifts in China's coal import cycle reshape global commodity demand, Discovery Alert's proprietary Discovery IQ model delivers real-time alerts on significant ASX mineral discoveries, translating complex market data into actionable opportunities for both short-term traders and long-term investors — explore the historic returns major discoveries have generated and begin your 14-day free trial today to position yourself ahead of the market.