July 8, 2026
The Quiet Transformation of Global Capital: Understanding China's Expanding Overseas Investment Footprint
Global capital does not move in straight lines. The architecture of international investment shifts in response to geopolitical pressures, technological imperatives, and strategic calculations that often take years to fully materialise. What appears as a simple ranking in an annual report frequently conceals a far more complex realignment of economic power beneath the surface.
That is precisely the context needed to interpret China's position in the 2025 global foreign direct investment landscape. Rather than reading the headline figure in isolation, understanding what drives the number, what sectors absorb it, and how it compares structurally with other major capital exporters reveals a picture that diverges sharply from mainstream narratives of Chinese economic retreat.
When big ASX news breaks, our subscribers know first
China Foreign Direct Investment Abroad: What US$174 Billion Actually Represents
Chinese enterprises deployed US$174.38 billion into overseas markets in 2025, according to data compiled by the United Nations Conference on Trade and Development (UNCTAD). This figure represents outward foreign direct investment, meaning capital flowing from China into foreign economies, not capital entering China from abroad. These two directions are structurally distinct, and conflating them produces a distorted reading of China's actual global capital footprint.
UNCTAD defines foreign direct investment as cross-border investment establishing a lasting interest in an enterprise, typically involving ownership of at least 10% of voting power. Outward FDI rankings measure how much capital each country's firms and institutions are deploying internationally, making it a proxy for strategic global ambition rather than domestic economic attractiveness.
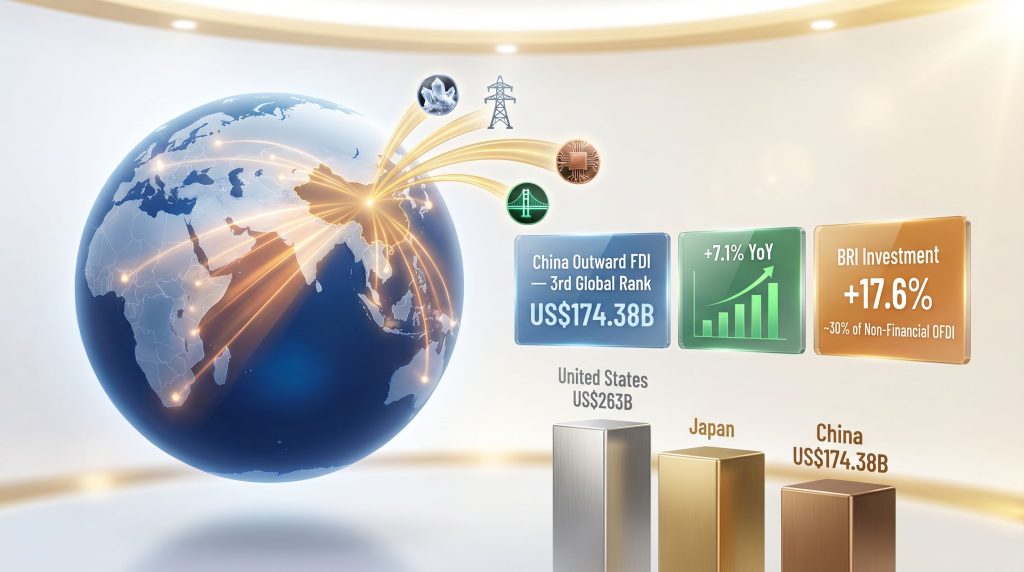
The US$174.38 billion figure positions China as the world's third-largest source of outward FDI in 2025, trailing only the United States and Japan. The United States recorded outflows of US$263 billion, while Japan ranked second with outflows above US$174 billion.
Where China Sits on the 2025 Global FDI Leaderboard
| Rank | Country | Outward FDI (2025) |
|---|---|---|
| 1 | United States | US$263 billion |
| 2 | Japan | Above US$174 billion |
| 3 | China | US$174.38 billion |
This ranking reflects a meaningful shift from five years earlier. In 2020, China held the second position globally in both FDI inflows and outflows. By 2025, it had slipped to third in outflows and fourth in inflows, a repositioning that reflects the combined effect of geopolitical fragmentation, deliberate strategic refocusing, and an acceleration of investment activity by competing economies. Furthermore, the geopolitical landscape for metals and mining has added additional complexity to how these capital flows are interpreted globally.
A declining rank does not necessarily indicate a declining strategy. When absolute outflows are still growing year-on-year, a drop in position frequently reflects faster growth among competitors rather than contraction at home.
What Is Driving China's 7.1% Year-on-Year Growth in Overseas Investment?
Despite broader headwinds in global trade and investment, China's outward FDI grew at a rate of 7.1% year-on-year in 2025. This growth was not evenly distributed. It was concentrated in specific sectors and geographies, suggesting a deliberate pivot from volume-led expansion toward precision-targeted capital deployment.
UNCTAD's analysis highlights that China's overseas investment has become notably more focused on:
- Greenfield projects in manufacturing, energy, and infrastructure rather than acquisitions of existing assets
- Critical raw materials including lithium, cobalt, copper, and rare earth elements essential to energy transition supply chains
- Developing economies across Africa, Southeast Asia, Central Asia, and Latin America
- South-South investment corridors, a structural category describing capital flows between Global South nations
The Belt and Road Initiative (BRI) plays a central organisational role in this reorientation. BRI-country investment grew 17.6% in 2025, representing nearly 30% of China's total non-financial outward FDI. This suggests the BRI has matured well beyond its original identity as an infrastructure diplomacy programme. It now functions increasingly as a supply chain architecture tool, embedding Chinese capital into the resource and manufacturing ecosystems of developing economies.
The Critical Minerals Imperative
One of the least-discussed but most structurally significant drivers of China's outward FDI trajectory is the race to secure upstream control of critical mineral supply chains. As energy transition technologies — including electric vehicles, grid-scale battery storage, and solar photovoltaics — require increasing volumes of lithium, cobalt, manganese, graphite, and rare earth elements, the ability to influence resource availability at the mining and processing stage becomes a significant competitive advantage. The critical minerals demand surge underpinning this transition is reshaping where and why capital flows across borders.
Chinese enterprises have increasingly directed greenfield capital toward projects in resource-rich developing economies where regulatory environments are more accessible and existing Western investment is limited. This is not simply a commercial calculation. It represents a long-cycle strategic commitment to supply chain security that extends well beyond the return horizons of typical financial investors. In addition, China's rare earth trade strategy reveals how resource control has become inseparable from broader geopolitical positioning.
How China's Share of Global FDI Has Shifted Over Five Years
| Year | China's Share of Global FDI Outflows |
|---|---|
| 2020 | 15.5% |
| 2025 | 6.7% |
The compression from 15.5% to 6.7% of global FDI outflows over five years requires careful interpretation. On the surface, it reads as a dramatic loss of influence. In context, however, it reflects something more nuanced.
Global FDI volumes expanded significantly over this period, driven by nearshoring activity, energy transition investment, and a wave of cross-border M&A in technology and financial services. China's share shrank not primarily because its outflows contracted, but because the denominator grew faster than China's own pace of deployment.
Additionally, targeted investment screening regimes in the European Union, the United States, Australia, and several other OECD economies have created structural barriers to certain categories of Chinese cross-border acquisition, particularly in technology, defence-adjacent sectors, and critical infrastructure. This regulatory friction has effectively redirected Chinese capital toward non-OECD destinations where screening mechanisms are less developed. For instance, fine-tuning FDI screening in regions such as Singapore and ASEAN is actively shaping the direction of these redirected flows.
The Inbound Side of the Equation: What Is Happening to Foreign Investment Into China?
The outbound story tells only half the tale. China's attractiveness as a destination for foreign capital has followed a different trajectory, and the data is more sobering.
| Metric | Value |
|---|---|
| Inbound FDI (2025) | US$107.5 billion |
| Year-on-Year Change | -8% |
| Peak Inbound FDI | US$189 billion (2022) |
| Q1 2026 Inbound FDI | ~US$34.5 billion (-7.3% YoY) |
| Global Rank (Inflows, 2025) | 4th |
| Top Inbound FDI Destination (2025) | United States (US$277 billion) |
Inbound FDI into China reached US$107.5 billion in 2025, down 8% year-on-year and significantly below the US$189 billion peak recorded in 2022. Early indicators for 2026 suggest the pressure has not yet stabilised, with Q1 2026 inflows equivalent to approximately US$34.5 billion, reflecting a further year-on-year decline of 7.3%.
UNCTAD acknowledges that the pace of decline moderated in 2025, attributing the persistent softness to a combination of factors:
- Economic restructuring within China altering the cost and returns profile of investment
- Shifts in global value chains as multinationals diversify manufacturing exposure
- Geopolitical tensions influencing risk assessments by Western corporate boards
- Tariff uncertainty creating planning hesitancy for export-oriented facilities
The gap between China's outbound momentum and inbound contraction is one of the most structurally significant signals in the 2025 FDI data. It points to a capital account dynamic where China is increasingly a net exporter of investment — a position that carries both strategic leverage and domestic allocation questions. Consequently, the US-China trade war impacts of 2025 have further intensified these asymmetries, making the inbound contraction difficult to reverse in the near term.
The next major ASX story will hit our subscribers first
How China's FDI Strategy Compares to the United States and Japan
| Dimension | United States | Japan | China |
|---|---|---|---|
| 2025 Outward FDI | US$263B | Above US$174B | US$174.38B |
| Primary Focus | Financial services, technology, M&A | Manufacturing, automotive | Critical materials, energy, greenfield |
| Geographic Concentration | Global (OECD-heavy) | Asia-Pacific | Global South, BRI corridors |
| Strategic Driver | Market returns | Supply chain efficiency | Resource security, technology access |
The structural contrast between Chinese and Western outward FDI models is significant. American and European capital tends to target returns through financial markets, technology platforms, and established corporate acquisitions, predominantly within OECD economies where legal frameworks and exit mechanisms are mature.
China's model is greenfield-heavy, meaning capital is deployed into building new facilities, mines, processing plants, and infrastructure from the ground up. This approach is slower to generate financial returns but produces durable physical and operational control over strategic assets. It also creates employment and infrastructure in host economies, which can generate political capital alongside economic returns.
Japan's model occupies a middle ground, prioritising manufacturing supply chain efficiency and automotive sector integration across Asia-Pacific, with a longer investment horizon than typical Western financial players but a less explicitly resource-security-oriented posture than China.
Key Risks and Structural Constraints on China's Overseas Investment Growth
No assessment of China's outward FDI trajectory is complete without mapping the genuine structural risks that could constrain or redirect capital flows in the years ahead:
- Investment screening regimes in the US, EU, UK, Canada, and Australia have introduced formal mechanisms to block or condition Chinese acquisitions in sectors deemed strategically sensitive, covering technology, telecommunications, ports, and energy infrastructure.
- Tariff fragmentation is restructuring global trade architecture in ways that complicate the return calculations for manufacturing-oriented FDI, particularly where export market access is uncertain.
- Domestic capital allocation pressure is increasing as China manages internal financial system risks, property sector deleveraging, and local government debt, potentially limiting the pool of capital available for overseas deployment.
- Host country political risk in some BRI-corridor economies has increased as debt sustainability concerns, domestic political transitions, and resource nationalism create complications for long-cycle greenfield investments. Moody's concern over Chinese influence in Latin America illustrates precisely this type of emerging friction.
UNCTAD characterises the current global investment environment as genuinely challenging, shaped by rising costs, supply-chain diversification pressures, geopolitical tensions, and persistent tariff uncertainties that affect capital planning across all major investor nations.
Furthermore, the broader question of critical minerals and energy security adds another layer of complexity, as host nations grow increasingly aware of the strategic value embedded in resource agreements.
Statistical Snapshot: China's 2025 FDI in Full
| Metric | 2025 Value | Change |
|---|---|---|
| China Outward FDI | US$174.38 billion | +7.1% YoY |
| Global Rank (Outflows) | 3rd | Down from 2nd (2020) |
| China Inbound FDI | US$107.5 billion | -8% YoY |
| Global Rank (Inflows) | 4th | Down from 2nd (2020) |
| BRI Country Investment Growth | +17.6% | ~30% of non-financial OFDI |
| China's Share of Global FDI | 6.7% | Down from 15.5% (2020) |
| US Outward FDI (Benchmark) | US$263 billion | Reference |
| US Inbound FDI (Benchmark) | US$277 billion | Reference |
Frequently Asked Questions: China Foreign Direct Investment Abroad
What does China's US$174 billion in foreign direct investment abroad mean?
It represents the total capital deployed by Chinese companies and institutions into overseas markets in 2025, ranking China third globally among outward FDI sources according to UNCTAD data.
How does China's outward FDI compare to the United States?
The United States recorded US$263 billion in outward FDI in 2025, making it the largest source globally. China foreign direct investment abroad of US$174.38 billion placed it third, with Japan holding the second position.
Why did China's global FDI share fall from 15.5% to 6.7%?
The decline reflects faster growth in global FDI overall rather than an absolute contraction in Chinese outflows, combined with regulatory barriers limiting access to certain OECD markets and a deliberate shift toward targeted sectoral investment over broad-based capital deployment.
What sectors are Chinese companies prioritising in overseas investments?
Chinese outward FDI is increasingly concentrated in critical raw materials, energy infrastructure, greenfield manufacturing, and technology services, with a strong geographic orientation toward developing economies across Africa, Southeast Asia, Central Asia, and Latin America.
Is China's inbound FDI declining, and what is driving the trend?
Yes. Inbound FDI fell 8% year-on-year to US$107.5 billion in 2025, continuing a decline from the 2022 peak of US$189 billion. Contributing factors include economic restructuring, global value chain shifts, geopolitical friction, and tariff-related planning uncertainty.
What is the Belt and Road Initiative's role in China's outward investment strategy?
BRI-corridor investment grew 17.6% in 2025, accounting for approximately 30% of China's total non-financial outward FDI. The initiative has evolved from infrastructure diplomacy toward a supply chain integration architecture spanning resource and manufacturing economies across the Global South.
How does UNCTAD rank countries by foreign direct investment?
UNCTAD compiles annual FDI flow data from national statistical agencies and balance of payments reports, ranking countries separately by inward and outward FDI volumes. Its World Investment Report, published annually, is the primary reference source for global FDI rankings and structural analysis.
Disclaimer: This article contains forward-looking assessments and macroeconomic analysis drawn from publicly available data, including UNCTAD's 2025 findings. Readers should note that FDI figures are subject to revision and that projections regarding investment trends involve inherent uncertainty. Nothing in this article constitutes investment advice.
Want to Track the ASX Mineral Discoveries Fuelled by the Global Race for Critical Resources?
As China's overseas investment increasingly targets critical raw materials and energy transition supply chains, the resulting demand creates significant discovery opportunities on the ASX — and Discovery Alert's proprietary Discovery IQ model instantly identifies these high-potential announcements, turning complex mineral data into actionable insights. Explore historic discovery returns on Discovery Alert's dedicated discoveries page and begin your 14-day free trial to position yourself ahead of the market.