
July 6, 2026
The Hidden Architecture Flaw Stalling China's Energy Transition
The physics of electricity grids contain an uncomfortable truth that renewable energy advocates rarely lead with: generating clean power and actually delivering it to consumers are two entirely different engineering challenges. A wind turbine spinning in Inner Mongolia produces electricity that must travel through transmission corridors, navigate provincial dispatch hierarchies, and comply with scheduling rules written decades ago for coal plants running on predictable fuel schedules. When those systems fail to align, the China fossil fuel power comeback due to low wind and grid constraints becomes not merely a possibility but an operational reality.
This institutional and physical reality sits at the centre of what unfolded across China's power sector in the opening quarter of 2026, when thermal power output rose 3.7% after recording its first annual decline in a decade during 2025. That reversal, driven by a convergence of weather anomalies, demand acceleration, and structural grid constraints, tells a story far more complex than a simple fossil fuel comeback narrative suggests.
When big ASX news breaks, our subscribers know first
When More Capacity Produces Less Clean Power
The Capacity-Generation Disconnect Nobody Explains
One of the most misunderstood metrics in energy reporting is installed capacity versus actual generation output. China reached a landmark threshold in early 2026 when non-fossil sources represented 52% of total operating power capacity, a genuinely historic milestone. Yet thermal power simultaneously surged. Understanding why requires grasping a single technical distinction.
Installed capacity measures nameplate power rating in gigawatts. Generation output measures actual electricity delivered in terawatt-hours over time. These figures diverge sharply across fuel types because of capacity factors — the percentage of theoretical maximum output actually achieved in practice.
Typical Chinese capacity factors run approximately as follows:
| Generation Type | Approximate Capacity Factor |
|---|---|
| Coal-fired thermal | 45–50% |
| Nuclear | 85–90% |
| Onshore wind | 25–30% |
| Solar PV | 15–20% |
What this table reveals is structural: even if non-fossil sources command a majority of installed capacity, coal plants running at double or triple the utilisation rate of solar installations will dominate actual generation. The 52% capacity milestone is meaningful as a long-term indicator of directional change, but it does not translate proportionally into emissions reductions under current grid conditions.
China's Dual-Track Energy Reality
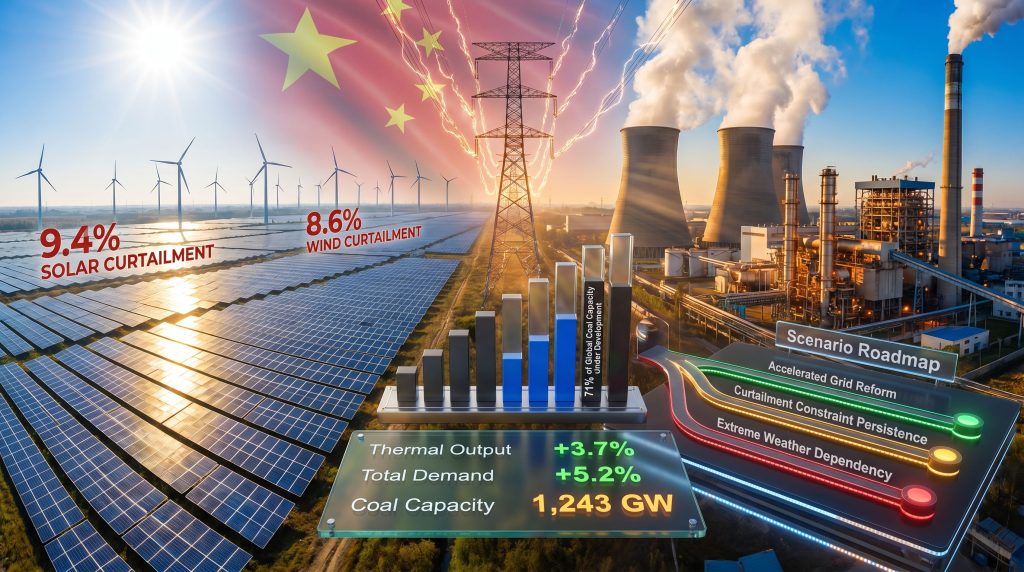
China simultaneously holds 71% of global coal capacity currently under development while leading the world in solar panel installations. This is not a contradiction of policy intent but rather a deliberately engineered hedge against grid vulnerability. Furthermore, with 1,243 GW of operating coal capacity serving as the backbone of grid stability, policymakers face a structural dilemma: the grid architecture cannot yet function without thermal baseload, even as renewable capacity scales at record pace.
The scale of the coal infrastructure pipeline is worth absorbing fully before any assessment of China's climate trajectory:
| Infrastructure Category | Scale (GW) |
|---|---|
| Operating coal capacity | 1,243 |
| Coal capacity under active development | 501 |
| Non-fossil capacity under construction | 674 |
| Total fossil fuel capacity under construction | 237 |
These figures illustrate that construction pipelines for both fossil and clean energy are running in parallel rather than in sequence. Grid reform, not capacity additions, will determine which trajectory ultimately dominates. The broader implications for energy transition mining are consequently significant for commodity markets worldwide.
What Actually Drove the Q1 2026 Thermal Surge
Three Compounding Shocks Hit Simultaneously
The 3.7% rise in thermal power output during the first quarter of 2026 was not a linear outcome of any single factor. Instead, three separate shocks to the supply-demand balance converged within the same reporting window, each amplifying the others.
Key Q1 2026 Power Sector Movements:
| Generation Source | Q1 2026 Change | Context |
|---|---|---|
| Thermal (fossil fuel) output | +3.7% | First annual rise after 2025's 1% decline |
| Wind generation | -2.9% | Despite record 2025 turbine installations |
| Nuclear generation | -3.8% | Maintenance shutdowns across multiple facilities |
| Total electricity demand | +5.2% | Heavy industry, EV charging, data centres |
| Average national wind speed (March 2026) | -13% | Reported by Huafeng Innovation Research Institute |
The Weather Variable That Cascades Through the System
The 13% drop in average national wind speed during March 2026, documented by the Huafeng Innovation Research Institute, deserves closer technical scrutiny than headline figures typically receive. Wind power output follows a cubic relationship with wind speed, meaning that a relatively modest percentage decline in wind velocity produces a disproportionately large reduction in generation potential. A 13% wind speed reduction translates theoretically to a reduction in available wind power of roughly 34% before accounting for turbine cut-in thresholds and grid dispatch rules.
This physical reality explains a paradox that puzzles casual observers: despite China adding a record number of turbines during 2025, wind generation actually fell 2.9% in Q1 2026. The machines were present. The fuel was not. According to Reuters reporting on renewables and fossil-fuelled power, 2025 had already marked the first annual drop in a decade before this Q1 reversal emerged.
Trivium China's energy analysts observed that limited wind resources across key generation regions, combined with extensive nuclear maintenance schedules, were the primary contributors to thermal power's resurgence, characterising Q1 2026 as a reflection of compounding systemic vulnerabilities rather than any single extraordinary event.
Structural Demand Growth That Isn't Going Away
On the demand side, the 5.2% growth in electricity consumption during Q1 2026 reflects structural shifts rather than cyclical fluctuations. Ember analyst Matt Ewen attributed the surge to three converging accelerants:
- Heavy industrial activity, likely driven by manufacturing expansion and commodity processing
- EV charging infrastructure proliferation, as China's massive electric vehicle fleet requires exponentially more charging capacity as adoption scales
- Data centre construction and operation, with Chinese technology companies expanding server infrastructure at a pace that has made the sector one of the fastest-growing electricity consumers in the national grid
Each of these demand categories carries a compounding characteristic: EV adoption and data centre construction are not cyclical — they are structural. The electricity appetite they create will grow regardless of seasonal weather patterns, meaning the pressure on China's generation mix will intensify rather than normalise.
The Curtailment Crisis: Clean Energy Being Wasted at Scale
What Curtailment Numbers Actually Reveal
What is renewable energy curtailment? Curtailment occurs when grid operators reduce or halt wind and solar generation because the transmission network cannot physically absorb the electricity being produced at that moment. Rather than flowing to consumers, that generation potential is simply lost. In January and February 2026, China wasted 9.4% of its solar output and 8.6% of its wind output, sharp increases from 6.1% and 6.2% respectively during the same period in 2025.
These percentage increases represent something qualitatively significant: curtailment is accelerating faster than capacity is being added. The more aggressively China builds wind and solar installations, the more generation is being wasted, because the grid infrastructure and market rules governing dispatch have not kept pace. As analysts tracking electrification and decarbonisation have noted, physical infrastructure investment is advancing faster than the regulatory architecture can absorb.
Curtailment Rate Comparison:
| Energy Source | Jan–Feb 2025 | Jan–Feb 2026 | Change |
|---|---|---|---|
| Solar PV | 6.1% | 9.4% | +3.3 percentage points |
| Wind | 6.2% | 8.6% | +2.4 percentage points |
The Policy Tolerance That Enables Inefficiency
A detail rarely discussed in mainstream energy reporting is that China's regulatory framework explicitly permits curtailment rates of up to 10% without triggering mandatory corrective action. This policy threshold was designed with a pragmatic logic: by accepting a defined level of waste, regulators allow renewable capacity additions to proceed at maximum pace without waiting for full transmission and storage infrastructure to be built first.
The assumption embedded in this design is that the waste is temporary. Grid infrastructure investment eventually catches up, curtailment rates decline, and the accumulated installed capacity begins delivering at closer to full potential. However, whether that assumption holds depends entirely on the speed of grid reform, which Ember analyst Muyi Yang has identified as the critical bottleneck.
As Yang's analysis makes clear, the exponential growth phase of Chinese wind and solar installations has begun to plateau not because of reduced ambition or manufacturing constraints, but because integration limitations are now shaping what can actually be absorbed and used. Physical infrastructure is advancing rapidly, but the regulatory frameworks governing electricity dispatch, pricing, and inter-regional trading remain calibrated for a coal-dominated system architecture.
China's Grid Architecture: The Real Constraint
Provincial Silos Within a National Grid
China operates two national grid companies in theory. In practice, electricity dispatch is substantially managed at a provincial level, creating dozens of semi-autonomous energy fiefdoms with limited incentive to export surplus renewable power or absorb imports from neighbouring regions. This fragmentation is particularly damaging for wind and solar deployment because China's renewable resources are geographically concentrated in regions far from its major demand centres.
The abundant wind resources of Inner Mongolia and Xinjiang must travel thousands of kilometres to reach the industrial and population demand centres of Guangdong, Zhejiang, and Jiangsu. High-voltage direct current transmission corridors are being built to bridge these distances, but dispatch scheduling rules governing how power flows across provincial boundaries remain institutionally slow to modernise.
The 1,243 GW Coal Fleet Cannot Be Switched Off
Understanding China's thermal dependency requires accepting an uncomfortable engineering reality: the 1,243 GW coal fleet does not merely generate electricity. It provides frequency regulation, voltage support, and inertia services that maintain grid stability in ways that intermittent renewables, without complementary storage and grid-forming inverter technology, currently cannot fully replicate.
Coal plants operating at minimum load levels are not simply burning fuel wastefully. They are providing grid stability services for which no adequate market mechanism currently compensates renewable operators or storage systems. Until those services can be monetised through reformed market structures, coal plants retain an institutional advantage in dispatch scheduling that their pure economics would not justify.
China's Emissions Trajectory and the Pre-2030 Commitment
Why Q1 2026 Is a Structural Warning
Electricity generation represents China's single largest source of greenhouse gas emissions. When thermal output rises 3.7% in a quarter following what had appeared to be a genuine inflection point in 2025's 1% annual decline, analysts must assess whether the reversal reflects temporary weather disruption or deeper structural vulnerability.
The evidence from Q1 2026 suggests both factors are operating simultaneously, and critically, the structural factors do not self-correct with improved weather conditions. High curtailment rates will persist as long as grid integration constraints remain unresolved. Demand growth from EVs and data centres will continue accelerating. Nuclear maintenance schedules create predictable generation gaps. Wind speed variability is inherent to meteorological cycles.
China has committed to peaking carbon dioxide emissions before 2030. Whether the China fossil fuel power comeback due to low wind and grid constraints represents a temporary detour or a signal of delayed peaking depends on the velocity of grid reform rather than the pace of further renewable installation.
The next major ASX story will hit our subscribers first
Three Scenarios for China's Power Mix Through 2030
The pathway China's power sector follows through the decade will be determined by a small number of critical policy and infrastructure variables. Investors, commodity markets, and climate analysts should track these variables rather than monthly generation statistics in isolation.
Scenario Comparison Framework:
| Scenario | Key Enabler | Coal Trajectory | Emissions Outcome |
|---|---|---|---|
| Accelerated Grid Reform | Market liberalisation and storage scale-up | Gradual structural displacement | Emissions peak before 2028 |
| Curtailment Constraint Persistence | Regulatory inertia dominates physical investment | Flat or moderate growth maintained | Emissions plateau post-2027 |
| Extreme Weather Dependency | Climate variability intensifies frequency of supply gaps | Cyclical surges around structural baseline | Delayed peaking, potentially post-2030 |
Scenario 1: Accelerated Grid Reform
If China's electricity market liberalisation advances at pace — including provincial trading mechanism reform, expanded inter-regional high-voltage transmission, and large-scale battery storage deployment achieving meaningful cost reductions — curtailment rates could fall back toward 3–4% by 2028. Under this pathway, renewable generation captures an increasing share of demand growth and thermal plants are progressively relegated to peaking roles operating at declining utilisation rates. Emissions peak before 2028 under this trajectory.
Scenario 2: Curtailment Constraint Persistence
The more likely near-term scenario involves continued physical infrastructure investment outpacing regulatory reform. New transmission lines and storage systems are built, but provincial dispatch rules and market pricing mechanisms evolve too slowly for infrastructure to deliver its theoretical efficiency gains. Consequently, curtailment rates remain elevated in the 8–12% range, and thermal output neither grows significantly nor declines, as renewable additions offset demand growth but curtailment limits their full utilisation.
Scenario 3: Extreme Weather Dependency
A third trajectory acknowledges that climate variability itself creates structural demand for thermal flexibility. If the weather patterns observed in Q1 2026 — particularly the 13% wind speed reduction — become more frequent rather than episodic, then China's thermal fleet cannot be decommissioned or significantly reduced in utilisation without risking supply security. According to Carbon Brief's analysis of fossil fuel power trends, clean energy had previously pushed fossil fuel power into reverse globally, making this potential regression all the more consequential. Emissions peaking could consequently be delayed well beyond 2030.
Implications for Global Commodity Markets
Thermal Coal Trade Flows and Seaborne Markets
China's fossil fuel power comeback has direct implications for global thermal coal trade flows. When domestic renewable generation underperforms relative to demand, Chinese utilities draw on coal imports to supplement domestic supply, particularly from Indonesia and Australia's Newcastle benchmark market. Q1 2026's thermal output surge represents a demand signal that seaborne coal markets absorbed in real time.
In the context of China steel and iron ore markets, thermal power fluctuations also carry downstream implications for industrial energy costs and production economics. Investors in thermal coal producers and shipping companies operating these trade routes should monitor China's curtailment statistics and wind generation data as leading indicators of import demand, rather than waiting for trade flow data to confirm shifts that have already occurred weeks earlier.
Grid Reform as the Investable Variable
For energy transition investors, the most consequential variable in China's power sector is not the pace of renewable installations — which is already well understood and priced into global supply chains — but the velocity of electricity market reform. Companies providing grid management technology, battery storage systems, high-voltage transmission equipment, and demand response solutions are positioned at the true bottleneck of China's energy transition.
Furthermore, the China iron ore outlook is directly intertwined with power sector dynamics, as industrial energy costs and grid reliability shape steel production economics at a fundamental level.
The structural insight that experienced energy sector analysts emphasise is that China's clean energy challenge has fundamentally shifted in nature. The manufacturing and installation challenge has largely been solved. The market design and grid architecture challenge has barely begun.
Frequently Asked Questions
Why did China's thermal power output increase in Q1 2026 despite record renewable installations?
Three compounding factors drove the increase: a 13% average wind speed reduction cut wind generation by 2.9% despite record installed capacity; nuclear output fell 3.8% due to maintenance shutdowns; and electricity demand grew 5.2% from heavy industry, EV charging, and data centre expansion. Renewable generation could not bridge the resulting supply gap.
What is causing elevated curtailment rates for wind and solar in China?
Curtailment rises when electricity generated by wind and solar plants cannot be absorbed by the transmission network or matched to demand patterns. China's grid was designed around dispatchable coal generation, and the scheduling, pricing, and inter-regional trading rules governing dispatch have not modernised fast enough to accommodate the scale of renewable additions. Solar curtailment reached 9.4% and wind curtailment reached 8.6% in January and February 2026.
How does China's coal capacity compare globally?
China accounts for approximately 71% of all coal-fired generation capacity currently under development worldwide, with 501 GW in its construction pipeline alongside an existing operating fleet of 1,243 GW. This scale is not replicated by any other national economy.
Can China still meet its pre-2030 emissions peaking targets?
The Q1 2026 data does not definitively rule out China meeting its pre-2030 commitment, but it does illustrate the structural vulnerabilities that make the pathway narrower than renewable installation data alone would suggest. Achieving the target requires grid reform and market design modernisation to proceed in parallel with continued physical infrastructure investment. The role of critical minerals energy transition supply chains will also be pivotal in enabling the storage and transmission technologies required.
What grid reforms is China currently implementing?
China is actively expanding battery energy storage systems, constructing additional inter-regional high-voltage direct current transmission corridors, and piloting provincial electricity market trading mechanisms. However, the regulatory frameworks governing dispatch sequencing and inter-provincial power trading remain the primary implementation bottleneck.
How does EV and data centre demand affect China's power mix?
Both sectors create structural, non-cyclical demand additions. China's EV fleet requires rapidly expanding fast-charging infrastructure that draws significant grid load particularly during peak evening hours. Data centres, driven by artificial intelligence computing expansion and domestic cloud adoption, represent some of the fastest-growing new electricity consumers in the national grid. Together these sectors contributed meaningfully to the 5.2% demand growth recorded in Q1 2026.
Key Structural Takeaways
The dynamics exposed in China's first quarter 2026 power generation data carry lessons that extend beyond any single quarterly reporting period. The China fossil fuel power comeback due to low wind and grid constraints is, in essence, a systems-level problem requiring systems-level solutions.
- Weather-driven generation shortfalls, particularly wind speed variability, can rapidly erode renewable output gains even when installed capacity sits at record levels
- Curtailment rates above 8–9% represent a systemic integration failure that directly translates into additional fossil fuel combustion, regardless of how many turbines or solar panels have been installed
- The 1,243 GW coal fleet functions as an irreplaceable grid stability buffer under current market architecture and cannot be displaced by capacity additions alone
- Regulatory frameworks governing electricity dispatch and pricing remain fundamentally misaligned with the physical infrastructure being constructed
- The 3.7% Q1 2026 thermal output increase should be interpreted as a structural vulnerability indicator rather than a policy reversal or political signal
- Grid reform velocity, not renewable installation pace, will determine whether China's emissions trajectory bends meaningfully before 2030
This article contains analysis and scenario projections that involve assumptions about future policy, technology, and market conditions. Readers should conduct independent research before making investment or business decisions based on energy sector forecasts. All statistics referenced are sourced from Bloomberg reporting published April 29, 2026 via Mining Weekly, citing National Energy Administration industrial output data, Huafeng Innovation Research Institute wind speed analysis, Trivium China energy analysis, and Ember energy research.
Want to Track the Commodity Opportunities Emerging From China's Energy Transition in Real Time?
China's grid constraints and thermal power resurgence are reshaping demand signals across coal, critical minerals, and energy transition commodities — and Discovery Alert's proprietary Discovery IQ model instantly identifies significant ASX mineral discoveries linked to these structural shifts, delivering actionable alerts before the broader market reacts. Explore historic discoveries and their returns to understand the scale of opportunity, then begin a 14-day free trial to position ahead of the next major find.