June 22, 2026
The Quiet Revolution in Global Energy Trade
The world's energy system does not reorganise itself gradually. It lurches forward in response to compounding pressures, and those lurches create windows of extraordinary commercial activity. Right now, three distinct forces are colliding simultaneously: the insatiable power appetite of artificial intelligence infrastructure, the geopolitical shock radiating from conflict in the Middle East, and a fragile but consequential diplomatic thaw between the world's two largest economies. The result is a surge in China green exports to the US that demands careful interpretation, because the surface-level numbers tell only part of a far more complex story.
When big ASX news breaks, our subscribers know first
The Three Forces Converging on Global Clean-Tech Demand
AI Infrastructure: An Energy Problem Disguised as a Technology Story
Artificial intelligence is, at its core, an energy consumption problem. Training large-scale models and running inference workloads across hyperscale data centres requires continuous, reliable, and scalable power. A single large AI training cluster can consume as much electricity as tens of thousands of homes, and the pace of deployment is accelerating rapidly across the United States, Europe, and Southeast Asia.
This creates a cascading demand effect throughout clean-tech hardware supply chains. Solar installations feed power purchase agreements that backstop data centre operations. Furthermore, battery storage expansion smooths intermittent renewable generation into the dispatchable power that compute workloads require. The result is that AI infrastructure spending is quietly becoming one of the most significant indirect demand drivers for solar panels and lithium-ion batteries globally.
What makes this dynamic particularly consequential is its structural, rather than cyclical, nature. Unlike inventory pre-loading ahead of tariff changes, the power requirements of AI infrastructure compound over time. Every new data centre commissioned locks in decades of energy procurement decisions.
The Strait of Hormuz Shock: Repricing Fossil Fuel Dependency
The conflict that erupted between the United States, Israel, and Iran in late February 2026 introduced a variable that energy markets had long modelled as tail risk but rarely priced in fully: sustained disruption to the Strait of Hormuz, through which approximately one-fifth of global oil flows had historically moved.
For energy planners and procurement managers across South Asia, Europe, and the broader Indo-Pacific, this was not an abstract threat. It was a live demonstration of the cost of fossil fuel dependency concentrated in a single geographic chokepoint. According to analysis from Bloomberg, the rational response — accelerating procurement of solar generation capacity and battery storage as a hedge against oil market volatility — translated almost immediately into increased import activity from the world's dominant supplier of that hardware: China.
This geopolitical repricing of renewable energy is distinct from policy-driven demand. It does not require regulatory mandates or subsidy frameworks. Consequently, it is driven by self-interest at the national and corporate level, which makes it more durable in the short to medium term than incentive-dependent procurement cycles.
The Xi-Trump Summit: Tactical Thaw, Not Structural Realignment
May 2026's bilateral summit between President Xi Jinping and President Donald Trump, the first visit by a sitting US president to China in nearly nine years, created a short-term diplomatic window that trade flows responded to immediately. The subsequent export data needs to be understood in this context.
Analysts at the Centre for Research on Energy and Clean Air noted that May's export performance captured two simultaneous forces: tactical inventory pre-loading by buyers uncertain about the durability of any policy thaw, and genuine underlying demand growth within the US energy system, making it difficult to cleanly separate cyclical from structural demand signals.
Buyers who had been deferring procurement decisions under tariff uncertainty used the post-summit window to rebuild inventories and accelerate shipments. This front-loading behaviour is a well-documented phenomenon in trade economics and creates an important interpretive challenge: elevated import volumes in the short term may be followed by a demand vacuum once inventory targets are met.
China's Clean-Tech Export Numbers: What the Data Actually Shows
The May 2026 customs data released by Chinese authorities reveals a striking snapshot of export momentum across multiple green-technology categories.
| Export Category | Value (May 2026) | Year-on-Year Change | Volume Change |
|---|---|---|---|
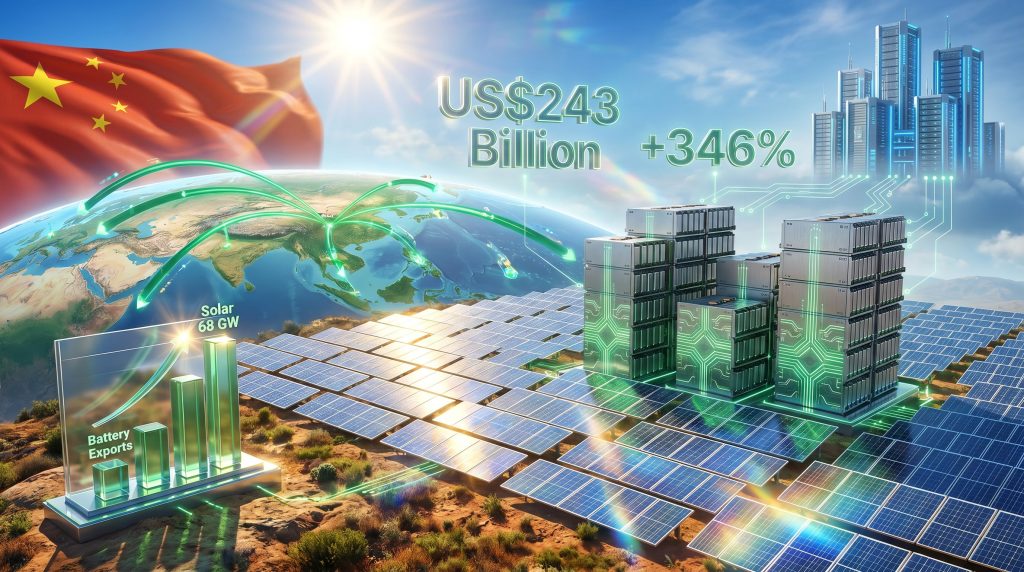
| Unassembled Photovoltaic Cells (US-bound) | US$39.96 million | +346% | +357% |
| Lithium-Ion Batteries (US-bound) | US$780 million | +20.8% | ~+20% |
| Lead-Acid Batteries (US-bound) | US$6.72 million | +151% | +253% |
| Solar Exports (Global, March) | 68 GW shipped | ~+100% (doubled) | N/A |
| Battery Exports (Global, March) | N/A | +44% | N/A |
| Total Clean-Tech Exports (12 months to March) | US$243 billion | N/A | N/A |
| China Total Exports to US (May) | N/A | +35.4% | Fastest since 2021 |
| Semiconductor Exports (May, YoY) | N/A | +110% | N/A |
| Overall China Export Growth (May, YoY) | N/A | +19.4% | N/A |
Critical Interpretive Note: The photovoltaic cell surge of 346% in value terms is dramatic, but the absolute dollar figure of US$39.96 million remains modest in the context of overall trade flows. This pattern is characteristic of low-base effects combined with inventory acceleration, rather than evidence of a durable structural shift in US import composition on its own.
The lithium-ion battery figure tells a more substantive story. At US$780 million for a single month, this category ranked among China's top five export products to the United States. Its 20.8% year-on-year growth reflects both genuine demand expansion and the scale at which Chinese battery manufacturing has embedded itself in US supply chains despite tariff pressures.
The broader picture of critical minerals and energy security underpins much of this momentum, as upstream material dependencies reinforce China's structural advantage across clean-tech categories.
Where China's Green Exports Are Actually Going
The US Market: Significant, But Not the Primary Story
While US-bound export figures dominate financial media coverage, the broader geographic picture reveals that Asia and Europe remain the primary volume destinations for Chinese solar panels and battery products. Tariff barriers in the United States are meaningfully higher, and procurement frameworks in many Asian and European markets are already structured around Chinese supply chain integration.
The US-China trade war impacts continue to shape these flows in ways that extend well beyond the current diplomatic thaw. The US figures matter because they signal recalibration at the margins, but they should not be mistaken for the core of China's clean-tech export machine.
The Global Picture: 68 GW of Solar in a Single Month
March 2026 data showing 68 gigawatts of solar exports shipped globally in a single month is arguably the more important data point for understanding China's industrial position. That figure represents approximately double the prior year's monthly volumes. It reflects the extraordinary scale at which Chinese manufacturing has expanded capacity, in some cases well ahead of current demand, creating significant downward pressure on global solar panel pricing.
| Demand Driver | Nature of Impact | Time Horizon | Primary Beneficiary Markets |
|---|---|---|---|
| AI Infrastructure Buildout | Structural, rising power and storage needs | Long-term | US, Europe, Southeast Asia |
| Iran Conflict / Strait of Hormuz | Cyclical, energy security repricing | Medium-term | Middle East, South Asia, Europe |
| US-China Trade Détente (Post-Summit) | Tactical, inventory pre-loading | Short-term | United States |
| Global Decarbonisation Mandates | Structural, policy-driven procurement | Long-term | Global |
China's Competitive Moat in Clean-Tech Manufacturing
Scale, Cost Curves, and Vertical Integration
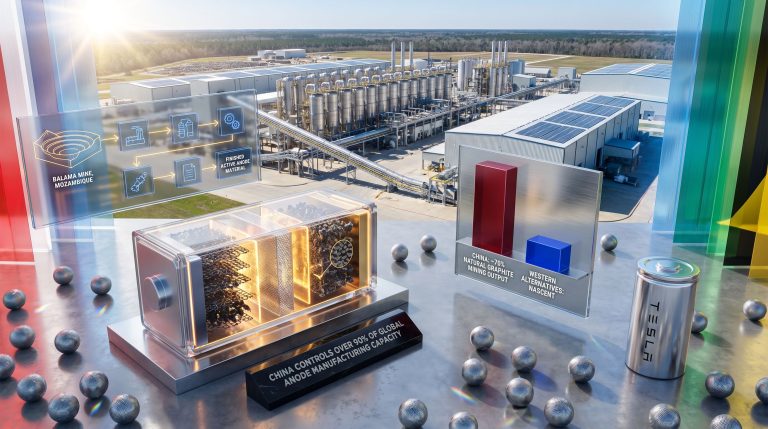
China's dominance in clean-tech manufacturing is not accidental. It reflects decades of industrial policy, aggressive capacity investment, and the construction of deeply integrated supply chains that competitors cannot replicate quickly. From polysilicon refining through to finished solar module assembly, Chinese manufacturers control a disproportionate share of every value-adding stage in the solar supply chain.
The battery sector tells a similar story. Chinese firms have secured upstream lithium, cobalt, and nickel supply agreements across multiple continents. Their cell manufacturing cost curves sit materially below those of Western and South Korean competitors. This cost advantage compounds over time as Chinese manufacturers continue to invest in next-generation cell chemistries, including lithium iron phosphate configurations that have displaced higher-cost alternatives in many stationary storage applications.
In addition, the Chinese battery recycling breakthrough announced earlier this year has further reinforced the domestic supply chain loop, reducing dependence on virgin raw material inputs and tightening China's competitive grip across the full battery value chain.
The Semiconductor Surge as a Parallel Signal
The 110% year-on-year growth in Chinese semiconductor exports during May 2026 is a data point that deserves attention beyond the green energy conversation. It suggests that China's broader industrial export momentum is not confined to energy hardware but reflects a wider acceleration across technology-intensive manufacturing categories.
For investors assessing China's industrial trajectory, this convergence across multiple export sectors is a meaningful signal about the depth of China's manufacturing competitiveness. Furthermore, China's export restrictions on rare earth materials have added another layer of strategic leverage that amplifies China's position across both clean-tech and semiconductor supply chains simultaneously.
Key Risks That Could Interrupt the Surge
Several factors could quickly alter the current trajectory:
- Tariff reinstatement risk: The post-summit trade thaw is fragile. Any deterioration in diplomatic relations could prompt rapid policy reversal, and buyers who front-loaded inventory would face an extended period of reduced procurement as that inventory is drawn down.
- Inventory overhang dynamics: When buyers pre-load aggressively, the subsequent demand vacuum can be prolonged. This is a well-documented pattern following tariff-driven trade surges and represents a genuine risk to near-term export continuity.
- Iran conflict resolution: A diplomatic resolution to the Iran conflict, while broadly positive for global stability, would reduce the energy security premium that has been accelerating renewable procurement as a fossil fuel hedge.
- US domestic manufacturing policy: The Inflation Reduction Act continues to direct capital toward domestic clean-tech manufacturing capacity. As that capacity matures over a multi-year horizon, structural substitution of Chinese imports becomes a plausible medium-term scenario in specific product categories.
The next major ASX story will hit our subscribers first
Frequently Asked Questions
Why did photovoltaic cell exports to the US rise over 300% in a single month?
The surge reflects a combination of a low prior-year comparison base, inventory pre-loading ahead of potential tariff changes following the May 2026 diplomatic summit, and genuine underlying demand from US solar installation activity. The percentage increase is dramatic partly because the starting point was unusually depressed.
Are US tariffs still limiting Chinese clean-tech imports?
Yes. Tariff barriers remain meaningful, which is why the absolute dollar values of many green export categories remain modest despite large percentage increases. The post-summit period created a temporary window of reduced uncertainty, but the structural tariff architecture has not been dismantled.
Is AI genuinely driving battery and solar demand?
Indirectly, yes. AI data centres require continuous power, which drives investment in renewable generation and storage infrastructure. This is a structural, compounding demand signal that extends well beyond any single trade cycle. Mining.com's analysis of metals demand similarly confirms that geopolitical pressures are reinforcing this AI-driven baseline across multiple commodity categories.
Will the US-China trade thaw lead to sustained green import growth?
The honest answer is that current data cannot distinguish reliably between durable demand growth and tactical inventory cycles. Investors and analysts should monitor procurement data over at least two to three quarters before drawing conclusions about structural trend shifts.
What Investors and Policymakers Should Watch
The convergence of AI-driven power demand, geopolitical energy insecurity, and a temporary diplomatic thaw creates a compound demand environment that is historically unusual. Distinguishing between companies and supply chains benefiting from durable structural demand versus those riding a short-cycle inventory wave is the critical analytical task for anyone assessing exposure to global clean-tech trade flows.
Three specific indicators deserve close monitoring through the second half of 2026:
- Sequential monthly export data rather than year-on-year comparisons, to identify whether the post-summit inventory surge is giving way to a demand vacuum or sustaining at elevated levels.
- US solar installation rates as a proxy for genuine end-demand absorption, versus import volumes as a measure of supply-chain positioning.
- Diplomatic signals between Washington and Beijing on trade policy continuity, since the current export environment is partly contingent on the fragile post-summit détente holding.
China green exports to the US will continue attracting attention from investors and policymakers alike. However, the more interesting question for the coming years is not whether China will remain dominant, but which demand signals — among AI infrastructure growth, geopolitical energy insecurity, and diplomatic trade cycles — will prove most durable as drivers of that dominance. China's manufacturing scale, cost advantages, and supply chain integration represent structural competitive advantages that no combination of tariff policy and domestic manufacturing incentives can rapidly overcome.
This article contains forward-looking analysis and scenario projections based on available trade data and publicly reported information. It does not constitute financial or investment advice. Readers should conduct independent research before making any investment or procurement decisions.
Want to Stay Ahead of the Next Major Mineral Discovery Driving the Clean-Tech Boom?
As AI infrastructure, energy security concerns, and shifting trade flows reshape demand for lithium, solar, and battery technologies, Discovery Alert's proprietary Discovery IQ model instantly alerts subscribers to significant ASX mineral discoveries underpinning these supply chains — turning complex data across 30+ commodities into clear, actionable insights. Explore historic discoveries and their returns on Discovery Alert's dedicated discoveries page, and begin your 14-day free trial today to position yourself ahead of the market.