
July 21, 2026
Strategic supply chain risks have emerged as a defining characteristic of modern industrial economics, where single-region dependencies can trigger cascading disruptions across global manufacturing networks. The methanol industry exemplifies this vulnerability, as specialized production facilities concentrated in geopolitically sensitive regions control essential feedstock flows to the world's largest industrial consumer markets. China methanol imports disruption represents a critical example of how geopolitical tensions can rapidly transform established supply relationships and create widespread market instability. Understanding these dynamics requires examining not just current supply patterns, but the underlying technological, economic, and geographic factors that create structural dependencies in chemical supply chains.
The Strategic Importance of Methanol in Industrial Manufacturing
Methanol functions as a fundamental building block across multiple industrial sectors, with global production capacity reaching approximately 130-135 million tonnes annually. This chemical compound serves as the primary feedstock for formaldehyde production through catalytic oxidation processes, with roughly 40-45% of global methanol consumption directed toward formaldehyde and downstream urea-formaldehyde resins essential for construction materials and wood products.
The methanol-to-olefins (MTO) technology represents a critical alternative pathway for producing ethylene and propylene, fundamental building blocks for plastics and polyester manufacturing. This conversion process offers strategic supply diversification from traditional oil-based naphtha cracking, enabling manufacturers to reduce dependence on petroleum feedstocks while maintaining production flexibility.
Industrial Application Categories:
• Chemical Synthesis: Formaldehyde, acetic acid, and MTBE production requiring consistent quality specifications
• Marine Fuel Applications: IMO 2030-compliant renewable marine fuel when produced from biomass sources
• Synthetic Fuel Production: Intermediate for dimethyl ether (DME) and methyl tertiary-butyl ether (MTBE) gasoline blending
• Textile Manufacturing: Synthetic fiber production including polyester and acrylic materials dependent on methanol-derived chemicals
The paint and coatings industry relies heavily on methanol as a solvent component in architectural and industrial formulations, while composite materials manufacturing depends on methanol-derived phenol-formaldehyde resins. These applications demonstrate the compound's versatility across sectors ranging from construction to automotive manufacturing.
Furthermore, production pathways utilise diverse feedstock sources, with coal-to-methanol and natural gas-based production each representing approximately 45-50% of global capacity. Biomass and green methanol production remains below 2% of current capacity but represents an emerging segment driven by sustainability requirements and renewable energy storage applications.
When big ASX news breaks, our subscribers know first
China's Dominance in Global Methanol Consumption
China accounts for approximately 65-70% of worldwide methanol demand, creating an unprecedented concentration of consumption in a single national market. Despite maintaining the world's largest methanol production capacity at approximately 40-45 million tonnes annually, China requires substantial imports to satisfy total consumption requirements estimated at 45-50 million tonnes per year.
China Methanol Imports Disruption Timeline:
| Year | Import Volume | Change | Market Impact |
|---|---|---|---|
| 2024 | 1.47 million tonnes | Baseline | Stable supply patterns |
| 2025 | 814,691 tonnes | -44.5% decline | Supply constraint indicators |
| 2026 | Projected further decline | Ongoing | China methanol imports disruption accelerating |
This dramatic reduction in import volumes reflects supply chain vulnerabilities materialising even before current Middle East tensions escalated. The geographic distribution of China's domestic production creates structural supply-demand mismatches between inland coal-based production facilities and coastal industrial consumption centres.
Coal-to-methanol facilities concentrate in Shanxi Province (25-30% of national capacity), Inner Mongolia (20-25%), and Ningxia (15-20%), while consumption centres cluster in Jiangsu, Zhejiang, Shandong, and Guangdong provinces. Consequently, this geographic separation necessitates either costly inland transportation or coastal import dependency to serve eastern industrial regions.
Domestic Production Constraints:
• Energy Intensity: Coal-to-methanol requires 7-8 tons of coal per ton of methanol produced
• Water Requirements: 5-8 tons of water per ton of methanol, creating constraints in water-scarce inland provinces
• Transportation Costs: Inland shipping adds 300-500 yuan/ton premium versus coastal import pricing
• Environmental Regulations: Increasing scrutiny under carbon intensity standards limiting expansion
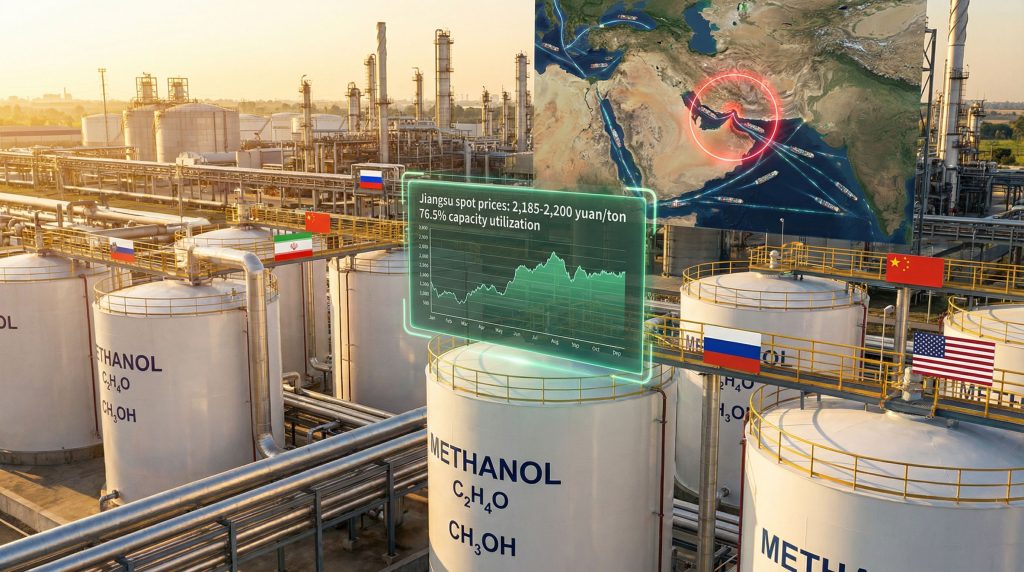
Current capacity utilisation rates for coal-to-methanol facilities operate at approximately 76.5%, indicating limited surge capacity availability during supply disruptions. Port storage infrastructure at major facilities including Shanghai, Ningbo-Zhoushan, Qingdao, and Guangzhou reached peak capacity of 1.6 million tons in late 2025 but has since declined as disruption patterns intensified.
Regional pricing disparities have widened significantly, with Jiangsu spot prices increasing 1.74% to 2,185-2,200 yuan/ton by February 2026. The differential between inland and coastal pricing has expanded to 300-500 yuan/ton during supply constraint periods, reflecting the premium required for alternative supply sources.
Geopolitical Vulnerabilities in Global Trade Routes
The Strait of Hormuz controls approximately 35-45% of global seaborne methanol exports, creating a critical chokepoint for international supply chains. This narrow waterway, through which roughly 21 million barrels per day of petroleum products transit, represents one of the world's most strategically significant shipping corridors for chemical commodities.
Key Shipping Route Vulnerabilities:
• Strait of Hormuz: 1-2 days normal transit time; disruptions affecting 35-45% of seaborne methanol
• Red Sea Corridor: Current security concerns adding 10-20 additional days per transit
• Suez Canal Route: 8-12% of methanol exports utilise this pathway for European markets
• Panama Canal Constraints: Draft restrictions reducing Atlantic-Pacific capacity by 15-20%
Alternative routing through the Cape of Good Hope adds 10-15 days to normal transit times while increasing shipping costs by approximately 40-50%. This economic penalty creates a cost threshold that typically requires price premiums of 25% or higher to justify rerouting, making alternative pathways economically viable only during severe supply disruptions.
However, the concentration of production capacity within geopolitically sensitive regions amplifies supply chain risk exposure. According to recent analysis, extended disruptions to Strait of Hormuz transit could significantly impair Chinese methanol access due to structural dependence on Persian Gulf suppliers.
Historical Disruption Precedents:
The 2019 Strait of Hormuz tanker incidents demonstrated how regional tensions translate into shipping cost premiums of 3-5%, while the 2021 Suez Canal Ever Given blockade showed how six-day disruptions can delay millions of tons of cargo equivalent.
Current Red Sea security situations have forced rerouting of European-bound methanol shipments, creating cascading effects on global supply allocation patterns. These disruptions highlight the interconnected nature of global shipping networks where regional conflicts can trigger worldwide supply chain adjustments, demonstrating how US‑China trade impacts contribute to broader supply chain vulnerabilities.
Iran's Strategic Position in Global Markets
Iran maintains the second-largest methanol production capacity globally, with annual output capability of approximately 4.5-5.0 million tonnes. This production capacity leverages Iran's substantial natural gas reserves of 33-34 trillion cubic meters, providing significant feedstock cost advantages over competitors utilising coal-based or higher-cost natural gas sources.
Iran's Production Economics:
| Cost Component | Iran Advantage | Global Average | Savings |
|---|---|---|---|
| Natural Gas Feedstock | USD $0.50-1.50/MMBTU | USD $3-8/MMBTU | 25-35% lower |
| Total Production Cost | 20-30% below average | Industry baseline | Significant margin |
| Export Pricing | 10-20% discount capability | Market rates | Competitive edge |
Despite representing only 3.5-4.0% of global production capacity, Iran's strategic location and cost structure enabled it to capture substantial market share in Asian markets, particularly China. Historical export patterns showed Iran directing 70-80% of methanol exports to China, with Chinese imports from Iran reaching 1.47 million tonnes in 2024.
The dramatic decline to 814,691 tonnes in 2025 represents not just reduced Iranian supply, but fundamental disruption of established supply relationships. This reduction coincided with increasing geopolitical tensions affecting Persian Gulf shipping routes and bilateral trade relationships.
Strategic Integration Advantages:
• Petrochemical Complex Integration: Iranian methanol facilities often connect with broader petrochemical operations, enabling economies of scale
• Geographic Positioning: Direct access to Asian markets via Persian Gulf shipping routes
• Feedstock Security: Domestic natural gas reserves providing long-term supply certainty
• Technology Infrastructure: Established methanol production technology and operational expertise
Iran's position as a major Chinese supplier created dependencies that extend beyond simple commodity trading relationships. In addition, the integration of Iranian methanol into Chinese industrial supply chains requires consistent quality specifications and reliable delivery schedules that alternative suppliers may struggle to replicate immediately.
Current Supply Chain Disruption Patterns
China methanol imports disruption manifests through multiple indicators beyond simple volume reductions. Price volatility has surged across regional markets, with Jiangsu spot prices demonstrating increased sensitivity to supply uncertainty signals. The 1.74% price increase to 2,185-2,200 yuan/ton in February 2026 reflects broader market tension extending beyond immediate supply availability.
Immediate Market Impact Categories:
| Impact Type | Severity Level | Geographic Focus | Duration Estimate |
|---|---|---|---|
| Iranian Export Terminals | Severe | Persian Gulf | 4-8 weeks |
| Regional Storage Hubs | Variable | UAE, Kuwait | Ongoing assessment |
| Shipping Route Delays | Moderate to Severe | Red Sea, Hormuz | Variable |
| Price Volatility | High | Global markets | Extended period |
Port inventory levels have declined from record highs, indicating both reduced inflow and sustained industrial demand pressure. The drawdown from 1.6 million tons peak storage reflects not just supply constraints but also strategic inventory positioning by industrial consumers anticipating continued disruptions.
Operational Adjustment Patterns:
• Production Scheduling: Industrial consumers optimising capacity utilisation during constraint periods
• Quality Management: Sourcing challenges maintaining feedstock specifications across diverse suppliers
• Logistics Planning: Alternative routing adding complexity and cost to delivery networks
• Contract Modifications: Force majeure provisions and price adjustment mechanisms being activated
Coastal versus inland pricing disparities have widened beyond typical transportation differentials, reaching 300-500 yuan/ton premiums. This expansion reflects not just shipping costs but risk premiums associated with supply uncertainty and alternative sourcing requirements, highlighting how tariffs impact markets alongside geopolitical tensions.
The disruption extends beyond immediate price impacts to affect production planning across downstream industries. Chemical manufacturers dependent on consistent methanol feedstock face decisions between inventory accumulation, alternative sourcing, or production curtailment strategies.
Alternative Supply Source Development
Emerging supplier diversification strategies focus on non-Persian Gulf production sources, though each alternative presents distinct logistical and economic challenges. Russian Federation methanol exports targeting Asian markets have increased, though sanctions considerations limit some trade relationships and financing mechanisms.
Alternative Supplier Analysis:
• United States Gulf Coast: Shale gas-based production expansion offering competitive economics
• Trinidad and Tobago: Atlantic Basin supply suitable for European redistribution patterns
• Australia: Potential LNG-linked methanol production leveraging existing gas infrastructure
• Qatar: Established methanol capacity though geographically proximate to current disruption zones
Transportation economics significantly affect alternative supplier viability. Atlantic Basin suppliers face 35-50 day transit times to Asian markets compared to 14-18 days from Persian Gulf sources. This extended shipping duration requires higher inventory positioning and increases working capital requirements for importers.
Domestic Capacity Optimisation Strategies:
Coal-to-methanol facilities operating at 76.5% utilisation rates possess limited surge capacity, but operational optimisation could potentially increase output by 15-20% during emergency conditions.
Investment in methanol-to-olefins (MTO) technology provides strategic supply diversification benefits while reducing import dependency for downstream chemical production. Green methanol initiatives, while representing minimal current capacity, offer long-term supply diversification aligned with sustainability objectives and renewable energy integration requirements.
Furthermore, the development of strategic stockpiling programmes represents another adaptation mechanism. Government-mandated inventory requirements for critical chemicals could provide buffer capacity during future supply disruptions, though such programmes require substantial storage infrastructure investment, particularly for critical raw materials supply.
The next major ASX story will hit our subscribers first
Long-Term Market Evolution Projections
Structural changes in global trade patterns will likely accelerate supply chain regionalisation trends, reducing dependence on single-source suppliers concentrated in geopolitically sensitive regions. The disruption exemplifies risks that extend across multiple chemical commodities and industrial sectors within a multi‑polar global economy.
Investment Implications by Sector:
• Chemical Manufacturing: Diversified sourcing strategies commanding premium valuations
• Transportation Infrastructure: Enhanced investment in storage and alternative routing capacity
• Technology Development: Accelerated adoption of alternative feedstock pathways and production technologies
• Regional Production: Domestic capacity expansion receiving strategic priority and potential policy support
New MTO facilities requiring additional 2+ million tonnes annually will compete with traditional import sources, potentially reducing import dependency over 3-5 year development timelines. Marine fuel applications expanding under IMO regulations create additional demand growth, while synthetic fuel production for aviation decarbonisation represents emerging consumption categories.
Future Demand Growth Categories:
| Application | Growth Rate | Timeline | Impact on Trade |
|---|---|---|---|
| MTO Facilities | 15-20% annually | 2026-2030 | Reduced import dependency |
| Marine Fuels | 25-30% annually | 2025-2030 | New consumption patterns |
| Green Methanol | 40-50% annually | 2026-2035 | Technology transition |
| Aviation Fuels | 10-15% annually | 2030-2040 | Long-term demand driver |
Technology substitution accelerating through alternative production pathways includes biomass-based methanol, carbon capture and utilisation (CCU) methodologies, and hydrogen-based synthesis routes. These technological developments could fundamentally alter supply chain dependencies over the next decade.
Risk Management Framework Implementation
Supply chain resilience requires comprehensive risk management approaches addressing geographic diversification, inventory optimisation, contract flexibility, and technology alternatives. Companies with established diversified sourcing strategies demonstrate superior operational resilience during geopolitical supply disruptions.
Geographic Diversification Strategies:
• Multi-Region Sourcing: Spreading supplier relationships across 3+ geographic regions
• Contract Portfolio Management: Balancing spot and term contract exposure for flexibility
• Transportation Route Diversity: Developing relationships with multiple shipping and logistics providers
• Strategic Partnership Development: Long-term relationships with alternative suppliers including capacity reservation agreements
Financial hedging approaches encompass commodity price risk management through futures contracts, currency exposure mitigation for international transactions, and political risk insurance for emerging market suppliers. Transportation cost hedging becomes particularly relevant when extended shipping routes create significant freight cost exposure, especially considering Trump tariff implications.
Inventory Management Optimisation:
Strategic buffer stock calculations must balance carrying costs against supply disruption risks, with optimal inventory levels varying by industry sector and consumption patterns.
Quality management systems require adaptation to accommodate feedstock from diverse suppliers while maintaining product specifications. This may necessitate additional testing capabilities, supplier qualification processes, and production flexibility to handle varying input characteristics.
Navigating Current Market Volatility
Short-term operational adjustments focus on immediate supply security while positioning for medium-term market evolution. Production scheduling optimisation during supply constraints requires coordination between procurement, operations, and customer management functions to maintain service levels while managing costs.
Immediate Response Priorities:
| Time Horizon | Priority Actions | Risk Mitigation | Investment Focus |
|---|---|---|---|
| 0-6 months | Emergency sourcing, inventory optimisation | Supply diversification | Working capital flexibility |
| 6-18 months | Contract renegotiation, logistics restructuring | Alternative routing development | Infrastructure adaptation |
| 18+ months | Technology investment, capacity expansion | Domestic production capability | Long-term sustainability |
Customer communication strategies require transparency regarding pricing adjustments and delivery timeline modifications while maintaining relationship stability. The disruption affects multiple supply chain participants simultaneously, creating opportunities for collaborative risk management approaches.
Alternative transportation modal options include increased rail transportation for inland distribution, coastal shipping alternatives, and pipeline infrastructure where available. These options typically involve higher costs but provide supply security benefits during disruption periods.
Meanwhile, strategic planning considerations extend beyond immediate supply replacement to encompass technology investment decisions, facility location planning, and long-term supplier relationship development. Companies investing in domestic production capability or alternative technology pathways may achieve competitive advantages as supply chain regionalisation accelerates.
Global Chemical Market Implications
The China methanol imports disruption signals broader transformation in global chemical supply chains, with accelerated regionalisation trends affecting multiple commodity categories. Investment in domestic production capabilities receives renewed strategic priority as companies reassess supply chain vulnerabilities exposed by recent geopolitical developments.
Industry Transformation Drivers:
• Supply Chain Transparency: Enhanced visibility requirements for risk assessment and management
• Technology Innovation: Accelerated development of alternative production pathways and feedstock sources
• Policy Framework Evolution: Strategic reserve requirements and investment incentives for domestic capacity
• International Cooperation: Crisis management frameworks and information sharing mechanisms
Broader industry implications include increased investment in renewable feedstock development, enhanced focus on supply chain transparency and traceability, and growing importance of regional supply chain strategies. These trends extend beyond methanol to affect multiple chemical commodities and industrial sectors.
Policy and regulatory responses encompass strategic reserve requirements for critical chemical inputs, trade agreement modifications addressing supply security considerations, and investment incentives for domestic production capacity development. International cooperation frameworks for crisis management and supply chain coordination represent additional policy development areas.
However, the transformation toward resilient supply chain architectures requires sustained investment in technology, infrastructure, and supplier relationships. According to industry analysis, companies successfully navigating current volatility while positioning for long-term market evolution will likely achieve competitive advantages as the global chemical industry adapts to new geopolitical and economic realities.
Investment Perspective: Organisations demonstrating supply chain adaptability and strategic diversification capabilities may command premium valuations as investors increasingly prioritise operational resilience alongside traditional financial metrics.
Looking to Capitalise on Supply Chain Disruptions in Chemical Markets?
Discovery Alert's proprietary Discovery IQ model delivers real-time notifications on significant ASX mineral discoveries, instantly identifying companies positioned to benefit from global supply chain realignments and resource security trends. Discover why major mineral discoveries can generate substantial returns by exploring Discovery Alert's dedicated discoveries page, showcasing historic examples of exceptional market outcomes. Begin your 14-day free trial today to secure your competitive advantage in identifying the next wave of resource opportunities.