June 12, 2026

Why Silver's Supply Architecture Makes It Uniquely Vulnerable to Demand Shocks
Most commodity markets have a straightforward relationship between price signals and supply response. When prices rise, producers ramp up output. Silver does not work this way. Approximately 75% of global silver production emerges as a byproduct of copper and zinc mining, meaning that silver output is structurally tethered to base metal production cycles rather than silver-specific price incentives. This inelastic supply dynamic creates an asymmetric vulnerability: when demand surges unexpectedly, the market cannot simply dial up production to compensate.
That structural reality is now colliding with an unprecedented demand shock originating from China, compounding silver supply deficits that have persisted for six consecutive years. The resulting pressure on Western delivery infrastructure, particularly the COMEX exchange in New York, is generating the kind of physical market tension that precious metals analysts rarely encounter in practice.
The Six-Year Deficit That Rarely Gets Discussed
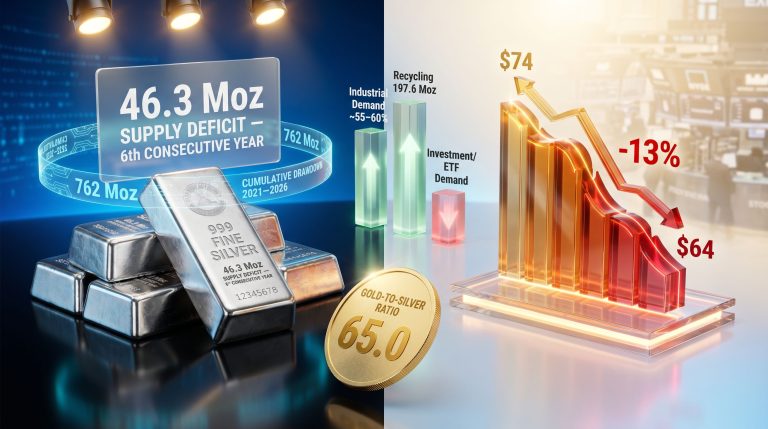
The silver market has recorded a structural supply deficit every year since 2019. Industrial consumption, driven by solar photovoltaic manufacturing, consumer electronics, electric vehicle components, and increasingly by artificial intelligence data centre infrastructure, has consistently outpaced newly mined and recycled supply. This deficit has been masked at the surface level by above-ground stockpiles and the recycling of existing silver, but those buffers are finite and are now being drawn upon in an environment of accelerating demand.
What makes the current situation materially different from prior deficit years is the simultaneous emergence of strategic demand from two global superpowers. Both the United States and China have formally classified silver as a critical strategic material, a designation that shifts the calculus from purely commercial purchasing to supply security behaviour. Furthermore, silver's dual demand from both industrial and investment sectors compounds this pressure considerably.
When a commodity earns strategic classification from competing superpowers simultaneously, commercial market dynamics are overlaid with national security imperatives. Procurement decisions that would otherwise be price-sensitive become price-inelastic, fundamentally altering market equilibrium.
When big ASX news breaks, our subscribers know first
China Silver Imports and the COMEX Silver Squeeze: Understanding the Connection
Breaking Down Q1 2026's Historic Import Volumes
The scale of China's silver purchasing in the first quarter of 2026 has no modern precedent. Monthly import volumes escalated sharply across the quarter, culminating in a single-month figure that market participants describe as the largest monthly inflow in at least two decades. China silver imports and COMEX silver squeeze dynamics have become inseparable topics for serious market analysts.
| Month | Import Volume (Tonnes) | Context |
|---|---|---|
| January 2026 | 320 | Elevated above seasonal norms |
| February 2026 | 470 | Record at the time of reporting |
| March 2026 | ~520–836 | Largest monthly inflow in over 20 years |
| Q1 2026 Total | Largest quarterly inflow on record |
Note: Specific monthly figures cited reflect analysis from market participants and media coverage of UBS research. Independent verification of Chinese customs data is advisable for investment decision-making.
From Net Exporter to Voracious Importer: A Complete Reversal
China exported approximately 5,100 tonnes of silver across 2025, functioning as a meaningful contributor to global supply. That dynamic has reversed dramatically. By early 2026, China had transitioned into the role of aggressive net importer, with government-level export licensing restrictions making it increasingly difficult for Chinese silver to flow outward regardless of price incentives.
This transition carries significant consequences for global supply chains:
- Silver that previously circulated through international markets from Chinese sources is no longer available
- Domestic Chinese demand, spanning AI infrastructure buildout, military applications, and electrical grid expansion, is absorbing production domestically
- The combination of China pulling silver in whilst simultaneously restricting outward flows creates a one-directional pressure valve on global inventories
Goldman Sachs has flagged that this transition risks fragmenting the global silver market into isolated regional submarkets, each with distinct pricing dynamics rather than a single unified global price. That fragmentation risk is precisely what makes the COMEX delivery situation so consequential. In addition, tariffs and silver markets are adding further complexity to an already strained supply chain.
What Is Driving Beijing's Appetite for Physical Silver?
China's aggressive silver purchasing reflects a convergence of industrial and strategic imperatives. According to analysis from Phoenix Refining, China's dominance over physical silver markets is expected to intensify throughout 2026:
- AI infrastructure demand: Silver's unmatched electrical conductivity makes it irreplaceable in the high-frequency circuit boards and cooling systems that underpin data centre buildout
- Military and defence applications: Silver is used in advanced weapons guidance systems, radar components, and electronic countermeasures
- Electrical grid modernisation: China's domestic grid expansion programme requires vast quantities of silver for connectors, switches, and high-capacity conductors
- Strategic stockpiling: Consistent with China's documented approach to critical material security, purchasing at scale during periods of geopolitical tension serves as a hedging mechanism against future supply disruption
The Hidden Supply Bottleneck: Sulfuric Acid and the Byproduct Problem
Why a Chemical Shortage Is Throttling Silver Output
Silver's dependence on copper and zinc mining creates an indirect but powerful vulnerability: both of those base metals require sulfuric acid for processing. Disruptions to global sulfuric acid supply, driven in part by the Iran conflict's impact on shipping through the Strait of Hormuz and by Chinese export restrictions on industrial chemicals, have created a cascading constraint that flows directly into silver production capacity.
Roughly 75% of the world's silver is extracted as a byproduct of copper and zinc mining, both of which depend heavily on sulfuric acid for ore processing. Supply disruptions to this chemical input translate directly into reduced base metal output, and reduced base metal output means reduced silver production, regardless of what silver prices are doing.
Why Silver Cannot Simply Be Mined on Demand
This structural byproduct dependency creates a supply response problem that distinguishes silver from most other commodities:
- Silver miners cannot simply increase silver production in response to a price signal without also increasing copper or zinc output
- Copper and zinc output decisions are driven by base metal pricing, not silver pricing
- When base metal markets slow, silver supply contracts even if silver prices are rising
- This inelastic supply response amplifies the impact of any demand acceleration
The practical implication is that the silver market cannot self-correct through standard price mechanisms in the short to medium term. Higher prices attract eventual new supply, but the lag time is measured in years rather than months.
Is COMEX Running Out of Silver? Decoding the Physical Inventory Crisis
The Paper-to-Physical Disconnect
COMEX operates on a system where futures contracts representing claims on physical silver vastly outnumber the actual silver available for immediate delivery. This leverage is normal under standard market conditions, but it creates fragility when physical delivery demands spike unexpectedly.
| COMEX Metric | Current Reading | Significance |
|---|---|---|
| Registered vault inventory | 76.88 million ounces | Deliverable supply available |
| Paper leverage ratio | 7.5:1 | Contracts outstanding versus physical |
| Coverage ratio | ~13.4% | Critically low deliverable buffer |
| March delivery demand | 41.5 million ounces | ~18% of total open interest |
A coverage ratio of approximately 13.4% means that if a meaningful fraction of futures holders simultaneously demanded physical delivery, the exchange would face a structural shortfall. This is not a theoretical concern: delivery demand in the March 2026 contract represented an unusually high proportion of open interest, generating real pressure on registered inventories.
What Is a Venue Squeeze and Why It Is Developing Now
A venue squeeze is distinct from a simple supply shortage. The issue is not that silver has ceased to exist globally, but that it is physically located in the wrong jurisdiction or is legally inaccessible for delivery against specific contract obligations. The current dynamic involves several reinforcing pressures:
- Chinese demand is pulling physical silver out of Western vaults at an unprecedented rate
- COMEX registered inventories are declining as last year's tariff-driven stockpile build is reversed
- Vault holders with registered silver are becoming increasingly reluctant to release metal into the delivery pool, likely anticipating further price appreciation
- A proportion of silver currently held in US vaults may be of Chinese origin, creating a potential legal complication under trade policy review
The UBS analysis, reported through Zero Hedge and widely discussed among precious metals market participants, characterises this tightness as driven by delivery condition changes, shifting metal flows, and trade policy confusion rather than a fundamental disappearance of supply. However, market analysts with a more structural view argue that framing supply dislocations as temporary or transitory has historically preceded significant price adjustments rather than logistical normalisations. Understanding silver short squeeze dynamics is therefore essential for anyone monitoring this market closely.
Section 301: The Legal Wildcard Overhanging Silver Supply
Section 301 of the US Trade Act grants authority to restrict trade flows with designated countries engaged in practices deemed unfair or harmful to US commercial interests. In the context of the current US-China trade environment, its application to silver creates a specific and underappreciated risk.
If Section 301 trade review provisions were applied aggressively to China in the context of silver, physical silver of Chinese origin currently held in US vaults could potentially be rendered ineligible for use in settling domestic delivery contracts. This would effectively reduce the usable silver supply in the United States overnight, without any metal physically leaving the country.
The analogy drawn by market analysts is to the treatment of Russian-origin assets following the 2022 sanctions framework, where assets nominally present in Western financial systems became legally inaccessible for standard commercial purposes. If a similar principle were applied to Chinese-origin silver, the coverage ratio problem on COMEX would deteriorate materially, and rapidly.
Key Price Levels Every Silver Investor Is Watching
Resistance Levels: The Ceiling Being Repeatedly Tested
Technical analysis of silver across multiple timeframes reveals a consistent and highly significant resistance cluster:
| Price Level | Timeframe Significance | Technical Interpretation |
|---|---|---|
| $88/oz | Daily chart | First near-term barrier above current trading |
| $93/oz | Daily chart | Secondary resistance zone |
| $95/oz | Daily, weekly, and monthly confluence | Major multi-timeframe resistance |
The $95 level deserves particular emphasis. When a resistance level appears independently on the daily, weekly, and monthly charts simultaneously, it represents a structurally stronger barrier than any single-timeframe reading would suggest. Multiple independent timeframes converging on the same price zone reflects decades of accumulated trading behaviour, institutional positioning, and historical price memory that combine to create genuine ceiling pressure.
Support Levels: Where the Floor Has Been Confirmed
| Price Level | Basis |
|---|---|
| $81/oz | Recent breakout level, now converted to support |
| $78/oz | Secondary support zone |
| $75/oz | Intermediate structural support |
| $72/oz | Long-term base confirmed by multiple bounces |
Silver's recent breakthrough of the $81 level is technically significant. When a market breaks decisively through a prior resistance level, that level typically transitions into support, as buyers who were waiting for confirmation now view it as an entry point. The $72 level has been tested and held on multiple occasions across the weekly chart, establishing it as a robust longer-term base.
The $95 Level: Why Multi-Timeframe Confluence Is the Defining Line
The analytical insight that distinguishes experienced technical analysts from casual chart readers is the concept of multi-timeframe confluence. A resistance level visible only on a daily chart is meaningful for short-term traders. A resistance level that appears identically on the daily, weekly, and monthly charts simultaneously carries a qualitatively different level of significance, representing the aggregated price memory of market participants operating across every time horizon simultaneously.
The $95 silver level currently satisfies all three major timeframes, making it, in the assessment of analysts who have studied this chart structure, the single most important price point in the silver market for the foreseeable future.
Could a Short Squeeze Push Silver Through $95?
The Anatomy of a Potential COMEX Silver Squeeze
A genuine short squeeze in the silver market would require the convergence of several specific conditions rather than any single catalyst:
- Continued physical withdrawal – China maintains or accelerates its import volumes into mid-2026
- Vault holder reticence – Registered silver holders in US vaults decline to release metal into the delivery pool, anticipating further appreciation
- Section 301 escalation – Trade policy actions restrict the commercial usability of Chinese-origin silver held domestically
- Geopolitical deterioration – US-China trade negotiations fail to resolve the delivery venue problem, extending the timeline of dislocation
The assessment from analysts with structural views of the market is that whilst the current situation may not independently generate enough force to push silver definitively above $95, it creates the conditions under which a relatively modest additional catalyst, whether geopolitical, regulatory, or demand-driven from India or Middle Eastern buyers, could tip the balance.
Is the Current Tightness Temporary or Structural?
This is the pivotal question dividing institutional analysis from more structurally oriented market commentary.
The institutional view (UBS): Current tightness reflects short-term delivery logistics disruption driven by trade policy confusion. Once tariff negotiations resolve, flows should normalise and the venue problem should dissipate within weeks to months.
The structural market view: Supply constraints described as temporary in precious metals markets have consistently resolved through significantly higher prices rather than through logistical correction. The LBMA has been through multiple episodes where official reassurances about adequate supply preceded sharp price adjustments. The current combination of a six-year structural deficit, dual strategic designation, Chinese export licensing restrictions, and byproduct supply constraints suggests the underlying imbalance extends well beyond any single geopolitical negotiating cycle.
Historical Precedents for Silver Market Dislocations
History provides instructive, if imperfect, analogies:
- The 1974 gold correction cycle followed by rapid price recovery demonstrated how quickly sentiment can reverse when structural supply factors reassert themselves
- The 2006 precious metals correction and subsequent consolidation period preceded a major bull leg in silver that carried prices substantially higher over the following years
- LBMA delivery stress episodes, where institutional communications emphasised sufficient global supply, have historically preceded rather than prevented sharp price adjustments
The next major ASX story will hit our subscribers first
The Cup Formation: What the Long-Term Chart Structure Projects
Understanding the Cup and Handle Pattern in Silver
Technical analysts tracking silver's long-term chart structure have identified the formation of what appears to be a significant cup and handle pattern developing across the weekly timeframe. The structural components of this pattern are:
- A sharp, disorderly decline from the prior high near $95 (the left wall of the cup, originating around early March 2026)
- An orderly recovery back toward the prior high (the right wall, currently in progress)
- A consolidation period below the $95 resistance (the handle, expected to form as the market approaches resistance)
- A potential breakout above $95 triggering the measured move projection
A critical technical nuance noted by analysts studying this formation: when a market makes a disorderly move lower followed by an orderly recovery, a subsequent breakout above the prior high tends to be disorderly to the upside. This asymmetry, disorder down followed by disorder up through the breakout level, is characteristic of markets with genuine supply-demand imbalances rather than purely speculative price movements.
What a Confirmed Breakout Above $95 Could Imply
| Scenario | Price Target | Basis |
|---|---|---|
| Measured move from cup depth | ~$125/oz | Breakout level plus cup depth (~$30) |
| Full cup and handle formation | ~$180/oz | Extended measured move following handle completion |
| Pre-breakout consolidation range | $85–$95/oz | Expected trading band pending catalyst |
Important Disclaimer: Technical price targets represent pattern-based projections derived from historical chart structure. They are not guaranteed outcomes and should not be treated as financial advice. The timeframe for any cup and handle completion in silver could span 18 months to two years based on current chart development, and patterns frequently fail to complete as projected.
Gold vs. Silver: Understanding the High-Beta Hierarchy
The Gold-Silver Ratio as a Leading Indicator
During the recent precious metals correction, an important signal emerged from the gold-silver ratio. Rather than collapsing as silver typically does relative to gold during risk-off episodes, silver held its ground. Thorough gold-silver ratio analysis reveals the ratio stabilised near recent levels rather than spiking, indicating that silver was not underperforming gold proportionally, which in historical context tends to be a constructive sign for subsequent silver performance.
With the ratio now appearing to trend toward the 50 area following recent silver strength, analysts note that historically, ratios moving toward and through 50 have been associated with phases of silver outperformance relative to gold.
The Investment Logic of the High-Beta Hierarchy
For investors seeking to express a bullish view on precious metals, understanding the leverage hierarchy is essential:
- Gold provides base exposure to monetary metals and macroeconomic hedging
- Silver functions as a high-beta version of gold with additional industrial demand drivers, tending to amplify gold's moves in both directions
- Mining equities (GDX and equivalents) amplify both silver and gold moves further, providing the highest leverage to the underlying metal but also the highest volatility
A notable current market signal: mining equities are outperforming gold on a relative basis, which has historically preceded broader precious metals strength. When silver and miners move together above gold's performance rate, it has typically signalled building momentum across the entire precious metals complex.
A useful framework attributed to market commentary: if you are bullish on gold, consider buying silver for additional leverage. If you are bullish on silver, the mining equities provide an additional amplification layer. The converse holds equally, amplification works in both directions.
Gold's Key Technical Levels for Reference
| Level | Significance |
|---|---|
| $4,830–$4,870 | Weekly chart support and resistance zone |
| $4,900 | Weekly close target signalling recovery momentum |
| $5,000 | Major resistance, base of prior trading range |
| $5,075–$5,100 | Clearing this zone opens path toward prior highs |
Gold's correction pattern is being compared by some analysts to the 1973 and 2006 correction templates, both of which involved corrections lasting approximately five months before resuming higher. If that template holds, gold may require a further five to six weeks to complete its base formation, during which silver's relative strength could continue to widen.
Copper's Breakout: What It Signals for the Metals Complex
Why Copper's Technical Pattern Is Significant for Silver Investors
Copper recently completed a textbook three-stage breakout sequence on the monthly chart:
- Initial breakout from a long base structure occurring in the December to January timeframe
- Pullback and successful retest of the breakout level, holding rather than reversing
- New high confirmed above the prior breakout zone, establishing a classically bullish technical structure
This breakout-retest-new high sequence is considered among the most reliable bullish technical patterns because it demonstrates that buyers are present at the prior breakout level when tested, preventing deterioration into a failed breakout. Copper completing this pattern whilst silver simultaneously exhibits multi-timeframe strength suggests a coordinated industrial metals demand cycle rather than isolated price movements.
Silver's industrial demand profile overlaps significantly with copper, both serving as critical inputs for electrical infrastructure, renewable energy systems, and advanced manufacturing. When copper leads, silver has historically followed.
Inflation's Role in the Multi-Year Silver Bull Case
Why Broadening Inflation Provides Structural Support for Commodities
Recent CPI data placed core inflation at 3.8%, with the composition of that inflation increasingly significant. Inflation is no longer concentrated in energy-related categories. It is spreading across a broader range of expenditure items, including:
- Auto and health insurance premiums resuming upward pressure
- Owners' equivalent rent contributing persistently
- Travel and transportation costs rising with fuel costs
- Food and agricultural commodities beginning to show base breakout patterns on longer-term charts
This broadening of inflationary pressure is structurally more durable than energy-driven inflation spikes, which tend to self-correct as energy prices mean-revert. Broad-based inflation reflects systemic cost pressures that are slower to unwind and more supportive of sustained commodity price appreciation.
Near-Term Inflationary Catalysts on the Horizon
Two specific upcoming events carry inflationary implications that are not widely incorporated into mainstream forecasts.
The FIFA World Cup, hosted in the United States, represents a massive consumer spending and tourism stimulus with material inflationary characteristics. Events of this scale generate sustained demand across hospitality, transportation, infrastructure, and food service sectors for an extended period.
The US 250th anniversary semiquincentennial celebrations carry a historical precedent worth noting. The 1976 bicentennial preceded the second major wave of US inflation beginning in 1977, a period that proved highly supportive for precious metals and commodities. Whether history rhymes precisely is speculative, but the economic stimulus dynamics of large-scale national celebrations have historical inflationary associations.
Combined, these events could sustain elevated inflation for 12 months or more beyond current consensus expectations, with some market analysts projecting a potential path toward 4% to 4.5% core inflation and possibly higher.
The Federal Reserve's Constrained Position
The Federal Reserve faces a binary constraint with no clean resolution. Raising rates risks destabilising credit markets and engineering economic contraction. Holding or cutting rates allows inflation to entrench further. Historical institutional behaviour strongly suggests the Fed will tolerate inflation before it deliberately engineers recession, which is structurally supportive of real assets including silver.
If the Fed hikes rates aggressively, it risks triggering significant credit market stress given current debt loads across the corporate and sovereign sectors. If it holds or cuts, inflation continues to embed itself across a broader range of expenditure categories. Given this asymmetry, the weight of institutional incentive tilts toward tolerating higher inflation, which historically has been among the most powerful fundamental drivers of precious metals bull markets.
Frequently Asked Questions: China Silver Imports and the COMEX Silver Squeeze
What is causing China to import record amounts of silver in 2026?
China's record silver imports in Q1 2026 reflect a convergence of strategic stockpiling behaviour, surging industrial demand from AI infrastructure and electrical grid expansion, and a domestic policy shift that introduced strict export licensing requirements. China transitioned from a meaningful net exporter of approximately 5,100 tonnes in 2025 to an aggressive net importer within a single quarter, representing one of the most dramatic demand reversals in modern commodity market history.
What does a declining COMEX registered inventory mean for silver prices?
When COMEX registered silver inventories fall, the pool of metal legally available to settle physical delivery obligations on futures contracts shrinks. At a coverage ratio of approximately 13.4%, only a modest increase in physical delivery demand relative to the total open interest could create significant settlement pressure. This dynamic does not guarantee a price spike, but it substantially reduces the exchange's buffer against unexpected delivery demand.
Is the current silver supply squeeze structural or temporary?
Institutional analysis from banks including UBS characterises the current tightness as likely temporary, tied to trade policy uncertainty and short-term delivery logistics. The structural view held by independent market analysts points to a six-year continuous supply deficit, dual strategic designation by both the US and China, Chinese export licensing restrictions, and byproduct supply constraints as factors that are unlikely to resolve simply because geopolitical negotiations reach a temporary accord. According to reporting from SDBullion, China's record silver buying carries implications that extend well beyond short-term market positioning.
What is Section 301 and how does it affect silver supply?
Section 301 of the US Trade Act authorises the government to impose trade restrictions on countries engaged in practices deemed harmful to US commercial interests. If applied to China in the context of silver, it could render Chinese-origin silver currently held in US vaults ineligible for domestic delivery contract settlement, effectively reducing usable supply without any physical metal leaving the country. The analogy is to the treatment of Russian-origin assets following 2022 sanctions, where assets nominally present in Western systems became legally inaccessible for standard commercial purposes.
What price level would confirm a major silver breakout?
The $95 per ounce level represents the most significant multi-timeframe resistance in the current silver market, appearing simultaneously on daily, weekly, and monthly charts. A sustained close above $95 across multiple timeframes would technically confirm a major breakout. Based on the measured move concept applied to the current cup formation depth of approximately $30, an initial post-breakout target near $125 per ounce would follow, with a longer-term cup and handle completion potentially projecting toward $180 per ounce if the full pattern plays out over an 18 to 24 month timeframe.
Key Takeaways for Silver Market Participants
- China's Q1 2026 silver imports of approximately 1,626 tonnes represent the largest quarterly inflow on record, reversing its 2025 net exporter position within a single quarter
- COMEX registered inventories reflect a coverage ratio of approximately 13.4%, creating meaningful vulnerability to elevated physical delivery demand
- The $95 per ounce level is the single most important technical resistance across daily, weekly, and monthly timeframes simultaneously
- Section 301 trade policy risk could structurally reduce usable silver supply in US vaults without any physical metal leaving the country
- Broadening inflation, Federal Reserve policy constraints, and industrial demand from AI, defence, and energy infrastructure provide multi-year fundamental support
- A confirmed breakout above $95 would technically project toward $125 based on measured move methodology, with a full cup and handle formation implying a longer-term target near $180
- Mining equities and silver are currently outperforming gold on a relative basis, which historically has signalled broader precious metals strength building across the complex
This article is intended for informational purposes only and does not constitute financial or investment advice. Price targets and technical projections are pattern-based estimates and carry no guarantee of accuracy. Readers should conduct independent research and consult qualified financial professionals before making any investment decisions. Data cited in this article reflects publicly reported market analysis and may not capture the most current real-time figures.
Want To Be First When The Next Major Silver Discovery Hits The ASX?
Discovery Alert's proprietary Discovery IQ model scans ASX announcements in real time, instantly identifying significant mineral discoveries across silver and 30+ other commodities — turning complex data into clear, actionable opportunities for investors at every level. Explore how historic discoveries have delivered extraordinary returns on the Discovery Alert discoveries page, then begin your 14-day free trial to position yourself ahead of the market.