June 12, 2026
The Market Psychology Behind Precious Metals at Inflection Points
There are moments in financial markets when multiple assets converge on critical technical thresholds simultaneously, creating a kind of collective tension that seasoned traders recognise immediately. These are not random coincidences. They reflect the underlying architecture of market structure, where participants across different time frames and risk profiles arrive at the same decision point together. When that happens across the U.S. Dollar Index and silver futures at the same time, the implications extend well beyond any single trade setup.
That is precisely the environment taking shape as silver futures approach the psychologically significant 9,000 level, a threshold that carries weight not just as a round number but as the culmination of a technical narrative years in the making. The silver breakout toward 9000 is, consequently, drawing attention from analysts and investors alike.
When big ASX news breaks, our subscribers know first
Why the Silver Breakout Toward 9000 Represents More Than a Price Level
Most market participants think about price targets in isolation. However, experienced technical analysts understand that the significance of a price level is determined by the convergence of factors supporting or opposing it. The silver breakout toward 9000 is compelling precisely because it sits at the intersection of multiple independent technical frameworks, all pointing in the same direction.
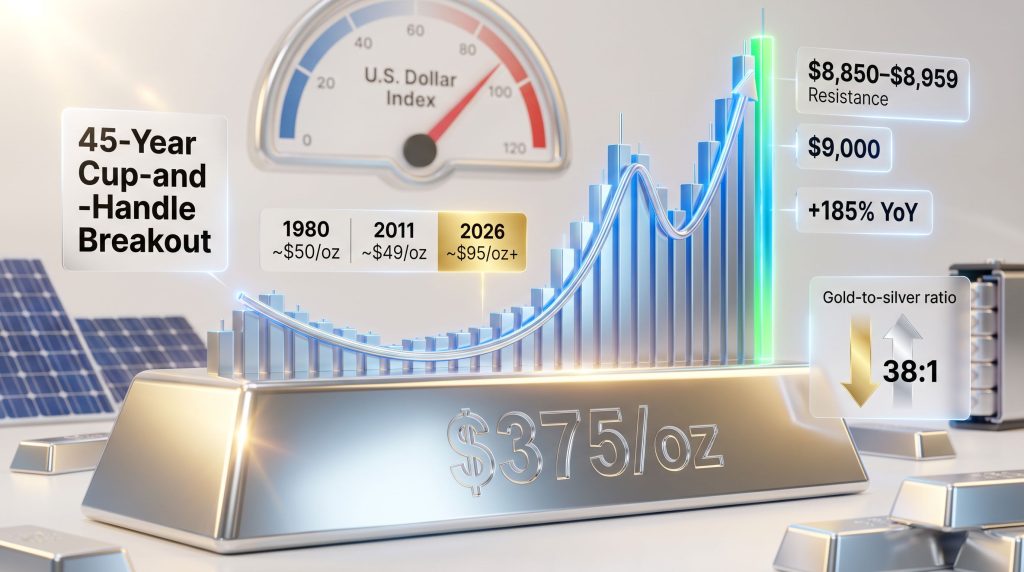
Silver has spent the better part of four decades forming what technical analysts describe as one of the largest cup-and-handle pattern formations ever recorded in a commodity market. The pattern began its construction following the speculative spike of the early 1980s, driven by the Hunt Brothers' attempt to corner the silver market. That spike created a ceiling that would define silver's price structure for an entire generation.
When a market spends that long building a base below a prior high, the eventual breakout carries structural weight that short-term momentum moves simply cannot replicate. The scale of the consolidation period implies a proportional magnitude of the subsequent move, at least in theoretical terms.
Understanding the Cup-and-Handle Formation in Commodity Markets
For readers unfamiliar with this technical pattern, a cup-and-handle forms in three distinct stages:
- A rounding decline from a prior high, forming the left side of the cup
- A gradual, rounded base forming the bottom of the cup over an extended period
- A recovery toward the prior high, followed by a shallow consolidation (the handle) before the eventual breakout
The key insight is that the longer the cup formation takes to complete, the more significant the breakout is considered to be. A 45-year formation is essentially unprecedented in modern commodity market history, which is part of why analysts characterise the current silver breakout as a potential regime change rather than simply another cyclical rally.
| Pattern Component | Timeframe | Price Significance |
|---|---|---|
| Left wall of cup | 1980 spike | ~$50/oz historic high |
| Cup base formation | 1980 to ~2020 | Multi-decade accumulation |
| Recovery to prior high | 2020 to 2025 | Retest of 1980/2011 resistance |
| Handle consolidation | 2024 to early 2026 | Compression before breakout |
| Breakout confirmation | 2026 | New structural price floor established |
The Critical Technical Levels Defining Silver's Near-Term Trajectory
As of the most recent session analysis, silver futures (SI.F) have already executed a significant portion of the bullish technical script outlined in earlier forecasts. Buyers have managed to close the day above multiple prior gap zones, including the April 20 and March 13 gaps. Crucially, they reclaimed the lower boundary of the green rising channel that had been briefly breached, which invalidated what appeared to be a breakdown and transformed a bearish signal into a bullish one.
This type of pattern — a false breakdown followed by a strong reclamation — is considered one of the most reliable bullish configurations in technical analysis. It effectively traps short sellers and creates fuel for an accelerated move higher.
The $8,526 Line That Separates Bulls from Bears
Every well-constructed technical trade setup requires a clearly defined invalidation level, and for silver's current bullish thesis, that level is $8,526 on the futures contract. This is not an arbitrary figure. It represents the reclaimed lower boundary of the rising channel — the same support that bulls fought hard to recover.
A confirmed daily close below this level would signal that the reclamation was a failure, opening the door to the next meaningful support cluster in the $8,000 to $8,120 range. Active traders and risk-conscious investors should treat this level as a non-negotiable reference point for position management.
Key levels currently defining silver's technical structure:
- $8,526 — Critical support; daily close below invalidates the bullish structure
- $8,000 to $8,120 — Downside target if support breaks
- $8,850 to $8,959 — Fibonacci confluence resistance combined with the lower edge of the March 11 gap
- $9,000 — Psychological barrier; next major objective if resistance clears
Why the $8,850 to $8,959 Zone Is the Defining Battleground
The resistance cluster sitting between $8,850 and $8,959 represents the convergence of two independent Fibonacci retracement calculations overlapping with the lower boundary of the March 11 gap zone. This is known as Fibonacci confluence, and it matters for a straightforward reason: when multiple independent measurements point to the same price area, that area tends to attract a higher concentration of market orders.
The pullback from this zone back to the rising channel's lower boundary is entirely consistent with healthy technical behaviour within an uptrend. Furthermore, it is the kind of consolidation that tends to precede a breakout rather than signal a reversal, provided key support holds.
As long as silver maintains a daily close above the reclaimed channel boundary near $8,526, the technical framework continues to favour buyers positioning for a push through the $8,850 to $8,959 resistance zone and toward the 9,000 threshold.
The U.S. Dollar's Role in Silver's Technical Setup
Understanding the silver breakout toward 9000 requires examining the dollar impact on silver simultaneously, because the two markets share a structurally inverse relationship. When the dollar weakens, assets priced in USD — including silver and gold — typically appreciate in relative terms as the purchasing power adjustment flows through global markets.
Current technical analysis of the DXY reveals a chart in a compromised structural position. Friday's session produced a fresh bearish engulfing candle on the daily chart, a two-bar reversal pattern that carries meaningful weight when it appears within an already contested resistance zone. The dollar briefly reclaimed the 98 level during the Asian session, however that recovery has run directly into the prior week's bearish gap zone between 98.20 and 98.31, which remains unresolved overhead.
What Dollar Bulls Need to Accomplish
For the dollar to mount a genuine recovery that could pressure metals, bulls need to achieve a confirmed daily close above 98.31, effectively neutralising the bearish island reversal pattern. Successfully clearing that level would open a path toward the next resistance cluster in the 98.75 to 99.68 zone.
Until that occurs, the dollar remains technically stuck between competing forces, which is constructive for precious metals. A dollar unable to rally meaningfully cannot exert the kind of USD-strength headwind that historically slows silver and gold appreciation.
| Dollar Scenario | Trigger Level | Implication for Silver |
|---|---|---|
| Bearish continuation | Fails to close above 98.31 | Constructive for silver upside |
| Mixed/consolidation | Range-bound between 97.82 and 98.31 | Neutral; silver follows own structure |
| Bullish recovery | Daily close above 98.31 | Potential headwind for metals |
| Strength acceleration | Breakout above 99.68 | Increased pressure on silver thesis |
Macro Forces Reinforcing the Technical Breakout Thesis
Technical analysis never exists in a vacuum. The patterns on silver's chart carry greater weight when they align with fundamental and macroeconomic forces pushing in the same direction. In addition, silver's dual role as both a monetary and industrial metal creates a uniquely broad base of demand support.
Several macro dynamics are currently operating in silver's favour:
- Central bank accumulation: Multiple central banks have been actively diversifying reserves away from U.S. dollar-denominated assets, with gold accumulation running at elevated rates. While this directly supports gold, silver tends to follow gold's monetary price leadership during sustained precious metals bull markets.
- Fiscal trajectory concerns: Expanding government deficits across major economies, combined with elevated debt issuance, are sustaining investor appetite for hard assets as a hedge against currency debasement.
- Rate expectations: Markets are currently pricing in meaningful probability of Federal Reserve rate reductions in the second half of 2026. Lower interest rates reduce the opportunity cost of holding non-yielding assets like silver.
- Industrial demand growth: Solar photovoltaic installations, electric vehicle production, and advanced electronics manufacturing all require silver as a critical input material, creating a demand floor largely independent of investor sentiment.
The Supply Side Constraint That Rarely Gets Discussed
What is frequently underappreciated in mainstream coverage is the structural supply challenge facing silver. According to analysis of silver supply deficits, approximately half of annual silver demand comes from industrial applications, and mining output has not kept pace with the acceleration in industrial consumption driven by the energy transition.
Silver is predominantly produced as a byproduct of base metal mining, particularly lead, zinc, and copper operations. This means silver supply cannot simply respond to higher prices the way a primary silver mine could. This supply inelasticity creates persistent deficit conditions during periods of strong industrial demand growth, according to analysts at FX Street, providing fundamental underpinning to the technical breakout thesis.
Assessing the Risk: Is Silver Overextended?
Intellectual honesty demands acknowledging the risks present in any market trading at elevated levels. Silver's extraordinary performance over recent months has created technical overextension conditions that warrant careful consideration.
When a commodity trades significantly above its 200-day exponential moving average for an extended period, it accumulates what technical analysts call mean-reversion risk. The further price deviates from long-term trend measures, the more vulnerable it becomes to sharp corrections when sentiment shifts — even within an otherwise healthy long-term uptrend.
The critical nuance here is distinguishing between corrections within a secular bull market and reversals of a secular trend. Multi-generational breakouts rarely produce straight-line advances. Historical commodity supercycles have consistently featured corrections of 30% to 50% within larger uptrends that ultimately delivered multiples of the starting price.
Bull Case vs. Bear Case: A Balanced Scenario Framework
| Scenario | Trigger Condition | Near-Term Price Path | Long-Term Implication |
|---|---|---|---|
| Bullish breakout | Daily close above $8,959 | Push toward $9,000 and beyond | Multi-year advance continues |
| Healthy consolidation | Holds $8,526 support | Range-bound base building | Setup for next advance |
| Bearish breakdown | Daily close below $8,526 | $8,000 to $8,120 downside | Near-term thesis invalidated |
| Deep macro correction | Recession-driven selling | Substantial drawdown | Structural bull intact long-term |
Disclaimer: Price forecasts and technical analysis scenarios described in this article are based on chart pattern analysis and macroeconomic modelling, not traditional fundamental valuation methods. All investing involves risk, and past technical patterns do not guarantee future outcomes. Readers should conduct independent research and consult qualified financial advisors before making investment decisions.
The next major ASX story will hit our subscribers first
What the Silver Breakout Toward 9000 Means for Different Types of Investors
The appropriate response to silver's current technical position differs substantially depending on an investor's time horizon, risk tolerance, and existing exposure.
For conservative, long-term investors:
- Prioritise confirmed daily closes above key resistance before adding exposure
- Use the $8,526 support level as a defined risk reference point for position sizing decisions
- Focus on the structural argument — supply deficits, monetary debasement, industrial demand — rather than short-term price targets
- Recognise that meaningful corrections are historically normal within secular commodity bull markets
For active traders with shorter horizons:
- The $8,850 to $8,959 resistance cluster is the immediate battleground to monitor for breakout confirmation
- A confirmed close above $8,959 with strong volume would represent a technically actionable momentum signal
- Define stop-loss levels below $8,526 before entering new positions
- Monitor the DXY concurrently, as dollar strength or weakness will amplify silver's directional moves
For macro-oriented investors with multi-year perspectives:
- The completion of a 45-year base formation, if confirmed, represents a structural re-rating of silver's price floor
- Gold-silver ratio analysis suggests silver may outperform gold on a percentage basis during the advance phase of a precious metals bull market
- Industrial demand growth from the energy transition provides a demand driver that exists independently of financial market sentiment
The Psychology of a Market at a Decision Point
What makes the current setup particularly interesting from a market psychology perspective is precisely the uncertainty. When a market sits directly at a major resistance zone with no decisive breakout yet confirmed, it creates a "prove it" environment where conviction must be demonstrated through price action rather than narrative.
This is the moment where patience becomes a genuine edge. Traders who act before confirmation risk being caught on the wrong side of a failed breakout. Those who wait for a confirmed close above the resistance cluster sacrifice some early-move profitability, however they gain dramatically higher probability of being correctly positioned.
Furthermore, forecasts from Finance Magnates highlight that some analysts project silver reaching $37.50 by 2026, reinforcing the long-term structural thesis underpinning the current technical setup. The silver breakout toward 9000 is not guaranteed. What is clear from the technical evidence is that silver has navigated its recent consolidation constructively, reclaimed important structural levels, and now stands at a threshold where the next confirmed directional move carries outsized significance for both near-term traders and long-term investors watching one of the most closely followed commodity markets in the world.
Important Disclaimer: This article is intended for informational and educational purposes only. It does not constitute financial advice, investment recommendations, or a solicitation to buy or sell any financial instrument. Technical analysis involves significant uncertainty, and all forecasts discussed herein represent analyst opinions, not guaranteed outcomes. Precious metals markets involve substantial risk of loss. Always seek advice from a licensed financial professional before making investment decisions.
Ready to Position Yourself Ahead of the Next Major Mineral Discovery?
Discovery Alert's proprietary Discovery IQ model delivers real-time alerts on significant ASX mineral discoveries, transforming complex mineral data into actionable insights for both short-term traders and long-term investors — explore Discovery Alert's dedicated discoveries page to understand how historic finds have generated substantial returns, and begin your 14-day free trial today to secure a market-leading edge.