July 17, 2026

Why the World's Second-Largest Economy Is the Biggest Variable in Australian Resource Investing
Commodity markets have never operated in isolation from geopolitical and macroeconomic cycles, but few relationships are as structurally decisive for Australian investors as the link between Chinese domestic growth and ASX resource sector performance. When China's economy falters internally, the consequences ripple outward with particular force through Australia's export income, corporate earnings, and equity market valuations. Understanding this dynamic, and how it is playing out right now, is essential context for anyone holding exposure to ASX commodities and China slowdown risk in 2026.
When big ASX news breaks, our subscribers know first
China's Q2 2026 GDP Miss: More Than Just a Number
China's second quarter 2026 GDP growth of 4.3% was not just a miss against the 4.5% consensus forecast. It represented the weakest quarterly expansion since 2022, a full four years, and it came at a time when many market participants had assumed China was stabilising. The result exposes a critical structural tension within the Chinese economy that has significant downstream implications for Australian commodity exporters.
The surface-level story is paradoxical. China's export sector is recording monthly trade surpluses running approximately 27% higher year-on-year, a staggering pace of growth for an economy of that size. Yet beneath that headline, domestic fixed asset investment continued contracting, housing prices have now been declining for 29 consecutive months, and Chinese bond yields remain significantly below their Western counterparts, a clear signal that deflation, not inflation, is the operative economic force inside China's borders.
This two-speed dynamic, a powerhouse export engine running alongside a deflating domestic economy, tells very different stories depending on which lens you apply. For commodity demand purposes, it is the domestic side that matters most.
The Cultural Savings Dynamic That Complicates Beijing's Stimulus Equation
One of the less commonly discussed barriers to Chinese domestic recovery is deeply cultural. China has a strongly savings-oriented social structure, with tight family financial ties and risk-averse household behaviour. This makes the transition from export-led growth to consumption-driven growth extremely difficult to engineer through policy levers alone.
Recent attempts, including the distribution of consumer vouchers for household appliances, illustrate how far Beijing has had to reach to stimulate spending behaviour that most Western economies generate organically. The result is that even when fiscal stimulus is applied, the transmission mechanism into commodity-intensive domestic activity, particularly construction and infrastructure, remains slow and unpredictable.
What China's Property Slump Means for Iron Ore Demand
Iron ore is where China's domestic weakness hits Australian export income most directly. The China steel and iron ore market and its construction and steel production sectors drive the bulk of global iron ore consumption, and both are directly dependent on Chinese property market health.
With home prices declining for 29 straight months, the structural damage to construction activity is not a short-term dip but a sustained contraction. Fixed asset investment declining alongside property values creates a compounding effect on bulk commodity demand, as fewer buildings start means fewer tonnes of steel, which translates directly into lower iron ore import volumes.
| Commodity | Current Price Benchmark | Forecast (Late 2026) | Primary Demand Driver at Risk |
|---|---|---|---|
| Iron Ore | ~US$125.95/t | US$100/t (Citi forecast) | Construction and property investment |
| Copper | Near five-month high | Tight supply outlook | Electrification and AI infrastructure |
| Brent Crude Oil | ~US$81.61/bbl | Downside pressure | Chinese import volumes |
| Lithium | Multi-year lows | Continued weakness | Chinese EV adoption rate |
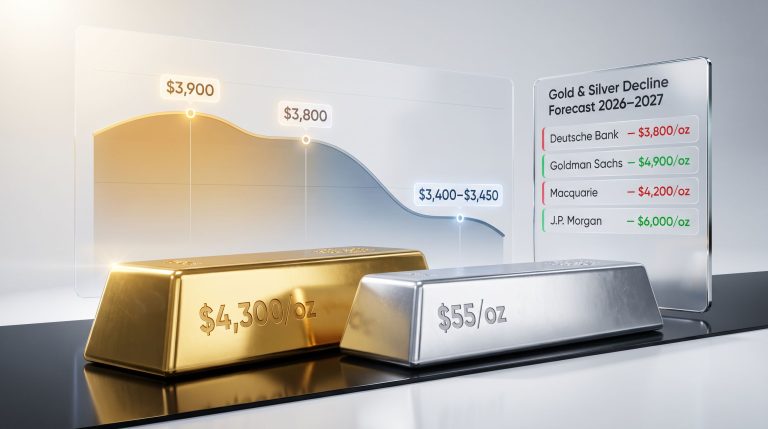
| Gold | ~US$3,700-$4,000/oz range | Structural long-term support | Central bank reserve diversification |
Analyst forecasts, including projections from Citi, suggest iron ore prices could decline toward US$100 per tonne by late 2026 if Beijing does not deliver targeted stimulus toward construction activity. Furthermore, the absence of a meaningful government response is amplifying uncertainty across bulk commodity markets. China demand prospects remain a key concern, and ASX-listed iron ore producers are pricing in that risk through sustained share price underperformance.
Australia's Asymmetric Vulnerability: The Concentration Risk
China accounts for approximately one-third of Australia's total international trade, a concentration that creates an asymmetric risk profile compared to more diversified exporting nations. The critical distinction is that Australia's export basket is heavily skewed toward raw materials: iron ore, copper, coal, and lithium. Unlike manufactured goods or services, these commodities are directly tied to Chinese industrial and construction activity.
IMF modelling suggests that sustained weakness in commodity prices linked to Chinese demand deterioration could subtract up to 1% annually from Australian GDP growth. For an economy that has been relying on terms-of-trade strength to support living standards and government revenues, that is a meaningful headwind.
Unlike diversified exporters, Australia's trade profile means any sustained deterioration in Chinese industrial demand flows directly into national income, corporate earnings, and ASX resource sector valuations. The vulnerability is structural, not incidental.
How ASX Markets Are Responding: Divergence Beneath the Surface
The ASX 200 headline index has appeared relatively stable, but that stability is misleading. The numbers beneath the surface tell a more concerning story about where capital is actually flowing and why. The ASX commodity pressure being felt across resource stocks is particularly evident when examining small-cap performance.
Year-to-Date ASX Performance (Approximate):
- ASX 200 (XJO): approximately +1% excluding dividends
- ASX Top 20 Stocks: approximately +7.5%
- ASX Small Caps: approximately -10.5%
This divergence reflects institutional investors crowding defensively into large-cap names they believe are unlikely to disappoint during the upcoming August earnings season. Banks, supermarkets, and industrials are trading on stretched valuations, with Wesfarmers near 35 times earnings, Coles and Woolworths at roughly 24 and 30 times earnings respectively, and Macquarie Bank around 19 times earnings.
This pattern mirrors historical precedents like the Nifty 50 era of the 1970s, when capital concentrated into a narrow group of perceived safe-haven stocks at elevated valuations, only to strand investors for nearly a decade of flat real returns.
The real risk in this behaviour is not what these companies will report, but what happens to their elevated valuations if sentiment shifts. Perceived low risk does not equal actual low risk when prices are stretched this far above underlying fundamentals. For commodity-exposed small caps, however, this dynamic has created a deeply discounted opportunity set, though one that requires patience and a clear understanding of what catalysts could unlock value.
The ASX 300 Metals and Mining Index (XMM) adds further nuance. The index has dipped below its point of control, rallied back to previous highs, and pulled back again. Whether this pattern represents a healthy consolidation within a longer commodity bull market or the early stages of a major distribution top is the central question facing resource investors in the second half of 2026.
Copper's Diverging Story: Supply Constraints Meeting New Demand Sources
Not all commodities are equally exposed to Chinese domestic weakness. Copper stands out as a commodity with two structurally distinct demand drivers, which is why its price trajectory has diverged meaningfully from iron ore and lithium. The copper supply crunch is increasingly influencing how analysts and investors are reassessing the metal's long-term value proposition.
BHP recently downgraded its copper production outlook for 2027, with its flagship Escondida operation in Chile experiencing declining ore grades. Production is expected to fall from approximately 2 million tonnes in the current year to somewhere in the range of 1.65 to 1.85 million tonnes in 2027. This is a grade-driven decline, meaning the underlying ore body is becoming less concentrated, a structural supply constraint that cannot be quickly remedied by increasing throughput volumes.
BHP's difficulties at Escondida and ongoing challenges at Olympic Dam in South Australia highlight a broader industry reality: even the world's largest copper producers are struggling to grow output, let alone replace depleting reserves with equivalent grade material.
On the demand side, copper is increasingly being priced as a beneficiary of Western digital infrastructure investment. The buildout of AI data centres, electricity grid upgrades, and electrification programmes across the United States and Europe is generating copper demand that operates largely independently of Chinese industrial cycles. The convergence between copper price performance and Nasdaq semiconductor sector returns is not coincidental. It reflects a structural repricing of copper as a technology-adjacent commodity, not purely a Chinese industrial demand proxy.
The point where copper prices and semiconductor sector performance move together represents something genuinely new in commodity markets. Copper is no longer priced solely on Chinese construction cycles, which changes the risk and opportunity calculus for investors significantly.
The next major ASX story will hit our subscribers first
Gold's Correction Phase: Reading the Sentiment Signal Correctly
Gold's trajectory from late 2024 through mid-2026 followed a pattern familiar to long-term commodity investors: a multi-year breakout, a momentum-driven acceleration, a speculative blow-off top, and then a sentiment-driven correction that discourages the very investors best positioned to benefit from re-entry. The gold market outlook remains constructive for those willing to look beyond short-term price noise.
The price level around US$4,000 per ounce has emerged as both a psychological reference point and a technical support zone. The structure below it is also worth examining carefully.
Gold Price Support Framework:
| Price Level | Significance |
|---|---|
| ~US$4,000/oz | Psychological round number; tested as support multiple times |
| ~US$3,700/oz | Long-term trend line support; potential value accumulation zone |
| Below US$3,700/oz | Would signal meaningful structural breakdown; potential forced selling |
Sentiment has shifted dramatically. Gold dominated financial commentary at the start of 2026 when prices were near their highs. Now, with prices corrected and many short-term holders nursing losses, the conversation has largely moved elsewhere. That kind of widespread disillusionment has historically coincided with value accumulation opportunities, not structural bear market entrances.
One of the more compelling and less widely discussed structural drivers for gold involves the relationship between China's reserve asset allocation and its trade surplus recycling behaviour. China's holdings of US Treasuries peaked in 2013 and have since approximately halved. That peak in Treasury holdings also coincided almost precisely with the long-term trough in gold prices.
As China shifted surplus savings away from US dollar-denominated assets and toward gold reserves, a multi-decade structural demand driver was quietly established beneath the gold market. The logic is straightforward: countries running large persistent trade surpluses must store that wealth somewhere. When the asset of choice, US Treasuries, loses appeal due to fiscal deterioration and currency risk, gold becomes the rational alternative. With the United States running fiscal deficits of 5 to 7% of GDP even during periods of economic strength, the structural case for surplus nations to diversify into gold rather than Treasuries remains firmly intact regardless of short-term price corrections.
Thermal Coal: The Most Unloved Sector Generating Real Cash Flow
Perhaps no sector in the Australian resource market better illustrates the gap between market sentiment and operational reality than thermal coal. Newcastle coal futures are trading near US$130 per tonne, a price level at which Australian thermal coal producers are generating meaningful free cash flow, yet institutional interest in the sector remains almost nonexistent due to ESG-driven capital constraints.
Coal Market Dynamics Summary:
| Factor | Current Status | Directional Implication |
|---|---|---|
| Newcastle Coal Price | ~US$130/t | Profitable for Australian producers |
| European Gas Prices | Elevated | Supportive of coal substitution demand |
| Indian Domestic Production | Near 4-year lows | Potential import demand recovery |
| Chinese Coal Plant Utilisation | 50-60% of capacity | Upside risk in drought or renewable shortfall scenarios |
| Key Resistance Level | US$150/t | Breakout above could trigger significant further upside |
Several dynamics are worth highlighting for investors willing to look past the sector's reputational headwinds:
- European gas prices remain elevated, creating substitution demand for coal as the continent prepares for winter storage requirements
- Indian domestic coal production has fallen to near four-year lows, raising the prospect of increased import demand that would benefit Australian high-quality thermal coal exporters
- Chinese coal plant strategy has shifted in ways the market has largely misunderstood. China is building coal-fired capacity not for full utilisation, but as flexible baseload backup for its rapidly expanding renewable energy system. These plants operate at 50 to 60% utilisation under normal conditions but can be rapidly ramped during droughts, when hydroelectric generation falls, or when renewable output is insufficient
- Chinese domestic coal safety closures represent a supply-side factor that receives almost no coverage. Following fatalities at domestic operations, Chinese regulators closed numerous mines deemed to have inadequate safety standards, reducing domestic supply in ways not immediately visible in headline price data
- Australian coal quality commands a premium among Asian buyers in Taiwan, Japan, and parts of Southeast Asia due to its superior energy content and lower impurity profiles compared to domestic Chinese production
A breakout above the US$150 per tonne resistance level, which would align with either a significant geopolitical energy disruption or a cold European winter pushing gas prices higher, could consequently send thermal coal company earnings substantially above current consensus expectations.
Scenario Analysis: What Could Change the Trajectory?
The near-term direction of ASX commodities and China slowdown risk depends heavily on which of several scenarios plays out over the next six to twelve months.
- Beijing delivers targeted domestic stimulus focused on construction and fixed asset investment, directly addressing the iron ore and bulk commodity demand deficit
- Geopolitical energy disruption in the Middle East, particularly involving oil and gas flows through the Strait of Hormuz, drives a sharp repricing of energy commodities with knock-on effects for thermal coal
- AI infrastructure capital expenditure continues expanding, sustaining copper and energy demand through Western investment channels that are structurally independent of Chinese activity
- China's deflationary spiral deepens, extending domestic demand weakness into 2027 and pushing iron ore, lithium, and other China-sensitive commodities to new cycle lows
Commodity bull markets historically climb a wall of worry. Significant uncertainty does not automatically indicate a market top. The critical analytical distinction is between cyclical consolidation within a longer structural uptrend and genuine distribution into a major peak. Getting that distinction right is what separates investors who compound through volatility from those who sell at the worst possible moment.
Key Takeaways for ASX Resource Investors
- China's 4.3% Q2 2026 GDP growth is the weakest quarterly result since 2022, driven by domestic weakness rather than export deterioration
- Australia's commodity-intensive export profile creates asymmetric vulnerability, with IMF modelling suggesting up to 1% annual GDP impact from sustained commodity price weakness
- Iron ore faces the most direct downside risk from Chinese property market deterioration; the US$100/t forecast is a credible scenario without stimulus
- Copper is partially insulated by structural supply constraints and growing Western demand from AI and electrification investment
- Gold's structural case is intact despite sentiment-driven corrections, underpinned by central bank reserve diversification and surplus-nation savings behaviour
- Thermal coal is generating strong cash flows at current prices and carries potential upside if European winter demand or Asian energy security concerns push prices above US$150/t
- The ASX 200's apparent stability masks deep small-cap weakness, with institutional capital crowding defensively into expensive large-cap names ahead of August earnings season
- Beijing's stimulus timing remains the single most consequential variable for the near-term direction of Australian commodity markets, making ASX commodities and China slowdown dynamics the defining investment theme of the second half of 2026
Disclaimer: This article is intended for informational and educational purposes only and does not constitute financial advice. All price forecasts, scenarios, and market projections discussed involve inherent uncertainty and should not be relied upon as predictions of future outcomes. Readers should conduct their own research and consult a licensed financial adviser before making investment decisions. Past performance of commodities or equity markets is not indicative of future results.
Want to Stay Ahead of ASX Mineral Discoveries Amid China's Economic Uncertainty?
While China's slowdown creates significant headwinds for bulk commodities, structural opportunities in copper, gold, and emerging resource plays continue to surface on the ASX — and timing is everything. Discovery Alert's proprietary Discovery IQ model delivers real-time alerts on significant ASX mineral discoveries, transforming complex geological and market data into actionable insights the moment they are announced, with historic discoveries demonstrating just how substantial the returns can be for investors who move early — start your 14-day free trial today and position yourself ahead of the broader market.