May 15, 2026
China's steel industry is experiencing an unprecedented paradox, with the country's steel output slump occurring alongside record iron ore imports in 2025. This unusual divergence challenges conventional market wisdom and reveals complex structural shifts within the world's largest steel-producing economy.
Complex structural dynamics are reshaping China's industrial landscape as the world's largest steel producer experiences its most significant contraction in nearly a decade. While traditional economic models suggest raw material demand should mirror finished goods production, China's steel sector currently defies conventional wisdom through an unprecedented divergence between declining output and surging feedstock imports.
The phenomenon reflects deeper transformations within China's economy, where policy-driven capacity adjustments intersect with forward-looking inventory strategies and persistent optimism regarding government stimulus effectiveness. This market paradox offers critical insights into how commodity cycles evolve when supply-side adjustments precede demand recovery expectations.
Manufacturing Sector Headwinds Accelerate
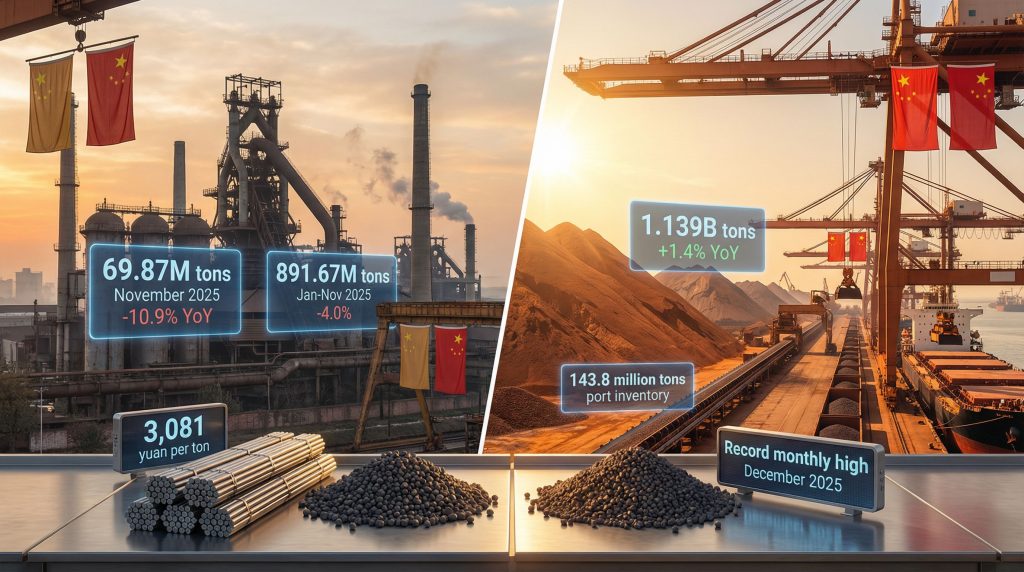
China's steel production declined to 69.87 million tons in November 2025, marking a 10.9% year-over-year decrease and representing the sixth consecutive monthly contraction. This trajectory positions 2025 annual production at approximately 964 million tons, the lowest level since 2018's output of 928.3 million tons.
The manufacturing sector's deteriorating fundamentals extend beyond seasonal patterns, with increasingly evident weakness across key steel-consuming industries. Property construction demand remains severely constrained, while manufacturing applications show accelerating decline patterns that compound the sector's structural challenges.
Furthermore, production data for the first eleven months of 2025 totalled 891.67 million tons, down 4.0% from the corresponding 2024 period. Projecting November's daily production rate through December suggests monthly output of approximately 72.3 million tons, confirming the seven-year low trajectory for annual production.
Regional Impact Distribution Patterns
The production contraction spans multiple geographic regions, though concentration effects vary significantly across China's primary steel-producing provinces. Major manufacturing hubs including Hebei, Jiangsu, and Shandong face differentiated impacts based on their exposure to construction versus export-oriented demand streams.
In addition, capacity utilisation rates across integrated steel mills have declined substantially from 2024 averages, with smaller regional producers experiencing disproportionate operational pressure. The geographic distribution of closures and production cuts reflects both environmental compliance requirements and economic viability thresholds.
When big ASX news breaks, our subscribers know first
Iron Ore Import Surge Defies Production Logic
Despite weakening steel output, China's iron ore imports continue reaching unprecedented levels, with 1.139 billion tons imported during the first eleven months of 2025, representing a 1.4% year-over-year increase. November arrivals alone totalled 110.54 million tons, up 8.5% from the prior year period.
Commodity analysts at Kpler estimate December 2025 iron ore imports will reach approximately 121 million tons, potentially driving full-year imports to 1.26 billion tons or higher, eclipsing 2024's record 1.237 billion tons. This projection assumes continued strong arrivals despite deteriorating steel demand fundamentals.
Strategic Inventory Accumulation Mechanisms
Port stockpile data reveals systematic inventory building, with Chinese facilities holding 143.8 million tons as of December 12, 2025, according to SteelHome consultants. This represents a 10.5% increase from August's eighteen-month low of 130.1 million tons.
Moreover, current inventory levels approach the 151.8 million ton peak established in July 2024, suggesting limited additional storage capacity for further accumulation. The strategic nature of this stockpiling reflects forward-looking positioning rather than immediate consumption requirements.
Key Import Performance Metrics:
- January-November 2025: 1.139 billion tons (+1.4% YoY)
- November 2025: 110.54 million tons (+8.5% YoY)
- December 2025 Projection: ~121 million tons
- 2025 Full-Year Estimate: 1.26+ billion tons (new record)
- Current Port Inventories: 143.8 million tons (+10.5% from August lows)
Quality Premium Considerations Drive Import Patterns
Import composition analysis reveals preference shifts toward higher-grade iron ore specifications, particularly 62% Fe+ content materials from Australian and Brazilian suppliers. This quality premium strategy reflects mill optimisation efforts to maintain productivity despite reduced operational scale.
The arbitrage opportunity between seaborne iron ore pricing and eventual steel demand recovery expectations supports continued accumulation strategies among Chinese traders and integrated mills. Competitive pricing relative to historical benchmarks provides favourable cost positioning for future production cycles.
Economic Fundamentals Driving Market Disconnect
The divergence between steel production weakness and iron ore import strength reflects multiple converging economic forces that reshape traditional commodity relationships. Property sector construction demand remains severely constrained, while manufacturing applications show accelerating deterioration across key steel-consuming industries.
However, government stimulus expectations continue supporting forward-looking inventory strategies, despite limited evidence of immediate demand recovery. Beijing's policy announcements regarding infrastructure investment and manufacturing support maintain market optimism regarding eventual consumption normalisation.
Property Sector Construction Collapse
Residential construction activity remains at multi-year lows, with developer financial distress constraining new project initiation and existing project completion rates. Steel-intensive infrastructure applications including high-rise residential, commercial development, and urban infrastructure show persistent weakness.
Consequently, regional property market conditions vary significantly, with tier-one cities showing marginally better performance compared to smaller metropolitan areas. However, aggregate construction steel demand remains well below historical trend levels, contributing substantially to overall production weakness.
The property sector's contribution to total steel consumption historically represented 25-30% of domestic demand, making construction weakness a primary driver of current production adjustments. Recovery timing remains highly uncertain despite government policy support announcements.
Manufacturing Demand Deterioration Accelerates
Industrial steel applications across automotive, shipbuilding, machinery, and appliance manufacturing show increasingly evident weakness. Export-oriented manufacturers face additional pressure from international trade tensions and competitive dynamics in key overseas markets.
Furthermore, automotive steel consumption, traditionally a stable demand component, reflects broader challenges within China's vehicle manufacturing sector. Both domestic sales and export performance contribute to reduced steel intensity across the transportation equipment supply chain.
Manufacturing PMI indicators suggest continued sector contraction, though steel-intensive subsectors show varied performance based on end-market exposure and competitive positioning within global supply chains.
Price Dynamics Reflect Supply-Demand Imbalances
Steel pricing mechanisms demonstrate clear responsiveness to production weakness and demand constraints, with Shanghai rebar contracts closing at 3,081 yuan ($437.64) per ton on December 16, 2025. This represents a 10.1% decline from July 30's peak of 3,429 yuan per ton, when the current downtrend commenced.
The 348 yuan per ton absolute decline reflects market recognition of persistent oversupply conditions and limited near-term demand recovery prospects. Price discovery mechanisms accurately signal fundamental weakness despite inventory accumulation strategies across the supply chain.
Is Iron Ore Pricing Defying Steel Market Logic?
Iron ore pricing demonstrates remarkable divergence from steel price trends, with Singapore Exchange contracts reaching $106.25 per ton on December 16, 2025. The commodity achieved a 2025 high of $107.90 per ton on December 4, representing substantial recovery from July 1's ten-month low of $93.35 per ton.
This 13.8% appreciation from the July trough contrasts sharply with steel's 10.1% decline from its July peak, creating unprecedented margin compression for integrated steel producers. The price spread evolution reflects forward-looking expectations rather than current consumption patterns, aligning with broader iron ore price trends across global markets.
Comparative Price Performance Analysis:
| Commodity | Current Price | Peak/Trough Date | % Change | Direction |
|---|---|---|---|---|
| Shanghai Rebar | 3,081 yuan/ton | July 30 Peak | -10.1% | Declining |
| Iron Ore (SGX) | $106.25/ton | July 1 Trough | +13.8% | Rising |
| Price Spread Impact | Margin compression | July divergence | -21% combined | Adverse |
Mill Margin Compression Dynamics
The divergent price performance creates severe margin pressure for Chinese steel producers, as raw material costs rise while finished product pricing declines. Traditional integrated mill economics face unprecedented challenges when input cost trends oppose output pricing directions.
In addition, energy costs, coking coal expenses, and operational overhead allocation across reduced production volumes compound the margin compression effect. Mills face strategic decisions regarding production curtailment versus inventory liquidation to maintain cash flow generation.
Forward curve positioning in both steel and iron ore markets suggests limited near-term relief from current margin pressure, with price normalisation dependent on either steel demand recovery or iron ore import moderation.
What Are the Global Steel Trade Implications?
China's domestic production weakness coincides with aggressive export strategies that redirect surplus capacity toward international markets. Steel export volumes during the first five months of 2025 exceeded 48 million tons, representing significant year-over-year increases despite overall production declines.
This export surge creates competitive pressure across global steel markets, particularly affecting producers in Southeast Asia, Europe, and North America. International trade responses include enhanced anti-dumping measures and safeguard policies targeting Chinese steel imports, reflecting broader US-China trade war impact on global commodity flows.
Trade Barrier Implications Reshape Export Flows
Escalating international trade restrictions force Chinese exporters to diversify geographic markets and product specifications. Traditional high-volume export destinations implement increasingly stringent import controls, requiring strategic repositioning toward emerging markets with limited trade barrier implementation.
Furthermore, product mix optimisation favours higher-value specialty steels and finished goods over commodity-grade materials subject to anti-dumping measures. This strategy supports better pricing realisation while reducing exposure to trade policy risks in key overseas markets.
The competitive positioning achieved through domestic demand weakness and export redirection provides Chinese steel producers with market share gains in regions with limited local production capacity or higher cost structures. External analysis from China's steel output to slump to 7-year low reinforces this strategic shift in global trade patterns.
Seaborne Market Dynamics Favour Chinese Exporters
Freight cost advantages and logistics optimisation support Chinese steel competitiveness in distant markets, particularly when domestic pricing pressure creates incentives for international sales. Export profitability often exceeds domestic realisation despite margin compression from rising raw material costs.
Consequently, regional trade agreements and bilateral arrangements facilitate market access in specific geographic areas, offsetting restrictions imposed by traditional Western markets. This geographic diversification reduces dependence on established trade relationships subject to political tensions.
How Do Current Inventory Strategies Signal Future Direction?
Current stockpiling patterns across Chinese ports and mill facilities provide critical insight into market participants' expectations regarding future steel demand recovery. The systematic accumulation of 143.8 million tons in port inventories suggests confidence in eventual consumption normalisation despite current weakness.
However, approaching the previous peak level of 151.8 million tons established in July 2024 indicates limited additional storage capacity for continued accumulation. Physical constraints will likely force import moderation during early 2026 unless consumption patterns improve substantially, which iron ore demand insights suggest remains uncertain.
Mill-Level Strategic Positioning
Integrated steel producers maintain higher than normal raw material inventories to capture cost advantages from competitive seaborne pricing. This strategy requires significant working capital allocation but provides input cost protection against potential future price recovery.
Moreover, inventory management decisions reflect management confidence in government stimulus effectiveness and eventual demand recovery timing. Mills accepting current carrying costs demonstrate belief that forward positioning will generate superior returns compared to just-in-time purchasing strategies.
The seasonal inventory cycle typically shows fourth-quarter accumulation followed by first-quarter consumption, but current levels exceed historical seasonal patterns by substantial margins. This deviation suggests structural rather than cyclical factors drive current stockpiling behaviour.
Storage Infrastructure Capacity Constraints
Physical storage limitations at major Chinese ports including Dalian, Tianjin, Qingdao, and Rizhao constrain additional iron ore accumulation despite continued import demand. Infrastructure capacity represents a practical ceiling for inventory strategies regardless of economic incentives.
In addition, alternative storage solutions including inland facilities and mill-direct delivery arrangements provide limited additional capacity but require enhanced logistics coordination and transportation costs. These alternatives become economically viable only under specific pricing and timing conditions.
Port Inventory Trajectory Analysis:
- December 12, 2025: 143.8 million tons (current level)
- August 2025 Low: 130.1 million tons (18-month minimum)
- July 2024 Peak: 151.8 million tons (27-month maximum)
- Available Capacity: ~8 million tons to historical peak
- Accumulation Rate: 13.7 million tons since August (4 months)
The next major ASX story will hit our subscribers first
Investment Implications for Iron Ore Producers
Major iron ore suppliers including Australian giants BHP and Rio Tinto benefit significantly from China's strategic inventory accumulation despite steel sector weakness. Record import volumes support pricing stability and volume certainty for established suppliers with integrated logistics capabilities.
Furthermore, Brazilian producer Vale maintains competitive advantages through superior ore grades and established shipping infrastructure, positioning the company favourably for continued Chinese market penetration. Quality premiums for high-grade specifications provide additional value realisation opportunities, particularly given operations at the world's largest iron ore mines.
Australian Mining Sector Positioning
Proximity advantages and established supply relationships support Australian iron ore producers' market share retention despite competitive pressure from alternative suppliers. Integrated rail and port infrastructure provides cost leadership in seaborne transportation to Chinese destinations.
Moreover, BHP's diversified operation portfolio across multiple Australian regions provides operational flexibility and risk management capabilities during demand volatility periods. The company's Pilbara operations maintain among the industry's lowest cash cost positions globally.
Rio Tinto's Hamersley and Robe River operations benefit from automation investments and productivity improvements that enhance competitiveness during challenging market conditions. Technology integration reduces operational costs while improving product quality consistency.
Market Share Distribution Analysis
| Producer | Country | Market Share | Annual Capacity | Competitive Advantage |
|---|---|---|---|---|
| Vale | Brazil | ~20% | 400+ million tons | Premium ore grades |
| BHP | Australia | ~18% | 290+ million tons | Integrated logistics |
| Rio Tinto | Australia | ~16% | 350+ million tons | Operational excellence |
| Fortescue | Australia | ~12% | 190+ million tons | Cost leadership |
Chinese import demand exceeding 1.26 billion tons annually supports multiple supplier participation while maintaining competitive market dynamics. Geographic diversification across supplier origins provides supply security and pricing negotiation leverage for Chinese buyers.
Future Market Resolution Scenarios
The china steel output slump and iron ore import record divergence will likely resolve through one of several potential pathways, each carrying different implications for market participants and pricing dynamics. Government stimulus effectiveness represents the primary variable determining resolution timing and magnitude.
Successful demand recovery would normalise inventory consumption patterns while supporting both steel production increases and continued iron ore import strength. This scenario requires effective policy implementation and improved property sector fundamentals.
Policy Response Timing and Effectiveness
Beijing's stimulus announcements target both infrastructure investment and manufacturing sector support, though implementation timelines and economic impact measurement remain uncertain. Historical policy response patterns suggest six to twelve-month lag periods between announcement and measurable demand effects.
However, construction sector support measures face structural challenges from developer financial distress and consumer confidence constraints. Manufacturing stimulus confronts international trade tensions and global competitive pressure that limit domestic market protection effectiveness.
The coordination between monetary policy accommodation and fiscal spending programmes determines overall stimulus effectiveness. Previous successful policy cycles required synchronised implementation across multiple government agencies and administrative levels.
Inventory Normalisation Timeline Expectations
Current stockpile levels approaching historical maximums suggest import moderation beginning in early 2026 regardless of demand recovery timing. Physical storage constraints create mechanical limits on continued accumulation strategies, potentially contributing to an iron ore price decline if demand fails to recover.
Normal inventory consumption rates would require 6-9 months to reduce current stockpiles to average historical levels, assuming static import volumes and gradual demand improvement. Accelerated consumption through production recovery could shorten this timeline substantially.
The seasonal inventory cycle traditionally shows first-quarter consumption followed by gradual rebuilding through the remainder of the year. However, current elevated levels may alter this pattern, creating unusual seasonal dynamics during 2026.
Critical Monitoring Indicators for Market Direction
Several key metrics provide early warning signals for market direction changes and potential resolution of the current paradox. Construction activity indicators, manufacturing PMI trends, and government policy implementation progress offer the most reliable forward-looking insight.
Furthermore, steel mill capacity utilisation rates and production scheduling announcements provide operational insight into management expectations regarding demand recovery timing. Integrated producers' inventory management decisions reflect collective industry assessment of market conditions.
Construction Sector Recovery Signals
New project approvals, construction permits, and cement consumption patterns provide leading indicators for steel demand recovery in construction applications. Property developer financial stabilisation and new project financing availability represent prerequisite conditions for sustainable demand improvement.
In addition, infrastructure project announcements and budget allocations offer insight into government-driven steel consumption patterns. Large-scale transportation, utility, and urban development projects generate substantial steel demand when implementation proceeds effectively.
Regional construction activity variations provide geographic insight into recovery patterns and help identify areas where stimulus policies achieve greatest effectiveness. Tier-one versus tier-two city performance differentials offer additional analytical perspective.
Manufacturing Demand Assessment Metrics
Industrial production indices across steel-consuming manufacturing sectors provide comprehensive demand assessment capabilities. Automotive production, shipbuilding activity, and machinery manufacturing output directly correlate with steel consumption patterns.
Furthermore, export performance metrics for manufactured goods indicate international demand strength and competitive positioning. Strong export growth typically translates into increased domestic steel consumption through manufacturing sector expansion, as highlighted in recent analysis of China's steel production will slump.
Regional manufacturing PMI data helps identify geographic concentrations of improvement or deterioration. Coastal manufacturing regions often lead recovery cycles due to export market exposure and foreign investment presence.
The resolution of China's steel output slump and iron ore import record divergence depends primarily on policy effectiveness and demand recovery timing. While inventory accumulation strategies provide short-term support for iron ore markets, sustainable normalisation requires fundamental improvement in steel consumption across construction and manufacturing sectors. Market participants must monitor policy implementation progress, inventory capacity constraints, and seasonal consumption patterns to anticipate when this unprecedented market paradox will resolve into more traditional supply-demand relationships.
Looking to Capitalise on China's Steel Market Disruption?
Discovery Alert's proprietary Discovery IQ model delivers real-time alerts on significant mineral discoveries across ASX-listed companies, helping investors identify actionable opportunities in iron ore and mining sectors ahead of the broader market. Discover why major mineral discoveries can generate substantial returns by exploring Discovery Alert's dedicated discoveries page, then begin your 30-day free trial today to position yourself for the next market-moving announcement.