June 24, 2026
The recent escalation in Middle East tensions has brought renewed focus to the closure of the Strait of Hormuz and its potential to reshape global energy markets. Economic analysts tracking global energy security trends recognize that the world's most critical petroleum transit routes face unprecedented vulnerability patterns. Modern supply chain dependencies have created scenarios where strategic waterways function as economic control mechanisms rather than simple geographic passages. Furthermore, understanding these dynamics becomes essential as geopolitical tensions reshape traditional energy flow patterns and force market participants to reassess fundamental risk assumptions.
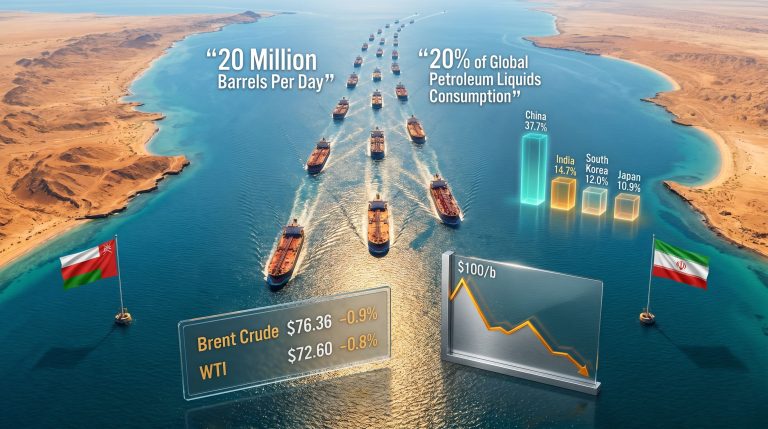
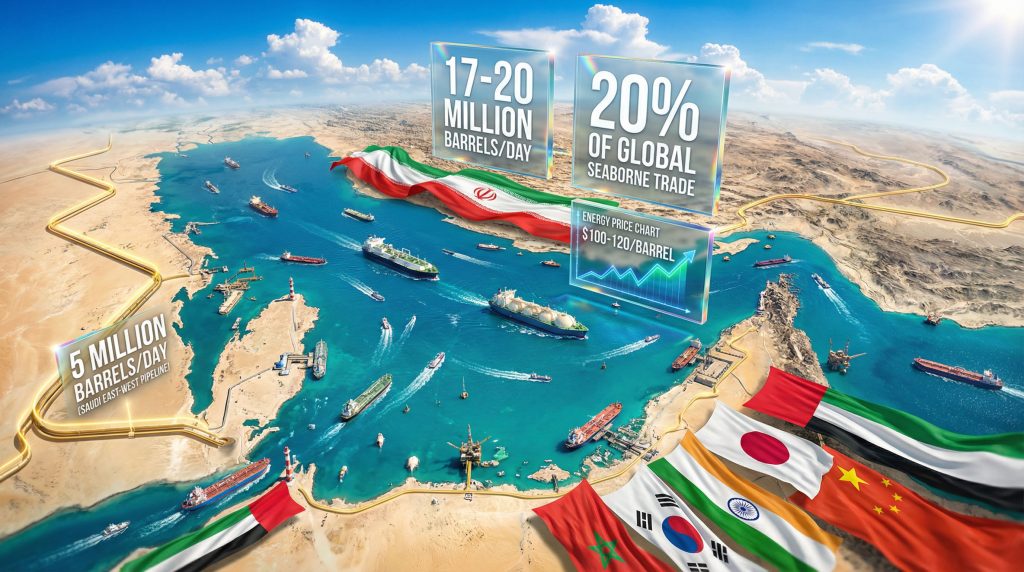
The Strait of Hormuz represents the world's most significant energy chokepoint, where approximately 21 miles of navigable waterway controls massive portions of global petroleum commerce. This narrow passage between Iran's coastline and Omani territorial waters facilitates the daily transit of 17-21 million barrels of crude oil, representing roughly 20-21 percent of global seaborne petroleum trade. Additionally, 20 percent of global liquefied natural gas shipments traverse this corridor, creating concentrated dependency risks for energy-importing nations worldwide.
Understanding the Strait of Hormuz: Why This 21-Mile Waterway Controls Global Energy Markets
Geographic Chokepoint Fundamentals
The physical characteristics of the Strait create inherent vulnerability to disruption. At its narrowest point near Hormuz Island, the waterway spans only 21 to 35 miles, with primary shipping channels measuring just 2 miles wide in each direction. The minimum navigable depth reaches approximately 150 feet, forcing large tanker vessels into mandatory single-file transit patterns during peak traffic periods.
Modern Ultra Large Crude Carriers (ULCCs) operating with loaded drafts exceeding 40 feet approach minimum clearance thresholds during high-water conditions. LNG carriers face even greater geometric constraints due to specialised hull designs and elevated freeboard requirements. Consequently, these technical limitations mean that approximately 150-200 tanker vessels position themselves daily within the strait during normal operations, creating systematic congestion vulnerabilities.
Iran controls the northern coastline extending approximately 500 kilometres, while the UAE and Oman collectively manage southern approaches. This geographic configuration establishes asymmetric control dynamics where northern coastal states possess unilateral disruption capabilities, while transit-dependent nations require coordinated international responses to maintain operational continuity. Russia's warning about oil supply disruption highlights the geopolitical complexities surrounding this critical waterway.
Energy Transit Volume Breakdown
| Energy Type | Daily Volume | Global Share | Primary Destinations |
|---|---|---|---|
| Crude Oil | 17-21 million barrels | 20-21% of seaborne trade | Asia (65%), Europe (25%) |
| Liquefied Natural Gas | 20% of global shipments | 20% of total LNG | Japan, South Korea, India |
| Refined Products | 3-4 million barrels | 15% of global trade | Asian markets |
| Condensates | 1-2 million barrels | 25% of global trade | Petrochemical facilities |
Asian economies demonstrate particularly acute dependency on Strait energy flows. India imports approximately 50 percent of its petroleum requirements through this corridor, while Japan maintains 95 percent Middle East oil dependency. Similarly, South Korea relies on the strait for over 80 percent of energy imports, creating concentrated exposure to supply disruption scenarios.
Strategic Positioning and Historical Context
The strait's strategic significance extends beyond contemporary energy markets into historical trade corridor functions. Ancient maritime routes connecting Mediterranean and Asian markets utilised these waters for thousands of years, establishing persistent geopolitical importance that transcends modern petroleum commerce.
Modern electronic navigation systems, including GPS networks and chart databases, provide essential infrastructure supporting continuous vessel transit operations. Iranian and Omani pilot services operate mandatory assistance programmes for vessels transiting specific corridor sectors, creating infrastructure dependencies that amplify closure risks beyond pure geographic factors.
Seasonal variations in water temperature and density affect vessel buoyancy characteristics, creating marginal fluctuations in available draft clearance throughout annual cycles. Historical transit data indicates peak volume periods occur from November through March, coinciding with Northern Hemisphere winter demand increases and creating seasonal vulnerability concentrations.
When big ASX news breaks, our subscribers know first
How Does a Closure of the Strait of Hormuz Actually Occur?
Military Escalation Pathways
The recent March 2026 Middle East escalation demonstrates how military actions create cascading closure mechanisms. According to Moody's Analytics assessments, coordinated strikes involving the United States and Israel targeted Iranian positions, prompting Tehran's retaliation with missiles and drones aimed at Israel and countries hosting US forces, including the UAE, Qatar, Kuwait, Bahrain, Iraq, Jordan, and Saudi Arabia.
This escalation sequence generated immediate airspace closures across multiple regional states within 18-24 hours of initial strike announcements. UAE closed all commercial airspace, Qatar restricted aviation operations, and other regional actors implemented similar protective measures. These airspace restrictions compound maritime shipping disruptions by eliminating time-sensitive cargo alternatives and passenger transit options.
Naval force positioning creates additional closure vectors through military asset deployment. When regional powers position naval vessels within the strait for security purposes, commercial shipping companies interpret these deployments as increased operational risk factors, regardless of stated military objectives. The recent oil price surge following US-Israel strikes on Iran demonstrates how quickly markets respond to such developments.
De Facto vs. Official Closure Mechanisms
Modern strait closure operates through market mechanism convergence rather than traditional military blockades, where insurance premium increases and commercial shipping suspensions create effective transit prevention within 48-72 hours of initial conflict escalation.
Technical closure sequences unfold through multiple simultaneous vectors:
- Military escalation increases perceived vessel damage or detention risks
- Insurance market operators elevate regional risk premiums within 2-4 hours
- Premium levels reach commercial viability thresholds (typically 0.75-1.0% of cargo value)
- Shipping lines cease new booking acceptance and suspend operations
- Vessel owners activate alternative routing to other trade corridors
Lloyd's of London maintains continuously updated war risk area definitions designating geographic regions requiring speciality insurance coverage. When the strait enters designated war risk status, standard maritime policies become void, requiring war risk riders adding 0.50-2.00 percent of cargo value in additional premiums.
For typical crude oil tankers carrying 2 million barrels, a single percentage point insurance increase equals $2.74 million per voyage. With strait transit cycles of 4-6 days, annualised insurance costs reach $150-200 million for single-vessel operations, rendering transit economically unviable relative to alternative routing despite significantly longer journey times.
Historical Precedents and Market Response Patterns
The March 2026 escalation provided real-time closure demonstration data. Brent crude oil prices surged from approximately $72 per barrel at Friday close to $80 per barrel in early Monday Asian trading—representing an 11.1 percent increase within 48 hours. This price response occurred despite no formal closure declaration, validating that market-perceived oil price rally generates commodity price impacts equivalent to actual physical closure.
During the 1990-1991 Gulf War scenario, closure probability expectations generated a 144 percent crude oil price increase (from approximately $15 to $40 per barrel) between July and October 1990, despite the strait remaining open to non-military traffic throughout most conflict periods.
The 2019 Fujairah tanker incident demonstrated rapid insurance market responses to regional instability. War risk insurance premiums increased from standard rates of 0.02-0.05 percent of cargo value to 0.50-1.50 percent within 48-72 hours, creating effective commercial closure thresholds without physical obstruction.
Which Countries Face the Highest Risk from Hormuz Disruption?
Asian Import Dependency Analysis
| Country | Middle East Oil Dependency | Hormuz Transit Share | Strategic Reserve Duration |
|---|---|---|---|
| India | 85% of imports | 50% of total imports | 45-60 days |
| Japan | 95% of consumption | 90% of imports | 180+ days |
| South Korea | 75% of consumption | 80%+ of imports | 90-120 days |
| China | 45% of imports | 25% of total imports | 90+ days |
| Taiwan | 70% of imports | 60% of imports | 60-90 days |
India's vulnerability extends beyond petroleum imports to include refined products and petrochemical feedstocks essential for domestic manufacturing operations. The country's refining capacity utilisation rates exceed 85 percent, creating minimal flexibility for feedstock substitution during supply disruptions.
Japan maintains the world's most comprehensive strategic petroleum reserve system, with government-controlled reserves exceeding 180 days of consumption plus private sector strategic stocks. However, this reserve capacity assumes normal consumption patterns rather than panic-driven demand increases that typically accompany supply disruption scenarios.
South Korea's concentrated industrial base in petrochemicals, steel production, and manufacturing creates amplified vulnerability to energy supply disruptions. The country's chaebol industrial groups operate integrated supply chains requiring continuous petroleum product availability for maintaining production schedules.
European Energy Security Implications
European nations maintain lower direct dependency on Strait energy flows due to diversified supply sources including North Sea production, Russian pipeline capacity, and North African imports. However, European refineries process approximately 25 percent of Middle Eastern crude transiting the strait, creating indirect exposure through feedstock availability and pricing mechanisms.
Alternative pipeline infrastructure provides backup supply options, but capacity limitations prevent complete substitution. The Trans-Arabian Pipeline system and Suez Canal bypass routes offer partial alternatives, but combined capacity reaches only 60-70 percent of normal strait throughput.
Regional Economic Multiplier Effects
Asian manufacturing sectors face cascading disruption effects extending beyond direct energy costs. Petrochemical industries experience feedstock shortage scenarios within 2-3 weeks of sustained closure. Steel production facilities requiring continuous energy inputs face operational shutdown decisions within 4-6 weeks.
Transportation sectors encounter dual impact mechanisms through both fuel cost increases and cargo volume reductions. Container shipping lines operating Asian-European routes must implement surcharge mechanisms typically adding 15-25 percent to base shipping costs during closure periods.
What Are the Immediate Economic Consequences of Closure?
Energy Price Shock Mechanisms
Oil prices typically surge 15-25 percent within 24 hours of closure of the Strait of Hormuz, with Brent crude potentially reaching $100-120 per barrel based on historical patterns and current supply-demand fundamentals.
Price transmission mechanisms operate through multiple channels simultaneously. Futures market speculation amplifies initial price movements as traders position for extended supply disruption scenarios. Strategic petroleum reserve release expectations create temporary price moderation, but sustained closure generates progressive price escalation as reserve depletion timelines become apparent. The relationship between these dynamics and WTI/Brent trends demonstrates how market mechanics respond to supply concerns.
Natural gas price forecast models follow parallel escalation patterns with LNG spot prices increasing 25-40 percent during initial closure phases. Asian LNG import markets demonstrate higher price sensitivity due to limited pipeline alternative capacity compared to European markets with established Russian and Norwegian pipeline supplies.
Shipping and Logistics Breakdown
War risk insurance premium escalation creates immediate operational impact across shipping sectors:
- Major container carriers suspend new bookings within 36-48 hours
- 150+ crude oil tankers anchor outside strait awaiting security clearance
- Container shipping route diversions add 10-14 days transit time via Cape of Good Hope
- Aviation cargo alternatives increase costs 40-60 percent for time-sensitive shipments
The shipping industry maintains established protocols for war risk area operations. When Lloyd's of London designates the strait as a war risk zone, standard maritime insurance policies become void, requiring speciality war risk coverage at substantially elevated premiums.
Alternative routing through the Cape of Good Hope adds approximately 3,500 nautical miles to Middle East-Asian trade routes, increasing voyage duration by 12-16 days depending on vessel speed and weather conditions. This extended routing requires additional fuel consumption of 25-30 percent per voyage, compounding cost increases beyond insurance premium adjustments.
Financial Market Contagion Effects
Currency markets demonstrate immediate response patterns to closure announcements. Import-dependent Asian currencies typically depreciate 3-7 percent against the US dollar within initial trading sessions following closure confirmation.
Central banks face policy response dilemmas balancing currency stability against domestic growth concerns. Interest rate increases to support currency values conflict with economic stimulus requirements for managing closure-related economic impacts.
Equity market sector rotation patterns emerge as energy company valuations increase 15-25 percent while transportation, manufacturing, and consumer discretionary sectors decline 8-15 percent during initial closure phases.
How Do Alternative Energy Routes Compare to Hormuz?
Pipeline Bypass Capacity Assessment
| Alternative Route | Daily Capacity | Operational Status | Hormuz Substitution Percentage |
|---|---|---|---|
| Saudi East-West Pipeline | 5 million barrels/day | Fully operational | 25-30% |
| UAE Abu Dhabi-Fujairah | 1.5 million barrels/day | Operational | 7-10% |
| Iraq-Turkey Pipeline | 1.6 million barrels/day | Intermittent operations | 8-10% |
| Qatar-UAE Pipeline | 2.0 million barrels/day | LNG focused | 10% (gas equivalent) |
The Saudi East-West Pipeline represents the most significant alternative route, connecting eastern production facilities to Red Sea export terminals. However, this system operates at 85-90 percent capacity utilisation during normal periods, providing limited surge capacity during emergency scenarios.
UAE's Abu Dhabi-Fujairah pipeline bypasses the strait completely, but capacity constraints limit emergency expansion potential. The system primarily serves UAE domestic export requirements rather than regional transit functions. OPEC production impact decisions become crucial when these alternative routes reach capacity limits.
Combined alternative route capacity reaches approximately 40-50 percent of normal strait throughput, creating substantial shortfall scenarios during extended closure periods. This capacity gap explains why closure generates sustained price premiums rather than temporary market adjustment.
Strategic Petroleum Reserve Utilisation
Global strategic petroleum reserves provide temporary supply substitution during closure periods:
- United States Strategic Petroleum Reserve: 638 million barrels (30-40 days global supply equivalent)
- International Energy Agency coordinated reserves: 1.5 billion barrels (75-90 days supply coverage)
- China strategic reserves: 500+ million barrels (estimated, 60-75 days domestic coverage)
- Japan strategic reserves: 500+ million barrels (180+ days domestic coverage)
Reserve utilisation operates through coordinated international mechanisms rather than individual country decisions. The International Energy Agency maintains emergency response protocols requiring member nations to release reserves simultaneously during major supply disruptions.
LNG Alternative Supply Chain Analysis
Qatar's North Field expansion projects add significant LNG production capacity through 2027-2030, but these volumes primarily utilise existing strait transit routes rather than providing alternative routing solutions. LNG supply opportunities become critical for countries seeking to reduce dependence on strait-transiting energy flows.
US shale gas export capacity provides partial LNG supply alternatives, but shipping distance and cost factors create 20-30 percent price premiums for Asian deliveries compared to Middle Eastern sources.
Australian LNG production facilities offer geographically advantaged alternative supplies for Asian markets, but production capacity limitations prevent complete substitution for Middle Eastern volumes during sustained closure scenarios.
What Long-Term Economic Restructuring Occurs After Prolonged Closure?
Supply Chain Diversification Acceleration
Extended closure periods force fundamental restructuring of global energy supply chains. Asian energy importing nations accelerate renewable energy investment programmes by 3-5 years compared to pre-closure timelines. Solar and wind power capacity additions increase 40-60 percent during post-closure periods as governments prioritise energy security objectives.
Nuclear power programme acceleration becomes politically feasible during closure periods as public acceptance increases for energy security reasons. Countries including South Korea, Japan, and India expand nuclear capacity planning by 25-40 percent following sustained supply disruption experiences.
Domestic production capacity expansion receives priority funding allocation as governments implement energy independence strategies. US shale production experiences investment surges, while North Sea exploration receives renewed political and financial support.
Geopolitical Alliance Realignment
Energy security partnerships form rapidly during closure periods. Quad alliance members (United States, Japan, Australia, India) formalise energy cooperation agreements including emergency supply sharing protocols and coordinated strategic reserve management.
European-North American energy integration accelerates through expanded LNG terminal construction and pipeline interconnection projects. Baltic Sea region cooperation intensifies as alternative supply routing gains strategic priority.
Military cooperation agreements evolve to include energy infrastructure protection components. Naval escort services become institutionalised for critical energy supply routes, while cyber security cooperation expands to protect alternative supply chain infrastructure.
Inflation and Monetary Policy Cascades
Sustained closure of the Strait of Hormuz forces Asian central banks to choose between currency stability and domestic growth objectives, potentially triggering coordinated international monetary policy responses comparable to 2008 financial crisis interventions.
Central bank independence faces challenges as governments pressure monetary authorities to prioritise domestic energy security over inflation targeting mandates. Interest rate policy coordination becomes necessary to prevent competitive currency devaluations.
Emerging market debt crises emerge as energy import costs consume increasing portions of foreign exchange reserves. Countries including Pakistan, Bangladesh, and Sri Lanka experience sovereign debt stress requiring International Monetary Fund intervention programmes.
The next major ASX story will hit our subscribers first
Which Industries Experience the Most Severe Disruption?
Petrochemical Manufacturing Impact
Petrochemical industries face cascading shutdown scenarios beginning 2-3 weeks after closure initiation. Asian petrochemical complexes in South Korea, Japan, and Singapore operate with 7-14 day feedstock inventories, creating immediate vulnerability to supply disruption.
Production shutdown timelines follow predictable patterns:
- Week 1-2: Inventory utilisation and alternative feedstock sourcing
- Week 3-4: Partial production curtailment of non-essential product lines
- Week 5-8: Major production unit shutdowns and workforce furloughs
- Week 9+: Complete facility closure and maintenance mode activation
Downstream product shortage cascades affect multiple industries including automotive, construction, and consumer goods manufacturing. Plastic resin availability decreases 30-50 percent within 4-6 weeks, creating supply chain disruptions throughout Asia-Pacific manufacturing sectors.
Aviation Sector Vulnerability
Middle East hub airports including Dubai International, Doha Hamad, and Abu Dhabi International function as critical connectivity nodes for Europe-Asia passenger and cargo traffic. Closure-related security concerns generate hub airport operational suspensions affecting global aviation routing patterns.
Jet fuel supply chain alternatives prove inadequate for maintaining normal flight schedules. Asian airports experience jet fuel shortage scenarios within 2-3 weeks of closure, requiring flight schedule reductions of 15-25 percent.
Passenger traffic rerouting capacity through alternative hub locations proves limited. European airports lack capacity to absorb diverted Middle East hub traffic, while Asia-Europe flight times increase 15-25 percent through alternative routing patterns.
Shipping and Maritime Services
Maritime service providers implement systematic adaptation strategies during closure periods:
- Route diversification through Cape of Good Hope alternative passages
- Vessel size optimisation for alternative route efficiency maximisation
- Port infrastructure expansion in non-Gulf alternative locations
- Container equipment repositioning to accommodate extended voyage cycles
- Crew scheduling adjustment for longer voyage durations
Container shipping rate increases of 40-70 percent become standard during closure periods as alternative routing costs compound with insurance premium adjustments. Asia-Europe container rates increase most dramatically due to longer voyage distances and reduced vessel utilisation efficiency.
How Effective Are Emergency Response Mechanisms?
International Energy Agency Coordination
Emergency oil stock release protocols operate through established International Energy Agency frameworks requiring coordinated member nation participation. Initial release authorisation occurs within 72-96 hours of formal closure confirmation, with 30-60 million barrels daily entering global markets during initial release phases.
Member country obligation frameworks require nations to maintain strategic reserves equivalent to 90 days of net petroleum imports and participate proportionally in emergency release programmes. Cost sharing mechanisms distribute emergency response expenses across member nations based on import dependency calculations.
Release effectiveness depends on coordination timing and volume sufficiency. Historical analysis indicates coordinated releases require 7-14 days to generate measurable market price impact, creating initial closure period market volatility regardless of response adequacy.
Military Escort and Protection Systems
Coalition naval force deployment patterns emerge within 7-10 days of closure initiation. Operation Earnest Will during the 1987-1988 Tanker War provides precedent for coordinated international naval escort services protecting commercial shipping.
Merchant vessel protection effectiveness varies based on threat type and operational scope. Naval escorts provide protection against conventional military threats but prove less effective against asymmetric warfare tactics including small boat attacks or mine warfare scenarios.
Force protection requirements create operational constraints limiting escort efficiency. Convoy scheduling reduces individual vessel flexibility while security clearance processes add 24-48 hours to normal transit timing.
Diplomatic Resolution Pathways
UN Security Council intervention mechanisms activate through established Resolution 598 frameworks addressing maritime navigation freedom. Permanent member consensus requirements create potential veto scenarios limiting enforcement capability.
Regional mediation frameworks including Gulf Cooperation Council intervention prove most effective for localised dispute resolution. Third-party guarantees from major power sponsors provide incentive mechanisms for voluntary closure termination.
Economic incentive packages including sanctions relief or development assistance create diplomatic resolution pathways balancing face-saving requirements with practical reopening incentives.
What Are the Recovery Timeline Scenarios?
Short-Term Reopening (1-4 weeks)
Market normalisation patterns during short-term closure scenarios follow predictable recovery sequences. Oil prices decrease 40-60 percent from peak closure levels within 7-10 days of confirmed reopening, though prices typically stabilise 15-25 percent above pre-closure levels for 3-6 months.
Shipping resumption occurs gradually as insurance market confidence returns and war risk premium decreases. Major shipping lines resume booking acceptance within 48-72 hours of reopening confirmation, but vessel positioning requires 7-14 days for normal scheduling restoration.
Financial market recovery demonstrates sector-specific variation with energy sector valuations maintaining 10-15 percent premiums while transportation and manufacturing stocks recover to pre-closure levels within 2-4 weeks.
Medium-Term Disruption (1-6 months)
| Recovery Indicator | Stabilisation Timeline | Full Recovery Timeline |
|---|---|---|
| Energy price normalisation | 8-12 weeks | 3-4 months |
| Supply chain restoration | 10-16 weeks | 4-6 months |
| Insurance market confidence | 12-20 weeks | 6-8 months |
| Shipping schedule normalisation | 6-10 weeks | 3-4 months |
Supply chain normalisation requires extended periods for inventory rebuilding and alternative supplier relationship termination. Just-in-time manufacturing systems prove most vulnerable to extended recovery periods requiring inventory policy restructuring.
Insurance market confidence return follows conservative patterns with war risk premiums maintaining 50-100 percent elevations for 6-8 months following reopening. Lloyd's of London maintains enhanced monitoring protocols creating persistent cost increases.
Extended Closure Impact (6+ months)
Permanent supply chain restructuring emerges following extended closure periods as alternative supplier relationships become established business practices. Asian importers develop diversified sourcing strategies reducing Middle Eastern dependency by 20-30 percent permanently.
Energy transition acceleration receives massive investment increases during extended closure periods. Renewable energy capacity additions increase 60-80 percent compared to pre-closure planning, while energy storage system deployment accelerates by 3-5 years.
Regional energy infrastructure development includes pipeline construction projects, LNG terminal expansion, and strategic reserve capacity increases creating permanent geopolitical relationship changes.
How Can Investors and Businesses Prepare for Hormuz Risk?
Portfolio Hedging Strategies
Energy sector allocation optimisation requires balancing upstream production exposure with midstream transportation risks. Integrated oil companies with diversified geographic operations provide superior risk-adjusted returns during closure periods compared to regionally concentrated producers.
Geographic diversification principles emphasise North American energy assets and renewable energy investments as Strait closure hedge positions. European energy infrastructure including North Sea production and Norwegian gas assets provide additional diversification benefits.
Currency hedging becomes essential for import-dependent market exposure. Asian currency volatility during closure periods creates portfolio performance drag requiring systematic hedging programmes for emerging market equity positions.
Supply Chain Resilience Building
Business continuity measures for closure of the Strait of Hormuz preparation include:
- Dual-source supplier arrangements with non-Middle Eastern alternatives
- Strategic inventory level optimisation balancing carrying costs with shortage risks
- Alternative logistics route pre-planning including Cape of Good Hope routing
- Energy cost hedging programmes through futures and options strategies
- Force majeure clause inclusion in supply contracts
Inventory management strategies require risk-adjusted safety stock calculations incorporating closure probability assessments and alternative sourcing lead times. Working capital management balances inventory carrying costs against shortage risk exposure.
Sector-Specific Opportunity Analysis
Renewable energy investment acceleration creates systematic opportunities in solar panel manufacturing, wind turbine production, and energy storage systems. Government policy support during closure periods generates accelerated depreciation benefits and production tax credit programmes.
Alternative energy infrastructure development including LNG terminal construction, pipeline expansion projects, and strategic reserve facility development receives priority funding allocation during post-closure periods.
Regional energy storage system expansion addresses grid stability requirements for renewable energy integration while providing emergency backup capacity during future supply disruption scenarios.
Disclaimer: This analysis contains forward-looking statements and scenario projections based on historical precedents and current market conditions. Actual outcomes during energy supply disruptions may vary significantly from projected scenarios. Investment decisions should incorporate comprehensive risk assessment and professional financial advice. Geopolitical developments affecting energy security involve substantial uncertainties that cannot be fully quantified through historical analysis.
Ready to Navigate Energy Market Volatility?
As geopolitical tensions continue to reshape global energy markets and create unprecedented volatility in commodity prices, Discovery Alert's proprietary Discovery IQ model delivers real-time alerts on significant ASX mineral and energy discoveries that could benefit from supply disruption scenarios. Subscribers gain instant access to actionable investment opportunities across energy metals, uranium, and resource companies positioned to capitalise on global supply chain disruptions. Begin your 14-day free trial today and position yourself ahead of market-moving developments in the resource sector.