
July 19, 2026
Why a 21-Mile Corridor Controls One-Fifth of the World's Oil Supply
Every major oil supply crisis in modern history has eventually traced back to geography. Pipelines can be rerouted, refineries can be rebuilt, and sanctions can be negotiated — but physical chokepoints cannot be engineered away. The Strait of Hormuz sits at the intersection of the Persian Gulf and the Gulf of Oman, stretching just 21 nautical miles at its narrowest navigable point, yet it functions as the circulatory valve for a disproportionate share of global energy. Oil prices and Strait of Hormuz oil flows are inextricably linked — when that valve tightens, the consequences ripple across every crude benchmark, every refinery intake schedule, and every import-dependent economy on earth.
Understanding why these dynamics are so tightly correlated requires moving beyond headlines and examining the structural mechanics of global energy logistics. Furthermore, the events unfolding in mid-2026 offer one of the most instructive case studies in modern energy market history.
When big ASX news breaks, our subscribers know first
The Arithmetic of Irreplaceable Geography
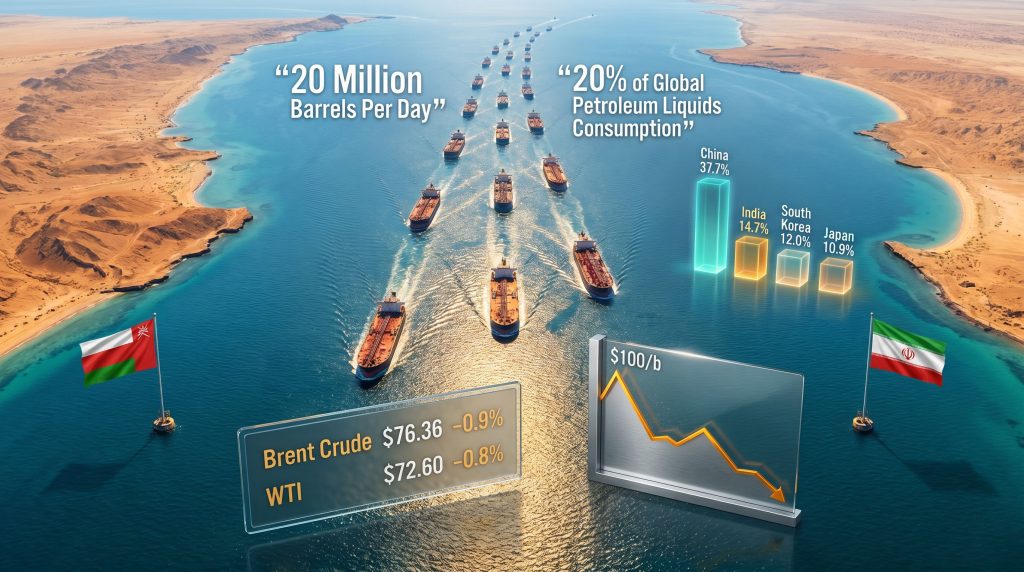
Approximately 20 million barrels per day (b/d) transited the Strait of Hormuz under normal 2024 operating conditions, representing roughly 20% of total global petroleum liquids consumption. More than one-quarter of all seaborne oil trade passes through this single corridor. What makes this figure particularly consequential is the absence of scalable alternatives: the East-West Pipeline traversing Saudi Arabia carries approximately 5 million b/d to the Red Sea at full capacity, and the UAE's Fujairah export terminal offers partial bypass capability, but neither comes close to absorbing the full volume that flows through Hormuz under open conditions.
The dependency distribution is even more striking when broken down by destination:
| Destination | Share of Hormuz Crude Flows |
|---|---|
| China | 37.7% |
| India | 14.7% |
| South Korea | 12.0% |
| Japan | 10.9% |
| Rest of Asia | ~14.9% |
| Rest of World | ~10.8% |
Critical Context: Asia absorbs approximately 89.2% of all crude oil transiting the Strait of Hormuz. Any meaningful disruption to Hormuz oil flows is, first and foremost, an Asian energy security event — with geopolitical and economic consequences that radiate outward from Beijing, New Delhi, Seoul, and Tokyo before they reach Western capitals.
This geographic concentration of dependency creates a structural asymmetry in risk exposure that markets frequently underestimate during periods of stable transit. Consequently, monitoring current crude oil prices becomes essential for understanding how quickly sentiment can shift.
What the 2026 Disruption Actually Removed from Global Supply
At peak disruption during the 2026 Iran conflict, an estimated 14 million barrels per day of oil output was effectively shut in, representing approximately 14% of total global demand. Vessel traffic through the strait was diverted by over 90% as commercial operators suspended transit operations amid active hostilities. The scale of this withdrawal from available supply had no modern precedent in terms of speed and geographic concentration.
Asian refiners bore the sharpest immediate impact. Facilities in China, India, South Korea, and Japan collectively represent the world's largest concentration of refining capacity oriented around Persian Gulf crude grades. When Hormuz flows collapsed, these refiners faced an acute sourcing crisis with limited viable short-notice alternatives. West African crudes, Russian barrels, and U.S. crude exports absorbed some demand, but spot premiums for these alternative grades spiked as buyers competed for limited available tonnage.
The price response was predictable in direction if not in magnitude. According to Wood Mackenzie analysis, Brent crude surged sharply above $100 per barrel, and at the height of the disruption, some analyst scenario models placed the upper price range near $170/b if the strait had remained closed for an extended period.
The Price Floor Mechanism: Why $100 Held Even After the Ceasefire
When the initial U.S.-Iran ceasefire was announced, Brent crude fell approximately 15% in a rapid repricing of geopolitical risk premium. However, prices stabilised near the $100/b threshold rather than collapsing to pre-conflict levels. The reason was structural rather than speculative.
An Iranian military source confirmed to Fars News Agency that vessel passage through the strait was being permitted on a daily quota basis, coordinated through Iran's Revolutionary Guards Navy. This is a fundamentally different operating environment from the open commercial navigation that prevailed before hostilities. A quota-managed strait — even one where tankers are moving — is not a freely operating strait. Markets priced that distinction with considerable precision.
Three Forces Driving the Current Price Slide
As of late June 2026, Brent crude futures have retreated to approximately $76.36 per barrel, a decline of 0.9% on the session, while WTI has slipped to $72.60, down 0.8%. Both benchmarks touched their lowest levels since early March, reflecting the convergence of three simultaneous positive supply developments. These oil price movements have caught many traders off guard given the speed of the reversal.
1. Improving Strait of Hormuz Transit Volumes
Ship-tracking data confirmed that multiple stranded supertankers resumed passage through the strait following the ceasefire framework. The United Nations shipping agency activated an evacuation plan to facilitate the clearance of hundreds of vessels that had been anchored or forced to reroute. ING commodity strategists noted in a research note that vessel crossings through the strait increased in recent days, though volumes remain materially below pre-conflict baseline levels — a qualification markets are weighing carefully.
2. U.S. Sanctions Waiver for Iranian Oil Exports
Washington granted Tehran a 60-day sanctions waiver as part of initial peace negotiations, permitting Iran to resume crude oil sales into global markets. This decision expanded available supply at precisely the moment when improving Hormuz throughput was already reducing the scarcity premium embedded in futures pricing. Analysts at Mitsubishi UFJ Research and Consulting identified the combination of easing sanctions and recovering shipment flows as placing simultaneous downward pressure on crude benchmarks.
3. Lebanon De-escalation Removes Secondary Risk Premium
Reduced hostilities in Lebanon eliminated a separate geopolitical risk layer that had been embedded in crude pricing. Energy markets had been partially pricing a broader regional conflict scenario encompassing multiple simultaneous flashpoints; the parallel easing compressed that combined premium more rapidly than many traders had anticipated. In addition, the trade war impact on oil had already introduced volatility into pricing models, making the scale of this latest correction particularly significant.
The Inventory Data Complication
One data point introduced a modest counterweight to the broadly bearish price narrative. The American Petroleum Institute reported a crude stock drawdown of 765,000 barrels for the week ending June 19. A Reuters poll of nine analysts had projected an average drawdown of approximately 4.5 million barrels — meaning the actual inventory reduction came in considerably smaller than consensus expectations.
This divergence matters because it signals that demand absorption has not yet triggered the inventory depletion levels that would support a price floor independently of supply-side improvements. In other words, the current price decline is being driven almost entirely by supply-side optimism rather than by any softening of underlying demand. Should diplomatic conditions deteriorate, the demand-side fundamentals would offer limited cushion against renewed price pressure.
The Critical Distinction Between Reopening and Normalisation
Warning for Market Participants: A strait operating under daily vessel quotas enforced by a military authority is not commercially equivalent to a strait operating under standard international maritime law. The price implications of these two states are materially different, and the transition between them is neither automatic nor guaranteed.
Several unresolved dimensions complicate the normalisation narrative:
- Oman and Iran agreed to continue discussions on navigation administration, meaning the governance framework for transit remains under active negotiation rather than settled
- U.S. Secretary of State Marco Rubio publicly stated that any Iranian attempt to impose transit fees on commercial vessels would constitute a violation of international law, signalling ongoing friction over operational terms
- A significant factual discrepancy emerged publicly regarding nuclear negotiations: President Trump stated Iran had agreed to nuclear inspections extending indefinitely, while Tehran explicitly denied making any such concession
- Senior economist Tomomichi Akuta at Mitsubishi UFJ Research and Consulting assessed that meaningful advancement in nuclear talks could return oil prices to pre-conflict levels, but also implicitly acknowledged that the current partial-progress state leaves considerable uncertainty in both directions
This public divergence between U.S. and Iranian statements about the scope of nuclear commitments represents the single highest-impact uncertainty variable for oil price direction over coming months. However, the relationship between OPEC market influence and these geopolitical shifts adds yet another layer of complexity to price forecasting.
Scenario Analysis: Price Pathways Under Different Diplomatic Outcomes
| Scenario | Strait Status | Estimated Brent Price Range |
|---|---|---|
| Full diplomatic resolution, open transit restored | Unrestricted commercial navigation | $65–$75/b |
| Managed partial reopening (current trajectory) | Quota-based, coordinated transit | $75–$90/b |
| Nuclear talks collapse, renewed hostilities | Strait re-restricted or closed | $100–$170/b or higher |
The next major ASX story will hit our subscribers first
Supply Recovery Timelines: Why Physical Logistics Lag Diplomatic Progress
Even when political agreements hold, physical supply recovery involves sequential operational steps that cannot be compressed beyond certain physical limits:
- Vessel repositioning and clearance of accumulated backlog at anchorage points
- Port congestion management at Persian Gulf export terminals
- Cargo rescheduling between producers, traders, and destination refineries
- Refinery intake adjustments to accommodate resumed Persian Gulf crude grades
- Infrastructure integrity assessments at export terminals following the conflict period
Maritime intelligence assessments indicate that full supply recovery to pre-conflict norms could take several months even under optimistic diplomatic conditions. The U.N.-facilitated vessel evacuation is a logistical process measured in weeks, not days, involving hundreds of commercial ships of varying size and cargo type.
The Asian Refinery Recalibration Problem
A less-discussed but commercially significant complication affects Asian refiners specifically. During the disruption period, refineries in China, India, South Korea, and Japan pivoted to alternative crude sources under emergency procurement conditions. Spot market premiums for West African, Russian, and U.S. crude grades rose sharply as buyers competed for available supply.
As Hormuz oil flows recover, those spot premiums for alternative crudes will compress — potentially rapidly. Refiners who locked in term contracts for alternative crudes during the disruption period face contract and logistics recalibration costs as Persian Gulf supply returns. The pricing dislocation between different crude grades during this transition period creates both risk and opportunity for sophisticated market participants.
India and South Korea, as the second and third-largest Hormuz-dependent importers respectively, face the most immediate procurement recalibration decisions given the scale of their exposure and the relatively limited flexibility of their refinery configurations.
Long-Term Structural Lessons: What the 2026 Crisis Permanently Changed
The 2026 disruption quantified a risk that energy security analysts had modelled for decades but financial markets had chronically underpriced. The concentration of one-fifth of global oil consumption through a single 21-mile navigable corridor represents a structural vulnerability with no short-term engineering fix. Furthermore, according to EIA analysis of global energy flows, the Hormuz corridor has long been identified as the world's most critical oil transit chokepoint, a reality this crisis has brought into sharp focus.
Several longer-term strategic responses have gained renewed urgency:
- Strategic petroleum reserve adequacy: The IEA and national energy ministries across Japan, South Korea, and India are expected to reassess reserve benchmarks in light of how quickly domestic supply buffers were consumed during the disruption
- Hormuz bypass infrastructure: Saudi Arabia's East-West Pipeline and UAE's Fujairah terminal represent the primary existing bypass assets, but their combined capacity of roughly 5–7 million b/d remains far below normal Hormuz throughput
- Demand-side resilience investment: Countries with the highest Hormuz exposure accelerated conversations about EV adoption timelines and industrial fuel-switching programmes as structural demand hedges
- LNG terminal diversification: Import-dependent economies are reassessing the value of LNG import capacity as a complement to pipeline and tanker-dependent crude supply chains
Strategic Insight: The 2026 Hormuz disruption has materially strengthened the long-term investment case for energy infrastructure diversification across import-dependent Asian economies — including expanded strategic storage, alternative pipeline corridors, and demand-side resilience programmes. These are multi-decade infrastructure commitments that the crisis accelerated from aspirational to urgent.
Frequently Asked Questions: Oil Prices and Strait of Hormuz Oil Flows
How much oil flows through the Strait of Hormuz daily?
Based on 2024 baseline data, approximately 20 million barrels per day transited the strait under normal conditions, representing roughly 20% of global petroleum liquids consumption and more than 25% of total seaborne oil trade.
Why did oil prices fall after the Hormuz situation improved?
Three factors converged simultaneously: increased vessel crossings through the strait, a 60-day U.S. sanctions waiver allowing Iran to resume oil exports, and reduced hostilities in Lebanon. Together these developments removed multiple supply-risk premiums embedded in crude pricing, pushing Brent futures toward four-month lows near $76–$77 per barrel. The oil price rally that preceded this decline had already stretched valuations, making the correction more pronounced.
Which countries are most exposed to Strait of Hormuz disruptions?
Asian economies carry the greatest structural exposure. China (37.7% of Hormuz flows), India (14.7%), South Korea (12.0%), and Japan (10.9%) collectively account for the overwhelming majority of crude oil transiting the strait. Consequently, any renewed disruption would disproportionately affect these nations' energy security and economic stability.
Could oil prices spike again if diplomatic talks break down?
Analysts have modelled Brent crude potentially reaching $100–$170 per barrel or higher in a scenario where the strait reverts to restricted or closed status. The current partial reopening under military quota management means full price normalisation remains contingent on durable diplomatic progress. Moreover, UNCTAD research on Hormuz disruptions highlights the particularly severe burden such shocks place on vulnerable, import-dependent economies that have limited capacity to absorb sustained price spikes.
What is the current transit status of the Strait of Hormuz?
As of late June 2026, oil prices and Strait of Hormuz oil flows remain in a state of cautious recovery, with transit operating under a daily quota system coordinated by Iran's Revolutionary Guards Navy. While supertankers have resumed passage and a U.N.-facilitated vessel evacuation is underway, maritime conditions remain materially different from pre-conflict open commercial navigation.
Want to Track the Next Major Resource Opportunity Before the Market Does?
Discovery Alert's proprietary Discovery IQ model delivers real-time alerts on significant ASX mineral discoveries, cutting through complex data to surface actionable investment opportunities the moment they hit the market — explore historic examples of exceptional discovery returns to understand what's possible, and begin your 14-day free trial today to position yourself ahead of the broader market.