
June 25, 2026
The Fractional Reality Beneath Every Silver Futures Contract
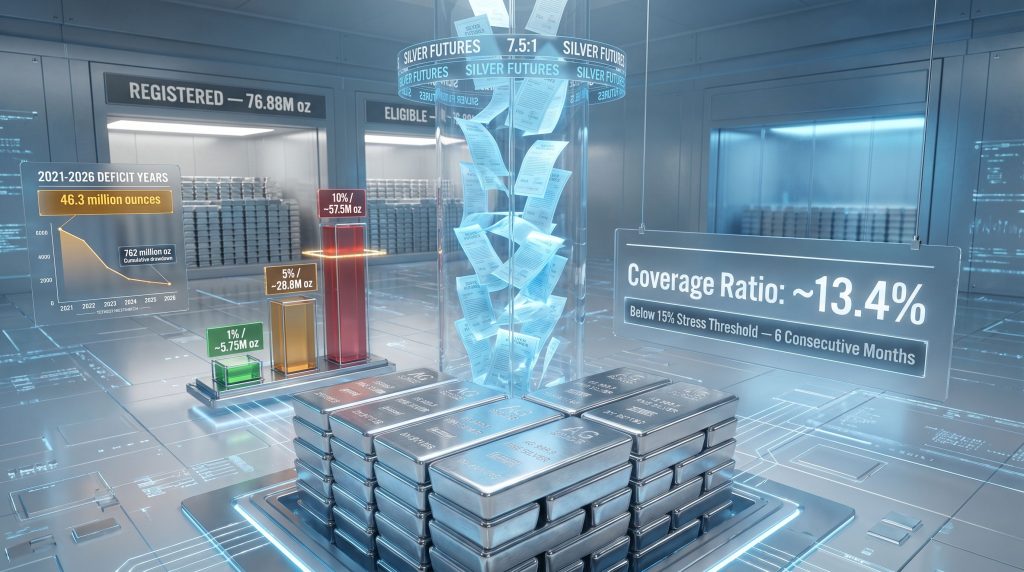
Commodity futures markets are built on an elegant fiction: that the vast majority of participants will never actually want the physical goods they are technically entitled to receive. For crude oil, soybeans, and natural gas, this assumption holds comfortably across decades of trading history. For silver, however, that assumption is being tested in ways that have not been seen in years. The COMEX silver coverage ratio, a metric that quantifies how much registered physical metal backs outstanding paper claims, currently sits at approximately 13.4% and has remained below the widely observed 15% stress threshold for six consecutive months. Understanding what that number means, and what it does not mean, is one of the more valuable exercises available to silver investors right now.
When big ASX news breaks, our subscribers know first
How the COMEX Silver Futures System Is Actually Designed to Work
The Fractional Delivery Model Explained
The COMEX silver futures market was never designed to function as a warehouse receipt system. Its primary purposes are price discovery and risk hedging, and it achieves both efficiently because most participants have no intention of demanding physical metal. Each standard silver futures contract on COMEX represents 5,000 troy ounces of silver, and open interest at any given time reflects the aggregate of all outstanding paper claims across all active delivery months.
Historically, between 97% and 99% of all COMEX silver contracts are resolved through cash settlement or by rolling positions forward into the next contract month, never triggering a physical delivery obligation. This design means the total paper exposure in the market routinely and deliberately exceeds the physical metal available to back it. The system is not broken when this occurs. It is functioning exactly as intended.
What changes the risk profile is not the existence of this gap, but the size of the gap relative to realistic delivery scenarios. The COMEX silver coverage ratio is the instrument market analysts use to measure precisely that. Furthermore, understanding silver's dual nature as both a precious metal and an industrial commodity helps explain why delivery pressure dynamics are uniquely complex for this market.
"The COMEX silver futures market operates on the assumption that most participants will never demand the underlying metal. The coverage ratio measures how thin that assumption has become at any given point in time."
When the Design Assumption Breaks Down
The fractional delivery model remains stable under two conditions: first, that delivery demand stays within historical norms of roughly 1–2% of open interest; and second, that the registered inventory pool is large enough to absorb even moderate delivery surges without becoming depleted. When either condition deteriorates, the model moves from stable to stressed. Right now, both conditions are under pressure simultaneously.
What the COMEX Silver Coverage Ratio Measures and How to Calculate It
The Precise Definition
The COMEX silver coverage ratio is defined as the proportion of total open futures interest, expressed in ounces, that could theoretically be settled using only the registered silver inventory held in CME Group-approved warehouses. The formula is straightforward:
"COMEX Silver Coverage Ratio = (Registered Silver Inventory ÷ Total Open Interest in Ounces) x 100"
The critical word in that definition is registered. Not all silver stored in COMEX-approved facilities counts. Only metal that has been formally warranted and made available for futures contract delivery enters this calculation. The distinction between registered and other vaulted inventory is what makes the ratio genuinely informative rather than superficially reassuring.
Current Data: April–May 2026
Based on CME Group COMEX Daily Metal Stocks Report data from April 2026, the current figures are as follows:
| Metric | Value (April 2026) |
|---|---|
| Registered Silver Inventory | ~76.88 million oz |
| Total Open Interest (Ounces) | ~575.5–576 million oz |
| COMEX Silver Coverage Ratio | ~13.4% |
| Paper-to-Physical Leverage Ratio | ~7.5:1 |
| Stress Threshold (Analyst Benchmark) | 15% |
| Consecutive Months Below Threshold | 6 months |
Source: CME Group, COMEX Daily Metal Stocks Report, April 2026
What the 15% Stress Threshold Represents
The 15% level is not a regulatory trigger or an exchange-imposed circuit breaker. It is an operational benchmark developed through analyst convention, representing the point at which the registered pool becomes thin enough that even moderate delivery demand spikes become structurally difficult to absorb without price disruption. Coverage ratios above 30–40% are generally considered well-buffered. Between 15–30% represents moderate tightness. Below 15% is where the system begins operating with meaningfully reduced margin.
The current 13.4% reading is notable not just for its level, but for its persistence. Six consecutive months below the stress threshold without recovery represents one of the more extended periods of structural tightness in recent COMEX history. Analysts tracking silver market backwardation have noted that this kind of sustained pressure is rarely seen in isolation from broader structural imbalances.
Registered vs. Eligible Silver: The Distinction Most Investors Miss
Two Categories, One Vault, Very Different Meanings
One of the most consequential misunderstandings in retail silver market analysis involves treating all COMEX-vaulted silver as interchangeable. The CME Group classification system creates two fundamentally distinct categories:
-
Registered silver: Formally warranted and immediately available for futures contract delivery. This is the only category included in the COMEX silver coverage ratio calculation. Registered inventory can be delivered against an open futures contract without any further action by the warehouse or owner.
-
Eligible silver: Stored in the same CME Group-approved vaults and meeting all exchange quality standards, but privately owned and withheld from the delivery pool. Eligible silver cannot be used to settle a futures contract until the owner voluntarily converts it to registered status.
| Characteristic | Registered Silver | Eligible Silver |
|---|---|---|
| Available for Futures Delivery? | Yes | Not until converted |
| Counted in Coverage Ratio? | Yes | No |
| Ownership | Exchange-warranted | Privately held |
| Quality Standard | Exchange-approved | Exchange-approved |
| Conversion Possible? | N/A | At owner's discretion |
Why This Distinction Changes the Analysis
When analysts reference "total COMEX vault silver" without separating registered from eligible holdings, they present a picture of delivery capacity that is significantly more comfortable than the operational reality. The combined pool of registered plus eligible silver is substantially larger than the registered pool alone, but that larger figure has no direct bearing on how many contracts can actually be settled.
"When delivery pressure mounts, eligible silver provides no relief unless the private owner actively chooses to convert it. The conversion involves administrative steps and associated costs, and nothing in the current data suggests this is happening at scale."
The reasons why eligible silver holders have not converted their metal to registered status despite six months of below-threshold coverage include several plausible explanations:
- Private holders may have strategic or industrial commitments that make their silver unavailable
- The conversion process involves warehousing fees, assay costs, and registration administrative requirements that owners may not view as worthwhile at current price levels
- Some eligible silver may be custodially committed to ETF structures or long-term industrial supply agreements
- Owners may not be incentivised by the current price environment to make metal available for exchange delivery
None of these barriers disappear automatically in a delivery crunch. The eligible pool is a contingent resource, not a guaranteed backstop.
Paper Leverage in the Silver Market: Operating Range vs. Operating Risk
Understanding the 7.5:1 Leverage Ratio
The approximately 7.5:1 ratio of paper silver exposure to registered physical inventory sits within COMEX's historical operating range of roughly 5:1 to 8:1. This matters for context: leverage at this level is not an aberration. The system was designed to function with it, and during periods when the registered pool is larger and delivery demand stays within historical norms, it does.
The key analytical distinction is between leverage being within historical range and leverage being low-risk given current conditions. The former is true. The latter requires also evaluating the registered pool's size, the persistence of the supply deficit, and delivery demand dynamics. On all three counts, current conditions present a more constrained backdrop than the leverage ratio alone implies.
What Happens When Delivery Demand Rises
The risk scenario is not abstract. If delivery demand were to rise from its historical 1–2% baseline toward 5–10% of open interest, the consequences for the registered pool would be dramatic:
| Delivery Demand % | Ounces Required | % of Registered Pool Consumed |
|---|---|---|
| 1% (historical norm) | ~5.75 million oz | ~7.5% |
| 3% | ~17.3 million oz | ~22.5% |
| 5% | ~28.8 million oz | ~37.5% |
| 10% | ~57.5 million oz | ~74.8% |
Based on ~575.5 million oz total open interest and ~76.88 million oz registered inventory. Source: CME Group, April 2026
At 5% delivery demand, more than a third of the entire registered pool would be required for settlement in a single cycle. At 10%, the pool would be functionally depleted. Neither scenario requires a coordinated market event to occur. Delivery demand can rise organically during price rallies, supply scarcity signals, or periods of heightened geopolitical uncertainty. Consequently, analysts monitoring silver short squeeze dynamics have flagged these thresholds as meaningful trigger points.
January 2026: A Live Demonstration
The January 2026 COMEX delivery cycle provided a concrete illustration of how rapidly registered inventory can move. During a single week in January 2026, 33.45 million ounces exited the COMEX registered silver inventory pool, representing the departure of metal that had previously underpinned a substantial portion of the market's delivery capacity. What followed is equally important: the pool was not subsequently replenished to pre-drawdown levels.
Entering the May 2026 delivery cycle, the registered base remained structurally smaller than it was before January's activity. According to COMEX first notice day reporting, the pace of delivery intentions heading into May 2026 warranted close observation given the compressed registered pool.
This episode did not produce a COMEX default or a market failure. However, it demonstrated two things that are directly relevant to the current stress reading: first, that the deliverable pool can contract by very large amounts very quickly; and second, that the replenishment mechanism does not operate automatically or rapidly enough to restore the buffer in short order.
"The January 2026 drawdown did not trigger a crisis. What it revealed was that the system has a rapid contraction mechanism and a slow recovery mechanism, and that those two speeds are mismatched in ways that matter when coverage is already thin."
Six Years of Structural Deficit: The Macro Context Behind the Coverage Stress
A Supply Imbalance That Is Not Cyclical
The compressed COMEX silver coverage ratio does not exist in isolation. It sits against a global silver supply backdrop that has been in structural deficit for an extended and, by historical standards, unusual period. The persistent silver supply deficits documented across recent years form the macro foundation beneath the current exchange-level stress. According to the World Silver Survey 2026, published by the Silver Institute and Metals Focus on April 15, 2026, the global silver market is on track to record its sixth consecutive annual deficit in 2026, with a projected shortfall of 46.3 million ounces.
The cumulative scale of the drawdown across this period is considerable:
| Year | Market Status | Notes |
|---|---|---|
| 2021 | Deficit Year 1 | Drawdown begins |
| 2022 | Deficit Year 2 | Pace accelerates |
| 2023 | Deficit Year 3 | Continues uninterrupted |
| 2024 | Deficit Year 4 | No surplus recovery |
| 2025 | Deficit Year 5 | Confirmed deficit |
| 2026 (projected) | Deficit Year 6 | 46.3M oz projected shortfall |
| Total 2021–2026 | ~762 million oz drawn from above-ground stocks |
Source: Silver Institute / Metals Focus, World Silver Survey 2026, published April 15, 2026
What Reduced Above-Ground Stocks Mean for COMEX
The World Silver Survey 2026 characterises the current environment as one where above-ground silver liquidity will be structurally thinner going forward, with price volatility structurally larger as a consequence. This assessment carries particular weight because it reflects cumulative deterioration rather than any single-year anomaly.
The direct connection to COMEX registered inventory is straightforward: the physical pool backstopping paper claims is drawn from a global stock base that has been shrinking every year without interruption since 2021. When above-ground stocks decline persistently, the reservoir from which registered inventory can be replenished becomes shallower. This is the mechanism by which a macro supply deficit translates into exchange-level delivery stress.
It is important to distinguish between two interpretations of this dynamic. Cyclical inventory tightness occurs when short-term demand spikes temporarily drain stocks, followed by restocking as supply responds. Structural drawdown, however, which is what six consecutive deficit years represents, is cumulative and self-reinforcing: each year's deficit compounds the previous year's reduction, leaving progressively less slack in the system.
The next major ASX story will hit our subscribers first
How the COMEX Silver Coverage Ratio Affects Different Types of Silver Investors
Mapping Exposure by Holding Type
The practical relevance of the COMEX silver coverage ratio varies significantly depending on how an investor holds their silver exposure. The framework below maps each major holding type against its direct exposure to COMEX delivery mechanics:
| Silver Holding Type | Direct Coverage Ratio Exposure | Physical Settlement Risk |
|---|---|---|
| Allocated physical (coins, bars, segregated vault) | None – held outside COMEX system | None |
| Silver ETF (major, physically allocated) | Indirect via authorised participant mechanics | Low under normal conditions |
| Unallocated account | Moderate – counterparty dependent | Elevated if counterparty stressed |
| COMEX futures (cash-settled) | High – directly exposed to delivery dynamics | Moderate |
| COMEX futures (delivery-intended) | High – directly exposed to registered pool | High when coverage is thin |
Why Physical Ownership Sits Outside This Framework
Investors holding specific, audited, and segregated physical silver in their own name are not exposed to COMEX delivery mechanics. Their metal exists independently of the futures market settlement system. No delivery event, registered pool depletion, or coverage ratio deterioration alters their position, because their silver is not part of the claim structure the coverage ratio measures.
This is the operational distinction that separates owning silver from holding a claim on silver. Paper instruments, regardless of how they are structured, involve a counterparty. Allocated physical metal held in a named, segregated vault does not. In addition, the broader mechanics of LBMA and COMEX markets illuminate how interconnected these global precious metals systems are, and why stress in one venue can ripple across others.
What the Coverage Ratio Can and Cannot Tell You
Precision about what this metric measures prevents two common investor errors: over-reacting to it as a crash signal, and dismissing it as irrelevant.
- What it measures: The margin between outstanding paper silver claims and the registered physical inventory available to satisfy physical settlement demands
- What it does not measure: Price direction, the probability or timing of a delivery default, or the solvency of any specific counterparty
- How it amplifies volatility: When delivery demand rises against a thin registered pool, the market must respond either by attracting new metal into registered status or by discouraging delivery demand, both of which operate through price signals that amplify moves in both directions
"A low COMEX silver coverage ratio does not forecast an imminent market failure. It indicates that the physical delivery architecture of the silver futures market has less capacity than usual to absorb delivery demand spikes without amplifying price volatility."
Key Monitoring Indicators: What to Watch Going Forward
A Practical Surveillance Framework
The COMEX silver coverage ratio is a daily metric, and its direction matters as much as its absolute level. The following indicators provide a structured basis for tracking whether conditions are improving or deteriorating:
| Indicator | Stress Signal | Recovery Signal |
|---|---|---|
| Registered inventory trend | Declining week-over-week | Sustained weekly increases |
| Eligible-to-registered conversion rate | Near zero | Accelerating conversions |
| Open interest vs. registered ratio | Rising above 7.5:1 | Declining toward 5:1 |
| Delivery notices issued (active month) | Rising sharply | Declining or stable |
| Annual supply deficit trajectory | Sixth consecutive year | Surplus or reduced deficit |
| Coverage ratio level | Holding below 15% | Recovery above 20–25% |
Primary data source: CME Group, COMEX Daily Metal Stocks Report (published daily). Secondary source: Silver Institute / Metals Focus, World Silver Survey (published annually, April).
The most important of these to monitor in real time is the registered inventory trend during active delivery months. It was precisely this data that revealed the January 2026 drawdown as it occurred, and it will be the first signal of whether May 2026 delivery activity creates further compression or allows some modest recovery.
Frequently Asked Questions About the COMEX Silver Coverage Ratio
What constitutes a healthy coverage ratio level?
Coverage ratios above 30–40% are generally regarded as well-buffered by exchange analysts. Readings between 15–30% indicate moderate tightness. Below 15% is defined as stress territory. The current reading of approximately 13.4% has persisted in stress territory for six consecutive months, which is an unusually prolonged period by recent historical standards.
Why does total vault inventory overstate delivery capacity?
Total COMEX vault figures combine registered and eligible silver into a single number. The coverage ratio uses only registered silver — the portion formally warranted for delivery. Eligible silver, while vaulted in approved facilities, cannot be delivered against a futures contract until its owner initiates a conversion. Referencing total inventory without this distinction overstates actual delivery capacity by a potentially significant margin.
Has a partial delivery squeeze occurred recently?
The January 2026 episode, in which 33.45 million ounces departed registered inventory within a single week, illustrates how rapidly delivery-related pressure can drain the registered pool. A full squeeze would require delivery demand to rise sharply and remain elevated for an extended period, which is historically unusual. The current preconditions — including a thin registered pool, elevated open interest, and a six-year macro supply deficit — represent a more constrained backdrop than has typically preceded past delivery stress events.
Do major silver ETFs rely on COMEX registered inventory?
No. Physically-backed silver ETFs hold allocated metal in their own custodial facilities, separate from COMEX warehouse stocks. However, authorised participants who interact with both markets during ETF share creation and redemption cycles create indirect linkages. Sustained registered inventory tightness on COMEX can therefore affect ETF premium dynamics and the mechanics of large-scale redemptions during periods of physical stress.
What is the current paper-to-physical leverage ratio?
As of April 2026, approximately 7.5 paper ounces of silver futures exposure exist for every one registered ounce available for delivery. This sits within COMEX's historical operating range of approximately 5:1 to 8:1. The relevance of this ratio increases significantly when combined with sub-15% coverage and a prolonged macro supply deficit, as is the case currently. For further context, silver coverage ratio analysis published ahead of the May 2026 delivery window confirms the metric was already approaching stress levels before delivery activity began.
Sources: CME Group, COMEX Daily Metal Stocks Report; Silver Institute / Metals Focus, World Silver Survey 2026; Investing.com, Silver Coverage Ratio Analysis, April 2026.
Disclaimer: This article is for informational and educational purposes only. It does not constitute financial or investment advice. Past performance is not indicative of future results. All investments, including precious metals, involve risk. Readers should consult a qualified financial adviser before making any investment decisions.
Want to Know When the Next Major Silver Discovery Hits the ASX?
Discovery Alert's proprietary Discovery IQ model scans ASX announcements in real time, instantly identifying significant mineral discoveries — including silver — and translating complex data into clear, actionable investment insights for both short-term traders and long-term investors. Explore how historic discoveries have generated substantial returns on Discovery Alert's dedicated discoveries page, and begin your 14-day free trial today to position yourself ahead of the broader market.