August 3, 2026
The Byproduct Problem: Why Silver's Supply Crisis Has No Easy Fix
Most commodity supply crunches eventually self-correct. Higher prices attract new capital, new mines come online, and the market rebalances. Silver is different. The structural architecture of global silver production means that price signals alone cannot unlock meaningful new supply, and understanding why requires looking past the spot price and into the geology and economics of base metal mining.
Approximately 70% of global silver production is extracted not from dedicated silver mines but as a co-product of copper, zinc, and lead operations. When the economics of those primary metals deteriorate, silver output contracts regardless of where silver prices are trading. Conversely, when silver prices surge, miners cannot simply pivot their operations to chase the premium. The silver comes when the base metal economics justify the mine, and not before.
This structural rigidity sits at the heart of what the Silver Institute now characterises as a sixth consecutive annual silver supply deficits, projected at approximately 46.3 million ounces in 2026, according to Metals Focus projections cited by the Silver Institute.
Against this backdrop, COMEX silver deliveries and silver supply deficit dynamics are not simply futures market events. They represent a stress signal playing out against a multi-year backdrop of inventory depletion and demand growth that increasingly defies the metal's traditional price behaviour. Specifically, COMEX silver deliveries exceeding 37 million ounces in July 2026 highlight the severity of this trend.
When big ASX news breaks, our subscribers know first
COMEX Silver Deliveries: Understanding What the Numbers Actually Mean
The Mechanics of a Futures Delivery
COMEX silver deliveries are frequently misunderstood, even by experienced market participants. When a futures contract reaches expiry and a holder elects to take delivery, this does not automatically mean physical silver bars are transported out of a vault. In the majority of cases, the transaction involves a transfer of warehouse warrant ownership. The metal remains in the same COMEX-approved vault, but the legal title changes hands.
What makes delivery activity meaningful as a market signal is not the volume in isolation but the context in which it occurs. Specifically, the critical variable is whether registered inventory levels are declining concurrently and whether that decline is outpacing any replenishment. Furthermore, the broader silver market squeeze dynamics add an additional layer of urgency to this analysis.
Registered vs. Eligible Inventories: The Distinction That Matters
COMEX silver inventories are split into two categories that carry very different implications for deliverable supply:
| Inventory Category | Definition | Market Signal |
|---|---|---|
| Registered | Available for delivery against futures contracts | Direct measure of deliverable supply |
| Eligible | Stored in COMEX vaults but not contracted for futures delivery | Potential buffer, not guaranteed to convert |
| Registered (2020 Peak) | ~346 million ounces | Historical high-water mark |
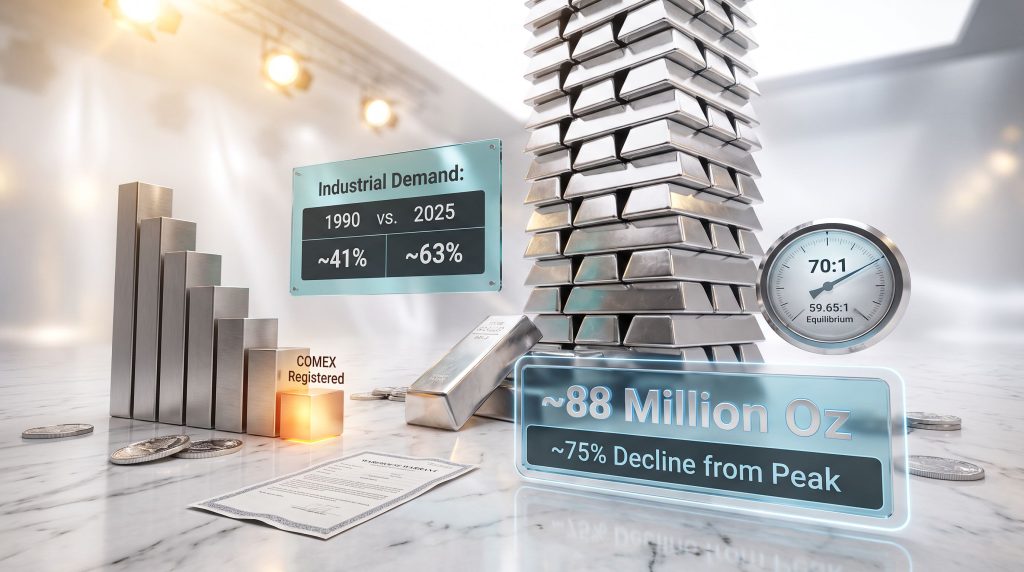
| Registered (Feb 2026) | ~88 million ounces | Approximately 75% below peak |
The roughly 75% decline in registered inventories from the 2020 peak to February 2026 is among the most significant structural data points in the current silver market narrative. Eligible inventory can theoretically be reclassified as registered, but this requires the consent of the vault owner and is not guaranteed under market stress conditions. Treating eligible silver as a straightforward buffer for registered shortfalls overstates the available supply cushion.
Key Concept: Delivery volumes become a genuine physical scarcity signal only when three conditions are present simultaneously: registered inventories are at or near multi-year lows, delivery volumes are elevated relative to that depleted registered stock, and ETF inflows confirm physical accumulation rather than speculative futures positioning.
In July 2026, all three of those conditions were met. July COMEX delivery notices tracked at approximately 116 contracts at time of reporting, set against the backdrop of June's approximately 996 contracts and the broader registered inventory position near multi-year lows. Major silver ETFs recorded rising holdings and net inflows concurrently, suggesting the demand pressure was not simply futures-driven speculation but reflected genuine physical accumulation.
Six Years of Deficits: Mapping the Structural Supply-Demand Imbalance
A Deficit That Has Outlasted Multiple Economic Cycles
The silver supply deficit that began in 2021 has now persisted through interest rate hiking cycles, a period of significant US dollar strength, equity market volatility, and shifting industrial policy landscapes. The fact that the deficit has not only survived but widened across these varied conditions speaks to its structural rather than cyclical character.
| Year | Deficit Status |
|---|---|
| 2021 | Deficit Year 1 |
| 2022 | Deficit Year 2 |
| 2023 | Deficit Year 3 |
| 2024 | Deficit Year 4 |
| 2025 | ~40.3 million ounces |
| 2026 (Forecast) | ~46.3 million ounces |
Source: Silver Institute / Metals Focus projections
Why a 2% Demand Decline Still Produces a Widening Deficit
One of the less intuitive aspects of the 2026 supply picture is that total silver demand is projected to decline modestly, yet the deficit is forecast to widen. The explanation lies on the supply side:
- Global silver supply is also projected to contract by approximately 2% in 2026
- Producer hedging activity has been normalising, reducing the volume of forward supply commitments that previously cushioned the market
- Net silver output from primary and byproduct mines is constrained by base metal project economics, not silver price incentives
- The combined effect of symmetric supply and demand contraction still produces a larger absolute deficit because the supply side is contracting from a structurally lower base
This dynamic is not widely appreciated in mainstream commodity analysis. Most deficit discussions focus on demand acceleration as the driver, but in silver's case, supply-side rigidity is at least an equal co-conspirator in widening the imbalance.
How Industrial Demand Permanently Altered Silver's Price Behaviour
From Monetary Relic to Industrial Essential
Silver's identity in financial markets has undergone a multi-decade transformation that fundamentally changes how the metal responds to economic conditions. Indeed, silver's industrial role has reshaped the entire demand landscape. In 1990, industrial applications accounted for approximately 41% of fabrication demand. By 2025, that share had risen to approximately 63%, according to Silver Institute data.
| Demand Category | 1990 Share | 2025 Share |
|---|---|---|
| Industrial Fabrication | ~41% | ~63% |
| Investment and Monetary | Higher relative proportion | Reduced relative share |
| Photography | Significant | Negligible |
| Jewellery and Silverware | Moderate | Moderate |
The practical implication of this shift is profound. Industrial users of silver, from solar panel manufacturers to semiconductor producers to EV battery system assemblers, have limited ability to substitute away from silver when prices rise. The metal's unique electrical conductivity, thermal properties, and reflectivity make it irreplaceable in many high-precision applications.
This creates what economists describe as price-inelastic demand at the industrial consumption level. Unlike investment demand, which responds sensitively to price levels and alternative asset returns, industrial silver consumption continues regardless of spot price movements, so long as the economics of the end product remain viable.
Structural Insight: The secular rise of silver in solar photovoltaic manufacturing is particularly significant. Each new generation of solar cell technology has historically required more silver per unit of electricity generated, not less, as cell efficiency improvements have come through designs that use more silver contact points per wafer. This trend creates a compounding demand dynamic that is unlikely to reverse in the near term.
Geopolitical and Macro Variables Amplifying Physical Silver Market Stress
Supply Risk Premiums and the Dollar Effect
The mid-2026 silver rally drew on geopolitical fuel that extended well beyond the silver market itself. Two specific events elevated broader commodity supply risk premiums during this period:
- A Houthi embargo targeting Saudi-linked shipping through the Red Sea corridor disrupted global shipping confidence and lifted energy and commodity risk premiums simultaneously
- An attack on the Caspian Pipeline Consortium's Black Sea export terminal introduced further uncertainty into energy commodity supply chains, with knock-on sentiment effects across metals markets
Separately, weaker-than-expected US manufacturing data softened the US dollar, creating a secondary demand catalyst. The inverse relationship between dollar strength and silver prices is well-established: a weaker dollar reduces the effective cost of silver for buyers operating in other currencies, expanding the pool of price-competitive demand precisely when physical supply is constrained.
Macro Insight: Dollar weakness functions as a demand multiplier for silver rather than a fundamental driver. When it coincides with structural supply deficits and elevated COMEX delivery activity, the amplification effect on price can be disproportionate to the underlying dollar move.
Gold-to-Silver Ratio: Reading the Relative Value Signal
What the Current Ratio Tells Investors About Silver's Positioning
The gold-to-silver ratio is one of the most widely tracked relative value metrics in precious metals investing, yet it is frequently misapplied as a short-term trading signal when its true utility lies in longer-duration positioning analysis. Conducting thorough gold-silver ratio analysis helps investors contextualise silver's current positioning within broader market cycles.
| Metric | Value |
|---|---|
| Gold:Silver Ratio (End of June 2026) | 70:1 |
| Modelled Long-Run Equilibrium | 59.65:1 |
| Current Premium Above Equilibrium | ~17% |
| Historical Median Time to Close Half the Gap | 17.3 months |
A ratio of 70:1 against a modelled equilibrium of 59.65:1 implies silver is approximately 17% undervalued relative to gold on a mean-reversion basis. Historically, when the ratio has been positioned at a similar premium above equilibrium, it has taken a median of 17.3 months to close approximately half that gap.
Investors who treat this as a near-term price catalyst are likely to be disappointed. The ratio normalisation process is typically gradual, involving multiple partial closures and reversals before equilibrium is approached. The signal's value lies in identifying a probabilistic medium-term tailwind for silver relative to gold, not in predicting a specific catalyst or timeline.
The next major ASX story will hit our subscribers first
Three-Scenario Framework for Silver in H2 2026
Bull, Base, and Bear Cases Across Key Variables
| Scenario | Fed Policy Assumption | Dollar Direction | Silver Price Implication | Key Risk |
|---|---|---|---|---|
| Bull Case | Fed holds rates | Neutral to weaker | Breakout above $59.75 confirmed | Geopolitical escalation accelerates deficit pressure |
| Base Case | Fed holds rates | Stable | Retest of $59.75 if EMA50 holds | Delivery activity normalises without sustained follow-through |
| Bear Case | September rate hike above 55% probability | Strengthens materially | EMA50 breaks, rally reverses | Echoes the preceding 36% drawdown |
The January to May 2026 Drawdown as a Bear Case Reference
Silver's 36% decline from its January 2026 high to the end of May 2026 provides the most instructive recent precedent for bear case sizing. Gold declined approximately 18% over the same period. This asymmetric drawdown reflects silver's characteristically higher beta relative to gold, amplifying both upside and downside price movements.
The bear case trigger in the current environment is relatively specific: a Federal Reserve rate hike at the September meeting priced above a 55% probability by markets. A rate hike in that context would strengthen the dollar, undermine the price-inelastic industrial demand narrative, break EMA50 technical support, and compress mining equity valuations more severely than physical silver prices.
Technical Levels, Catalysts, and a Monitoring Framework for Investors
Key Price Levels at the Time of Analysis
| Technical Level | Significance |
|---|---|
| $59.50 | Active trading zone during rally |
| $59.75 | Daily close above this level confirms breakout |
| EMA50 | Trend integrity line; breach weakens rally case |
| $60.00 | Psychological resistance and next material target |
What to Monitor Going Forward
Bullish confirmation signals:
- A daily close above $59.75 on sustained volume
- Continued decline in COMEX registered silver inventories without offsetting replenishment
- Weekly ETF holdings data showing sustained net inflows into physical silver vehicles
- The Federal Reserve holding rates at its next scheduled meeting
Bearish warning signals:
- A close below EMA50 support on above-average volume
- September Fed rate hike probability rising above the 55% threshold
- The gold-to-silver ratio pushing materially above 70:1
- COMEX delivery activity normalising while registered inventories begin recovering
Comparing Silver Exposure Vehicles: Physical, ETFs, and Mining Equities
Operational Leverage and Its Double-Edged Nature
| Exposure Type | Leverage to Silver Price | Liquidity | Key Risk |
|---|---|---|---|
| Physical Silver (Bullion) | 1:1 | Lower | Storage and insurance costs |
| Silver ETFs | Approximately 1:1 with tracking | High | Fund structure and counterparty considerations |
| Primary Silver Miners | 2x to 4x operational leverage | Variable | Operational, cost inflation, and equity market risk |
Primary silver miners such as Endeavour Silver and First Majestic Silver outperformed spot silver during the mid-2026 rally, reflecting the operational leverage that makes mining equities attractive during sustained price uptrends. However, the same leverage that enhances gains during rallies amplifies losses during corrections. For a broader view of how these dynamics fit together, precious metals market analysis provides essential context for positioning decisions.
Investor Warning: Mining equities that outperformed during the mid-2026 rally carry proportionally amplified downside exposure during corrections. The January to May 2026 drawdown demonstrated this clearly, with silver declining roughly double the rate of gold and mining equities suffering even deeper losses in many cases. Position sizing must account for this asymmetric risk profile.
Frequently Asked Questions: COMEX Silver Deliveries and the Silver Supply Deficit
What does it mean when COMEX silver deliveries are described as unusually high?
Elevated COMEX silver delivery volumes indicate that a meaningful number of futures contract holders are electing to take physical delivery rather than rolling forward. In most instances, this involves a transfer of warehouse warrant ownership rather than physical bar removal. The stress signal becomes material when elevated delivery volumes coincide with declining registered inventories, as was the case in July 2026. COMEX silver inventory data provides a useful real-time reference for tracking these fluctuations.
Is the silver supply deficit structural or cyclical?
The current six-year deficit has structural characteristics that set it apart from typical commodity cycles. Because approximately 70% of silver supply is a byproduct of base metal mining, production cannot respond efficiently to silver price incentives. Meanwhile, industrial demand from solar manufacturing, AI infrastructure, and electric vehicle systems is growing on a secular basis. These dynamics suggest the deficit is likely to persist beyond a single commodity price cycle. According to analysis from Disruption Banking, the scarcity of precious metals is increasingly drawing institutional attention as market pressures intensify.
Why can silver miners not simply increase output to close the deficit?
Because the majority of global silver production is a byproduct of copper, zinc, and lead operations, production decisions are governed by base metal economics. A silver-producing mine cannot increase silver output in isolation if the primary metals that justify the operation's economics do not support expanded throughput. This constraint is geological and structural, not a function of capital availability or operational will.
How should investors interpret the gold-to-silver ratio signal?
The ratio measures how many ounces of silver are required to purchase one ounce of gold. A ratio elevated above its long-run equilibrium, as was the case at 70:1 versus a modelled equilibrium of 59.65:1 in mid-2026, historically signals silver is undervalued relative to gold on a mean-reversion basis. Historical patterns suggest closing approximately half that gap takes a median of 17.3 months, making this a medium-term positioning tool rather than a short-term trading signal.
Disclaimer: This article is for informational purposes only and does not constitute financial or investment advice. All forecasts, scenario projections, and price targets discussed herein involve inherent uncertainty and should not be relied upon as predictions of future performance. Investors should conduct their own due diligence and consult a qualified financial adviser before making investment decisions. Past performance of silver prices, mining equities, or gold-to-silver ratio behaviour is not a reliable indicator of future outcomes.
Want to Catch the Next Major ASX Mineral Discovery Before the Broader Market Does?
Discovery Alert's proprietary Discovery IQ model delivers real-time alerts on significant ASX mineral discoveries across more than 30 commodities, turning complex geological and market data into actionable insights for both short-term traders and long-term investors — explore historic discoveries and their returns to understand the opportunity, then begin your 14-day free trial today to position yourself ahead of the market.