August 21, 2026

Why the Next Decade Could Be Defined by Commodities, Not Equities
Across financial history, the rotation from financial assets to real assets has rarely arrived with a clear announcement. Instead, it tends to build quietly beneath the surface, driven by the slow accumulation of monetary imbalances, geopolitical friction, and structural supply deficits, until the pressure becomes undeniable. That moment appears to be arriving now, and understanding why the commodity bull market and gold silver prices are moving the way they are requires more than reading a price chart. It requires examining the architecture of the global monetary system itself.
When big ASX news breaks, our subscribers know first
The Structural Foundation of This Commodity Bull Market
From Cyclical Bounce to Secular Upcycle
Not every commodity rally earns the label of a supercycle. Most price recoveries are mean-reversion events, corrections from oversold conditions driven by temporary supply disruptions or short-term demand surges. A genuine commodity supercycle is something categorically different: a multi-decade rotation driven by fundamental mismatches between supply investment and demand growth, often accompanied by a deteriorating monetary backdrop.
History offers instructive precedents. The commodity supercycle of the 1970s was fueled by dollar debasement following the collapse of Bretton Woods, an oil embargo, and stagflation. The 2000s supercycle was driven by China's industrial emergence and years of chronic underinvestment in mining and energy infrastructure. Both cycles lasted a decade or longer and rewarded patient investors who understood the underlying forces before consensus caught up.
The current cycle, which began gaining momentum in 2024, shares features with both prior supercycles but has its own distinct character. Four macro pillars are supporting it simultaneously:
-
Declining real interest rate expectations, which have a historically inverse relationship with gold pricing. As real yields fall or turn negative, the opportunity cost of holding non-yielding hard assets diminishes, making gold and silver structurally more attractive.
-
Structural U.S. dollar weakness, rooted in an expanding fiscal deficit and a debt trajectory that many economists view as unsustainable without some form of monetisation. The dollar has already lost approximately 97% of its purchasing power since the Federal Reserve was established in 1913, a figure that underscores the long-run fragility of fiat currency systems.
-
Central bank gold buying at multi-decade highs, with institutions across the Global South and Asia replacing dollar reserves with physical gold, a trend that represents a quiet but profound shift in global reserve management.
-
Converging industrial and investment demand, particularly across silver, copper, and energy transition metals, where the same materials required for clean energy infrastructure are also serving as safe-haven vehicles.
Unlike previous commodity rallies driven by a single catalyst, the current upcycle is being supported simultaneously by monetary policy uncertainty, geopolitical realignment, and industrial demand. This convergence historically produces sustained, multi-year price appreciation rather than brief cyclical spikes.
Current Gold and Silver Prices: What the Market Is Pricing In
The 2025 Price Snapshot
The commodity bull market and gold silver prices story in 2025 is not speculative. It is already visible in real-time pricing data across spot, futures, and physical bullion markets. Furthermore, the consistency across platforms adds considerable weight to the broader bullish thesis.
| Metal | Spot Price (2025) | COMEX Futures | Physical Bullion (1 oz / 1,000 oz bar) |
|---|---|---|---|
| Gold | ~$4,500 to $4,576/oz | Near record highs | $4,449 to $4,615/oz |
| Silver | ~$65 to $68/oz | Elevated across exchanges | ~$66 to $68/oz |
The consistency of pricing across spot markets, futures exchanges, and retail bullion channels is itself significant. When elevated prices appear on a single platform or exchange, it can reflect localised distortions. When they are validated simultaneously across live metals pricing data, COMEX, and physical dealers, the move reflects genuine broad-based demand.
Understanding the Silver Correction and Recovery
Silver's path to current levels has been more turbulent than gold's. During the consolidation phase that preceded this leg higher, silver experienced a correction of approximately 50% from its peak before reversing. Gold demonstrated considerably more resilience during the same period, reflecting its deeper institutional ownership and its role as the primary safe-haven monetary metal.
This divergence is not unusual. Silver routinely experiences deeper drawdowns than gold during consolidation phases before surging more aggressively when the broader bull market resumes. The metal's dual identity as both a monetary asset and an industrial commodity amplifies its sensitivity to both financial market sentiment and real-world demand signals.
Treasury Market Instability and Its Transmission to Metals
The Long-End Rate Problem
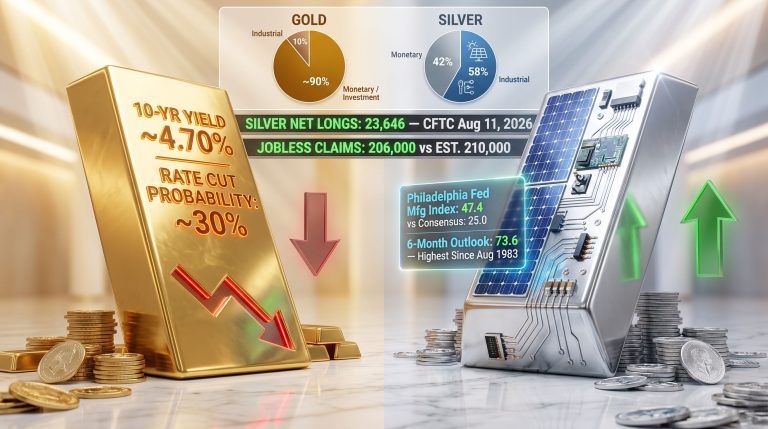
One of the most consequential developments shaping the commodity bull market and gold silver prices in 2025 has been instability in U.S. Treasury markets, particularly at the long end of the yield curve. When the 10-year Treasury yield approaches the 4.65 to 4.70% range, it creates a dual effect: pressure on risk assets valued on discounted future cash flows, and simultaneously, a signal of fiscal stress that supports hard asset demand.
In mid-May 2025, U.S. Treasury Secretary Scott Bessent intervened to address this long-end pressure by announcing increased purchases of long-duration Treasuries to retire them, whilst signalling a shift toward shorter-duration issuance. The market responded immediately, with the 10-year yield pulling back approximately four to five basis points, the dollar weakening, and precious metals prices rising sharply on the session.
Shifting debt issuance from long-duration to short-duration instruments is a maturity schedule rearrangement, not debt reduction. While this can temporarily suppress long-end yields, it does not address the underlying fiscal imbalance driving investor concern. Markets have historically tested such interventions until structural policy changes follow.
This is a critical distinction for investors to understand. Maturity management is a technical tool, not a fundamental solution. Similar interventions in other fiscal contexts, including Japan's yield curve control experiment, ultimately demonstrated that bond markets can overwhelm central authorities when structural imbalances are not addressed.
The Purchasing Power Erosion Argument for Hard Assets
The 97% decline in the dollar's purchasing power since 1913 is frequently cited as an argument for gold and silver ownership, but it is worth examining the mathematical implications more carefully. Even further significant erosion does not necessarily collapse the currency system outright. What it does produce is dramatically higher nominal costs of living and a structural transfer of wealth from holders of financial assets to holders of real assets.
The political economy of this dynamic is equally important. Fiscal austerity, the most direct path to stabilising government debt ratios, is structurally constrained by entitlement spending. Elected officials face strong incentives to expand rather than contract spending, meaning the conditions that support hard asset appreciation are likely to persist regardless of which political party holds power.
Gold vs. Silver: Positioning Across the Cycle
The Historical Pattern of Silver's Outperformance
Within the commodity bull market narrative, gold and silver play distinct roles across different phases. Understanding this sequencing, as supported by detailed gold-silver ratio analysis, is a core component of precious metals investing.
| Metric | Gold | Silver |
|---|---|---|
| Current Price (~2025) | $4,500 to $4,576/oz | $65 to $68/oz |
| Institutional Price Targets | $5,000+ | $100+ |
| Primary Demand Driver | Safe-haven, central bank accumulation | Industrial + investment demand |
| Bull Market Behaviour | Leads early cycle | Lags, then outperforms late cycle |
| Volatility Profile | Lower | Higher |
The historical pattern is well-established: gold typically breaks out first as institutional and central bank demand drives initial price discovery. Silver then lags during this phase before surging more aggressively as the bull market broadens and retail and industrial buyers enter the market. Institutional commentary from major banks such as Citi has highlighted silver as a potential outperformer as this cycle matures.
Silver's industrial exposure adds another layer of complexity. It is a critical input in solar panel manufacturing, electronics, and electric vehicle components, meaning demand is not purely monetary. This dual demand profile creates compounding upside dynamics when both industrial and investment buying converge simultaneously.
Dollar Weakness as the Transmission Mechanism
The inverse correlation between U.S. dollar strength and precious metals pricing is one of the most reliable relationships in financial markets. Dollar-negative policy signals, including Treasury maturity restructuring announcements and Federal Reserve rate pause signals, transmit rapidly into metals pricing because they alter the real return calculation for dollar-denominated assets.
Investors seeking to hedge dollar exposure across a portfolio have historically accessed this through a combination of precious metals, international equities denominated in non-dollar currencies, and local currency emerging market bonds. This multi-asset approach to dollar hedging is more robust than any single position. The gold price forecast for the coming years reflects precisely these dynamics playing out at scale.
The Broadening Commodity Cycle: Beyond Precious Metals
A Multi-Phase Expansion
The commodity bull market is not a single-asset story. It is unfolding in phases across multiple sectors, and understanding where each sector sits in that progression is essential for portfolio positioning.
| Asset Class | Bull Market Phase | Primary Demand Driver |
|---|---|---|
| Gold | Phase 1 (Underway) | Central bank accumulation, safe-haven flows |
| Silver | Phase 2 (Developing) | Industrial demand + investment buying |
| Energy | Phase 2 (Underway) | Supply constraints, geopolitical risk |
| Uranium | Phase 3 (Emerging) | Nuclear energy renaissance |
| Fertilisers / Agriculture | Phase 3 (Emerging) | Food security, supply chain reshoring |
| Timberland | Phase 3 (Emerging) | Inflation hedge, real asset demand |
The precious metals bull market that gained traction in 2024 was joined by energy commodities in 2025. Agricultural commodities, fertilisers, and uranium market trends are now beginning to show the early characteristics of Phase 3 participation. For a commodity upcycle to qualify as a full supercycle, participation must eventually broaden across all major sectors, and the evidence suggests that condition is progressively being met.
The Capex Dependency Risk
One underappreciated vulnerability in the current economic environment is the degree to which U.S. corporate earnings growth, profit margin expansion, and equity market valuations have become dependent on sustained capital expenditure growth. This capex binge, particularly in technology infrastructure and AI-related investment, is extraordinary in scale and has become a foundational assumption embedded in consensus earnings forecasts.
If the capital expenditure cycle decelerates due to rising financing costs, earnings disappointments, or demand softening, the knock-on effects for equity valuations and economic growth could be significant. Hard assets and commodities have historically served as partial buffers during such transitions, as capital rotates from financial assets back into real ones.
This creates an asymmetric risk profile for investors concentrated in growth equities without commodity exposure. The very conditions that might impair equity earnings — rising interest costs, margin compression, demand softness — are the conditions that historically support commodity outperformance.
The next major ASX story will hit our subscribers first
The Frozen Housing Market: A Structural Recession in One Sector
Existing Home Sales at 30-Year Lows
The U.S. housing market occupies a unique position in the current economic landscape. Existing home sales have fallen to their lowest pace in roughly 30 years, an extraordinary statistic when considered alongside the fact that the U.S. population is approximately 80 million people larger than it was when sales were last at these levels. The structural mismatch between population growth and housing supply has been building for decades.
Home Depot's management characterised the housing market as frozen in its most recent earnings commentary, a description that aligns precisely with the data. The core mechanism is the mortgage rate lock-in effect: homeowners who secured mortgages at 3% to 4% have little financial incentive to sell and re-enter the market at current rates. This creates a self-reinforcing supply vacuum that cannot be resolved through demand stimulation alone.
Three conditions would need to materialise simultaneously to genuinely improve housing affordability:
-
Lower mortgage rates that make refinancing financially attractive for existing homeowners, thereby releasing locked-up inventory.
-
A meaningful expansion of housing supply, either through new construction or baby boomer downsizing, to prevent rate-driven demand stimulation from simply pushing prices higher.
-
Sustained income growth that outpaces asset price inflation, allowing younger buyers to accumulate down payments and qualify for mortgages at reasonable debt-to-income ratios.
The risk of rate cuts without supply expansion is particularly acute. Stimulating demand into a constrained inventory environment does not improve affordability. It simply reprices the same limited pool of homes at higher nominal levels, negating the benefit of lower borrowing costs.
For younger generations entering the workforce, the combination of elevated home prices, high mortgage rates, and stagnant real wage growth has made homeownership increasingly difficult to access. This reflects approximately 25 years of compounding policy decisions, not a short-term cyclical disruption.
Portfolio Strategy for a Dollar-Weakening, Commodity Bull Market Environment
Practical Asset Allocation Principles
Constructing a portfolio suited to the current macro environment involves deliberately reducing concentration in dollar-denominated financial assets whilst increasing exposure to real assets across multiple categories. In addition, understanding critical minerals demand adds a further dimension to commodity positioning. A well-structured approach to this rotation might include:
- Precious metals: Gold and silver as core monetary hedges against dollar depreciation and fiscal instability.
- Energy commodities and energy equities: Beneficiaries of Phase 2 commodity expansion and geopolitical supply constraints.
- Fertiliser and agricultural commodity exposure: Emerging Phase 3 participants with food security tailwinds.
- Uranium: A longer-duration energy transition play tied to the nuclear renaissance narrative.
- Timberland: A real asset with inflation-hedging properties and low correlation to financial markets.
- International equities in non-dollar currencies: Providing equity market exposure without adding dollar risk.
- Local currency emerging market bonds: Generating yield while hedging against dollar depreciation.
Time Horizon as a Strategic Advantage
Younger investors occupy a structurally advantaged position in this environment that is often underappreciated. Time horizon is one of the most powerful tools available to any investor, because it allows participation in market cycles that play out over years or decades rather than quarters.
The practical implication is that younger investors can tolerate higher short-term volatility in exchange for superior long-run positioning, using market pullbacks as entry opportunities rather than exit triggers. Methodical, consistent investment through economic cycles has historically been among the most effective approaches available to long-term wealth builders.
Reading Inflation Data: PCE, CPI, and PPI in Sequence
Understanding the sequencing of inflation data releases reduces the risk of being caught off-guard by PCE readings. Because the Consumer Price Index and Producer Price Index are released before the Personal Consumption Expenditures index, markets have already processed most of the relevant information by the time PCE figures arrive. Significant deviations from consensus are rare, which means the PCE release itself is generally less market-moving than its policy significance might suggest.
This sequencing knowledge is practically useful for investors managing around inflation data events, as it suggests that meaningful market reactions to PCE releases, when they occur, often reflect forward guidance signals rather than the inflation number itself. Separately, commodity super cycles provide important historical context for interpreting how these signals compound across extended bull runs.
Frequently Asked Questions: Commodity Bull Market and Gold Silver Prices
Is Now a Good Time to Buy Gold and Silver?
Based on observable macroeconomic indicators, including dollar weakness, Treasury market stress, and central bank accumulation trends, the structural case for precious metals remains intact. Silver experienced a correction of approximately 50% before reversing, and the current evidence suggests that correction phase may have run its course. That said, markets can always test support levels further before confirming a sustained bottom, and position sizing and entry discipline remain important risk management tools regardless of the macro backdrop.
What Price Targets Are Analysts Projecting?
Institutional forecasts for gold point toward $5,000 per ounce or above in the 2025 to 2026 window. Silver price targets from analysts tracking the commodity bull market and gold silver prices suggest a trajectory toward $100 per ounce as the cycle matures and Phase 2 broadening accelerates. These are not consensus figures, but they reflect the upper range of institutional commentary from banks including Citi and from macro-oriented wealth managers tracking the cycle.
What Is the Difference Between a Commodity Supercycle and a Standard Bull Market?
A standard commodity bull market typically lasts two to four years and is driven by a single primary catalyst, such as a supply shock or a demand surge from a specific region. A supercycle spans ten to twenty years and is characterised by multi-sector participation, structural demand drivers that cannot be quickly resolved through new supply investment, and a deteriorating monetary backdrop. The current cycle's combination of monetary policy uncertainty, energy transition demand, and fiscal imbalances gives it supercycle characteristics rather than standard bull market characteristics.
Why Does Dollar Weakness Persist Despite Interventions?
The political economy of fiscal consolidation makes sustained dollar stabilisation through policy action extremely difficult. Entitlement spending, defence commitments, and interest on existing debt create a structural floor on government expenditure that prevents meaningful deficit reduction without politically unacceptable cuts to public services. Until market forces compel fiscal discipline through a genuine bond market crisis, the conditions that support dollar weakness are likely to remain in place, providing an ongoing structural tailwind for commodities and precious metals.
Ready to Capitalise on the Next Major Mineral Discovery Before the Broader Market Does?
Discovery Alert's proprietary Discovery IQ model delivers real-time alerts on significant ASX mineral discoveries — turning complex mineral data into actionable opportunities across gold, silver, copper, uranium, and beyond — making it an essential tool for investors positioning ahead of the commodity supercycle. Explore historic discoveries and their exceptional returns, then begin your 14-day free trial to secure a market-leading edge as the next major upcycle unfolds.