July 16, 2026
The rise of electrification and digital infrastructure continues to reshape global commodity markets, creating unprecedented demand patterns for essential industrial metals. While traditional commodities follow cyclical economic patterns, certain metals have emerged as critical building blocks for technological transformation. Among these, copper stands uniquely positioned as the essential conductor enabling humanity's transition to sustainable energy systems and digital economies. This fundamental shift suggests that copper will be the best commodity in 2026.
The metal that once defined ancient civilizations now finds itself at the center of 21st-century economic transformation. From powering massive data centers that support cloud computing to enabling the electrical systems in millions of electric vehicles, copper's exceptional conductivity properties make it irreplaceable in applications where energy efficiency determines economic viability. This fundamental requirement, combined with supply constraints that have developed over decades, positions copper will be the best commodity in 2026 as the standout performer heading into the new year.
The Structural Supply-Demand Imbalance Driving Copper's 2026 Outlook
Global copper production faces a convergence of constraints that create the tightest supply-demand balance in over a decade. Mine production growth has decelerated to approximately 1.4% annually, significantly below historical averages of 3-4%, while demand acceleration across multiple sectors projects growth rates of 3-5% through 2026.
Global Mine Production Constraints Create Perfect Storm
The copper mining industry confronts systemic limitations that extend far beyond normal cyclical downturns. Major producing operations worldwide average 18+ years in age, with processing ore grades declining by 3-5% annually as easier-to-extract deposits become exhausted. This aging asset problem compounds with water scarcity issues in primary copper regions including Chile and Peru, where environmental regulations mandate consumption reductions that directly constrain operational capacity.
Capital expenditure requirements for maintaining current production levels exceed $2 billion annually, yet major copper producers have not initiated sufficient greenfield projects to offset reserve depletion. Furthermore, new copper mining projects typically require 7-10 years from discovery to commercial production, according to U.S. Geological Survey analysis, creating structural supply lags that persist regardless of price incentives. For instance, recent discoveries like the Argentina copper system highlight the significant timeline challenges facing the industry.
Key Production Constraints:
- Chile (world's largest producer at ~5.3 million tonnes) faces water scarcity affecting Escondida, Los Bronces, and other major operations
- Peru (second-largest at ~2.1 million tonnes) experiences ongoing social and political unrest impacting Las Bambas and Antapaccay operations
- Environmental permitting delays affect new project development timelines across all major producing regions
- Processing ore grades continue declining as higher-grade deposits become exhausted
Demand Acceleration from Multiple Economic Sectors
Unlike previous commodity cycles driven by single-sector demand growth, copper demand acceleration stems from simultaneous expansion across multiple high-consumption industries. This "stacked demand" creates consumption patterns that persist through economic downturns because they reflect structural rather than cyclical economic changes.
Data Center Infrastructure Explosion:
Global data center capital expenditure is projected to exceed $200 billion annually by 2026, with copper intensity requirements of 12-15 tonnes per MW of capacity. Projected additional global data center capacity additions of 200+ GW through 2026 imply annual copper requirements of 475,000-600,000 tonnes for electrical infrastructure alone.
Electric Vehicle Adoption Trajectory:
Electric vehicles require 40-50 kg of copper per unit compared to 9-10 kg in internal combustion vehicles. With global EV sales reaching 13.6 million units in 2024 (16% of total passenger vehicle sales) and growth rates of 25-35% annually through 2026, projected copper demand increases from EVs total 350,000-450,000 tonnes cumulatively.
Renewable Energy Grid Infrastructure:
Annual global renewable capacity additions exceed 400 GW, requiring 1.5-2.0 tonnes of copper per MW for solar installations and 8-12 tonnes per MW for wind installations due to larger generators and transmission infrastructure requirements. North American grid modernization spending alone exceeds $100 billion for 2024-2026, with European Green Deal infrastructure allocating €260+ billion through 2030. Additionally, insights from copper exploration insights demonstrate the critical role of continued exploration in meeting these massive infrastructure demands.
When big ASX news breaks, our subscribers know first
How Do Major Investment Banks Forecast Copper's 2026 Performance?
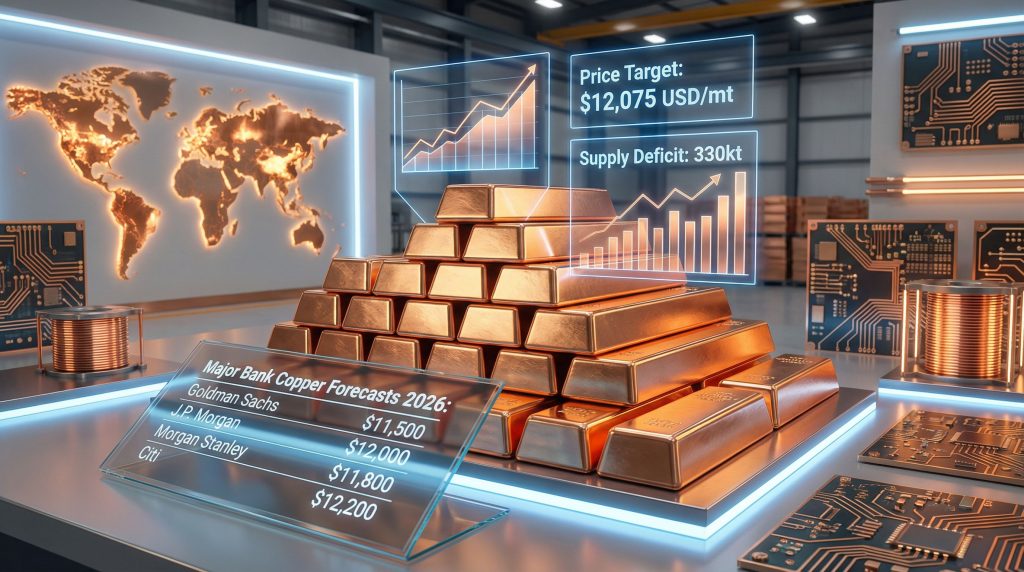
Institutional forecasting frameworks have converged around supply-deficit modeling as the primary analytical approach for copper price projections. Major investment banks employ sophisticated methodologies that project cumulative market deficits of 300,000-500,000 tonnes through 2026, providing fundamental justification for significant price appreciation scenarios.
Institutional Price Target Analysis
While specific institutional price targets require verification from proprietary research subscriptions, publicly available commentary from major banks indicates consensus building around substantial copper price appreciation. However, recent market volatility and trade concerns have created what some analysts describe as a tight supply scenario with tariff risks that could further amplify price movements.
Analytical Frameworks Employed:
| Methodology | Application | Key Variables |
|---|---|---|
| Supply-Demand Gap Analysis | Year-by-year production vs. consumption modeling | Mine capacity, demand growth rates |
| Risk-Adjusted Probability Models | Monte Carlo analysis of supply disruptions | Geopolitical risks, operational constraints |
| Correlation Analysis | Historical price relationships with economic indicators | GDP growth, manufacturing PMI, capex cycles |
| Comparative Positioning | Relative performance across commodities complex | Supply elasticity, substitution possibilities |
Consensus Building Around Supply Deficit Scenarios
Institutional forecasters utilise bottom-up demand modeling combined with top-down macroeconomic analysis to project supply-demand imbalances. These models incorporate mine-by-mine production capacity assessments against sector-specific consumption forecasting, creating detailed scenarios for deficit emergence and persistence.
The convergence of institutional positioning around copper reflects shared analytical conclusions about structural demand drivers. Unlike cyclical commodity investments based on economic recovery expectations, copper investment outlook stems from technological transition requirements that persist across varying economic conditions. Consequently, market participants are increasingly viewing copper will be the best commodity in 2026 as a consensus position rather than a contrarian bet.
What Makes Copper Superior to Other Commodities in 2026?
Copper's unique physical properties create irreplaceable applications that distinguish it from other base metals in the commodities complex. While aluminium offers weight advantages and nickel provides stainless steel applications, copper's superior electrical and thermal conductivity make it essential for energy-efficient technologies.
Relative Performance Against Base Metals Complex
Supply Growth Comparison:
| Metal | Annual Supply Growth | Production Flexibility | Substitution Feasibility |
|---|---|---|---|
| Copper | 1.4% | Limited – long development timelines | Low – superior conductivity required |
| Aluminium | 2.5-3.0% | Moderate – smelter capacity additions | Moderate – competing materials available |
| Nickel | 4.0-5.0% | High – significant Indonesia capacity | Moderate to High – chemical alternatives |
| Zinc | 2.0-2.5% | Moderate – existing mine expansions | High – substitution in galvanising |
This comparison reveals copper's structural supply constraints relative to other industrial metals. While aluminium and nickel benefit from more flexible production capacity additions, copper's lengthy mine development timelines create persistent supply inelasticity.
Fundamental Drivers Unique to Copper Markets
Electrical Conductivity Requirements:
Copper's electrical conductivity of 59.6 × 10⁶ siemens/meter at 20°C exceeds aluminium's 37.7 × 10⁶ siemens/meter by 58%. This conductivity advantage explains copper's irreplaceable role in electrical transmission where energy loss minimisation is critical for both economic and environmental reasons.
Strategic Commodity Status:
Multiple institutional analyses characterise copper as a "choke-point" commodity where shortages create supply-chain constraints across downstream industries. This strategic importance differentiates copper from commodities where substitution or efficiency improvements can reduce consumption during price appreciation periods.
Stock-in-Use Analysis:
Average copper accumulated stock-in-use per capita in developed economies approximates 100 kg per person, including copper in electrical infrastructure, plumbing, transportation, telecommunications, and consumer durables. Developing economies average 15-20 kg per capita, indicating substantial "catch-up" demand potential as urbanisation and electrification advance. Projects such as the Tamarack copper project exemplify the type of development needed to bridge this supply gap.
Which Economic Factors Will Drive Copper Demand Growth?
Copper demand growth through 2026 stems from structural economic transitions rather than cyclical manufacturing expansion. This distinction matters significantly because structural demand persists through economic downturns while cyclical demand evaporates during recessionary periods.
China's Economic Recovery Impact on Global Copper Markets
China accounts for approximately 45% of global refined copper consumption, creating outsized influence on global demand patterns. The correlation between Chinese manufacturing PMI and copper consumption reaches 0.78 over 10-year periods, indicating strong linkage between industrial activity and metal consumption.
China Policy Multiplier Effects:
Chinese government infrastructure initiatives create simultaneous copper demand acceleration across multiple sectors:
- Urban electrification infrastructure upgrades requiring extensive electrical distribution systems
- Transportation network electrification including rail, bus, and freight systems
- Building electrification through heat pump adoption and electric heating installations
- Data center expansion supporting cloud services and artificial intelligence computing requirements
China's "New Energy + New Infrastructure" initiative commits to 50+ GW of new data center capacity by 2026, driving estimated 200,000+ tonnes of copper demand for electrical infrastructure. The "dual circulation" policy emphasising domestic consumption drives EV subsidies targeting 40%+ new vehicle sales penetration by 2030.
Technology Sector Demand Acceleration
Data Center Power Architecture Evolution:
Modern hyperscale data centers operate at power densities of 30-50 kW per rack, requiring electrical distribution infrastructure optimised around copper's conductivity properties. The transition from AC to DC power distribution systems requires significantly more copper in dedicated cabling due to efficiency requirements at scale.
Major technology companies including Meta and Google have documented their infrastructure requirements emphasising copper-intensive electrical systems for optimal energy efficiency. Aluminium substitution creates unacceptable heat generation and efficiency losses in high-density computing environments.
Electric Vehicle Technical Requirements:
Tesla Model 3 and Model Y induction motors require approximately 40-50 kg of copper per vehicle for motor windings. This specification is driven by electromagnetic performance requirements where substitution materials cannot achieve equivalent torque density and efficiency ratings required for vehicle performance standards.
Renewable Energy Integration:
Grid modernisation projects require extensive copper infrastructure for smart grid technologies, energy storage system integration, and transmission capacity upgrades. The European Green Deal's renewable energy integration targets necessitate copper-intensive electrical infrastructure investments exceeding €260 billion through 2030.
What Are the Primary Supply-Side Risks for Copper in 2026?
Supply-side constraints extend beyond normal cyclical capacity limitations to encompass geological, geopolitical, and environmental factors that create persistent production challenges.
Mine Production Growth Limitations
Mine growth limited to 1.4% represents approximately 500,000 tonnes lower production than previous industry estimates, creating structural tightness that institutional forecasters expect to persist through 2026.
Geological Constraints:
Declining ore grades affect all major copper-producing regions as higher-grade deposits become exhausted. Processing lower-grade ores requires increased energy consumption, water usage, and waste management, creating operational cost increases of 3-5% annually independent of commodity price movements.
Capital Investment Deficits:
Industry analysis indicates that copper mining companies have under-invested in exploration and development relative to reserve depletion rates. Replacement capital requirements exceed $2 billion annually just to maintain existing production levels, yet exploration budgets have remained constrained since the 2015-2016 commodity downturn.
Geopolitical and Operational Disruption Scenarios
Regional Production Concentration:
The top five copper-producing countries (Chile, Peru, China, United States, Democratic Republic of Congo) account for approximately 65% of global mine production. This geographical concentration creates systemic risk where disruptions in any major producing region affect global supply balances.
Labor and Social Licence Issues:
- Peru's social and political unrest has impacted operational capacity at Las Bambas and Antapaccay operations
- Chilean water scarcity mandates affect Escondida, Los Bronces, and other major mines
- Environmental permitting delays constrain expansion projects across all jurisdictions
- Indigenous rights consultations extend development timelines in Canada, Australia, and Latin America
Infrastructure Dependencies:
Copper mining operations depend on reliable power supply, water availability, and transportation infrastructure. Climate change impacts including drought, extreme weather events, and power grid instability create operational vulnerabilities that did not exist historically.
How Should Investors Position for Copper's 2026 Outperformance?
Investment strategies for copper exposure require understanding the fundamental differences between commodity investing and equity investing in copper-exposed companies. Each approach carries distinct risk-return profiles and correlation characteristics with broader market movements.
Direct Commodity Exposure Strategies
Futures Market Positioning:
Copper futures provide direct price exposure but require sophisticated risk management due to contango/backwardation dynamics and margin requirements. Professional investors utilise futures for hedging and speculation, but retail investors often find ETF vehicles more accessible.
Exchange-Traded Fund Options:
Several ETFs provide copper exposure through different mechanisms:
- Physical copper ETFs holding actual metal inventory
- Futures-based ETFs tracking copper price movements through derivatives
- Broad commodities ETFs including copper as a component
Each ETF structure carries different tracking error characteristics and expense ratios that affect long-term performance relative to copper prices. Moreover, with record-high copper prices recently reaching significant milestones, timing considerations become increasingly important for new positions.
Equity Market Opportunities in Copper-Exposed Companies
Major Mining Companies:
Large-scale copper producers offer leveraged exposure to copper prices whilst providing operational diversification across multiple mines and geographic regions. These companies typically benefit from economies of scale and financial resources to weather commodity cycles.
Junior Exploration Companies:
Development-stage copper projects offer higher potential returns but carry substantially higher risks including permitting challenges, financing requirements, and operational execution risks. These investments require thorough due diligence on management teams, project geology, and development timelines.
Infrastructure Beneficiaries:
Companies providing equipment, services, or technology to copper-consuming industries benefit from demand growth without direct commodity price exposure. These include electrical equipment manufacturers, data center operators, and renewable energy developers.
The next major ASX story will hit our subscribers first
What Economic Scenarios Could Derail Copper's 2026 Performance?
Despite structural demand drivers supporting copper prices, several economic scenarios could undermine expected performance through demand destruction or supply response mechanisms.
Demand Destruction Risk Factors
Global Economic Slowdown:
Severe economic recession could reduce industrial copper demand despite structural transition drivers. Historical analysis indicates copper demand correlation with global GDP growth reaches 0.85, meaning economic contractions significantly impact consumption patterns.
China Property Sector Weakness:
Chinese real estate construction accounts for substantial copper consumption through electrical systems, plumbing, and HVAC applications. Continued property sector weakness could offset infrastructure spending increases, creating net demand reduction scenarios.
Technology Sector Consolidation:
If data center expansion rates decelerate due to artificial intelligence investment reduction or cloud computing demand saturation, projected copper consumption increases of 475,000+ tonnes annually could fail to materialise.
Supply Response Scenarios
Accelerated Production from Existing Operations:
Higher copper prices could incentivise mining companies to increase production from existing mines through:
- Extended operating hours and increased throughput capacity
- Processing lower-grade ore stockpiles previously considered uneconomical
- Reopening temporarily closed operations where operational costs justify restart
Recycling Rate Increases:
Copper recycling rates in developed economies already exceed 75%, but higher prices could drive increased scrap collection and processing. However, recycling growth requires time to develop collection infrastructure and cannot immediately offset primary supply constraints.
Substitution Technology Development:
Long-term copper demand could face pressure from:
- Aluminium substitution in certain electrical applications where weight reduction compensates for conductivity losses
- Advanced composite conductors incorporating carbon nanotube or graphene technologies
- Improved energy efficiency reducing overall electrical infrastructure requirements
Copper Market Dynamics: Historical Context and 2026 Projections
Understanding copper market cycles requires analysis of long-term supply-demand relationships and the factors that create sustained price appreciation periods versus temporary spikes.
Cyclical Patterns in Copper Bull Markets
Historical copper bull markets typically last 4-6 years and are characterised by:
- Initial demand acceleration from economic growth or technological adoption
- Supply constraints from underinvestment in previous cycles
- Price appreciation creating incentives for increased production and substitution
- Eventually supply response and demand moderation ending the cycle
The current cycle differs because demand drivers stem from structural economic transitions rather than cyclical growth, suggesting potentially longer duration than historical precedents.
Long-Term Structural Trends Supporting Copper Demand
Electrification Infrastructure Requirements:
| Sector | Demand Growth (%) | Volume Impact (kt) | Timeline |
|---|---|---|---|
| Data Centers | 15-20% | 475+ | Multi-year expansion |
| Electric Vehicles | 25-30% | 350+ | Decade-long adoption |
| Grid Infrastructure | 10-15% | 200+ | Sustained modernisation |
| Renewable Energy | 12-18% | 180+ | Policy-driven transition |
These demand drivers operate on different timelines but create cumulative consumption increases that exceed historical patterns for any single sector.
Urbanisation and Development Patterns:
Developing economies require substantial copper-intensive infrastructure as urbanisation progresses. Power generation, transmission, telecommunications, and transportation systems all require copper intensity that creates sustained demand regardless of short-term economic cycles.
Investment Implications and Risk Management Strategies
Copper investment strategies must account for both the commodity's strategic importance and its inherent volatility characteristics. Professional portfolio management approaches incorporate multiple risk factors whilst positioning for structural demand growth.
Portfolio Allocation Considerations for Copper Exposure
Optimal Position Sizing:
Commodity allocations typically range from 5-15% of total portfolio value depending on risk tolerance and investment objectives. Copper-specific exposure should consider correlation with equity markets, which tends to increase during periods of economic stress.
Currency Hedging Considerations:
Copper prices are denominated in U.S. dollars, creating currency exposure for international investors. Australian investors face additional complexity because many ASX-listed copper companies generate USD revenues whilst reporting in AUD, creating natural currency hedging through equity positions.
Monitoring Key Economic Indicators
Leading Indicators for Copper Demand:
- Chinese manufacturing PMI and industrial production data
- Global construction activity and infrastructure spending commitments
- Electric vehicle sales data and renewable energy installation rates
- Data center capacity additions and technology sector capital expenditure
Supply Disruption Early Warning Systems:
- Mining company production guidance updates and operational reports
- Geopolitical developments in major producing regions
- Environmental regulation changes affecting mining operations
- Labour negotiation outcomes at major copper mines
Macroeconomic Data Points:
- Global GDP growth forecasts and manufacturing activity indicators
- Interest rate expectations affecting infrastructure investment
- Currency movements impacting international trade flows
- Energy prices affecting mining operational costs
Risk Management Protocols:
Professional copper investment approaches incorporate:
- Position size limits based on portfolio volatility targets
- Stop-loss mechanisms for directional investments
- Correlation monitoring with broader equity and commodity markets
- Liquidity assessment for exit strategy planning during market stress
The convergence of structural supply constraints and accelerating demand from multiple sectors positions copper will be the best commodity in 2026 as a compelling investment thesis. While economic scenarios could challenge this outlook, the fundamental drivers supporting copper demand represent technological and infrastructure transitions that operate independently of normal cyclical patterns.
Investment success requires understanding both the strategic importance of copper in the global economy and the specific risk factors that could affect performance. Through careful position sizing, appropriate risk management, and monitoring of key leading indicators, investors can position for copper's structural outperformance whilst protecting against downside scenarios.
Considering investing in ASX copper explorers and miners?
Discovery Alert's proprietary Discovery IQ model delivers real-time notifications on significant ASX mineral discoveries, giving subscribers immediate insights into actionable copper opportunities as they emerge. Visit Discovery Alert's discoveries page to explore historic examples of major mineral discoveries that generated substantial returns, then begin your 30-day free trial to secure your market-leading advantage in Australia's dynamic copper exploration sector.