July 16, 2026
Ten Consecutive Weeks of Decline: What the Shrinking U.S. Crude Buffer Really Means
Global oil markets have historically swung between two dominant narratives: glut and scarcity. For most of early 2026, the consensus leaned heavily toward oversupply, with OPEC+ production increases and softening Chinese demand expected to flood the market with excess crude. That thesis has now been completely dismantled. US crude inventories fall 1.7 million barrels as Iran tensions rattle markets, and understanding why requires looking well beyond a single weekly data point.
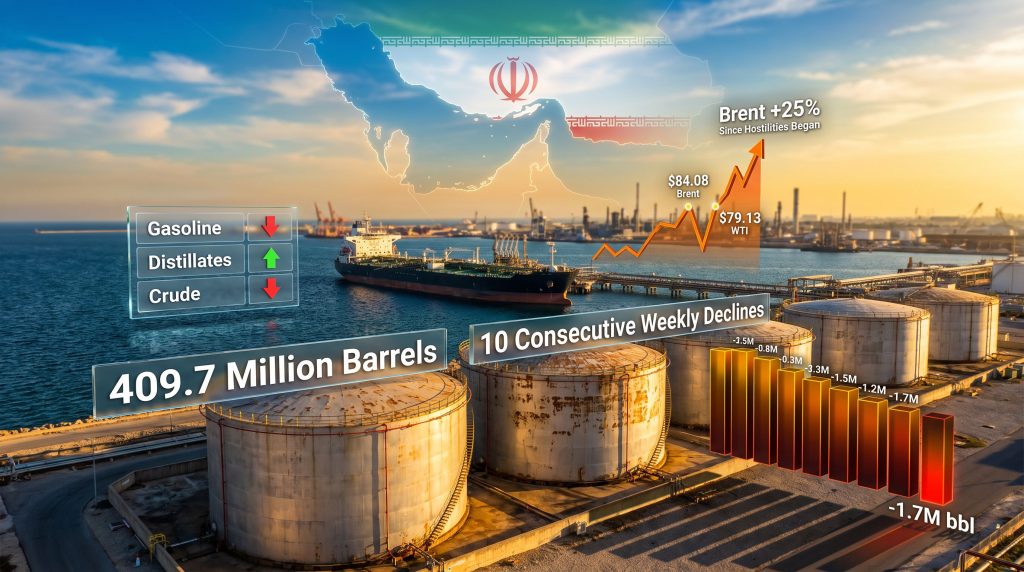
The U.S. Energy Information Administration's latest weekly petroleum status report confirmed that commercial crude stockpiles fell by 1.7 million barrels, bringing total inventories to 409.7 million barrels. That figure sits 6% below the five-year seasonal average, a deficit that signals the physical buffer available to absorb supply shocks has eroded meaningfully. Crucially, this marks the tenth consecutive week of commercial crude inventory declines, a streak that transforms what might otherwise appear to be routine volatility into a structural trend demanding serious attention.
When big ASX news breaks, our subscribers know first
Decoding the EIA Report: More Than a Headline Number
The American Petroleum Institute had released its preliminary estimate the day before, flagging a draw of approximately 564,000 barrels. The EIA's confirmed figure came in at three times that magnitude, a divergence that itself tells a story. API and EIA data diverge regularly, but when the official figure significantly exceeds the pre-release estimate on the downside of inventories, it tends to reinforce rather than soften the underlying supply tightness signal.
The broader product-level breakdown provides additional texture:
| Product Category | Weekly Change | 4-Week Avg Demand | Year-on-Year Change | vs. 5-Year Average |
|---|---|---|---|---|
| Crude Oil | -1.7 million bbl | — | — | -6% |
| Motor Gasoline | -1.5 million bbl | 8.9 million bpd | — | Tightening |
| Distillates | +4.6 million bbl | 3.7 million bpd | -2.1% | -11% |
| Total Products Supplied | — | 20.3 million bpd | +0.3% | Above prior year |
Total products supplied, the EIA's primary proxy for U.S. oil consumption, averaged 20.3 million barrels per day across the most recent four-week window, running 0.3% above the equivalent period from the prior year. This modest but positive year-on-year demand growth, combined with supply-side pressure from geopolitical events, creates exactly the kind of market imbalance that sustains multi-week inventory drawdown sequences. For broader context on crude oil volatility trends, it is worth noting that these structural imbalances have been building for some time.
The Strategic Petroleum Reserve Problem Nobody Is Talking About
Commercial inventories are only part of the story. When analysts incorporate the Strategic Petroleum Reserve into the total U.S. petroleum stockpile calculation, the picture becomes considerably more alarming. Combined inventories have reached their lowest recorded level in more than 40 years, last seen in March 1985.
The SPR was designed precisely for moments like this: when geopolitical disruption threatens to overwhelm commercial supply capacity. But after years of drawdowns, including the coordinated releases executed during the 2022 energy shock cycle, the reserve's buffer capacity is structurally diminished at the exact moment when its depth matters most.
This creates a policy dilemma. The political calculus around another SPR release is more constrained than at any point in recent memory, not because the trigger threshold is lower, but because the inventory base from which any release would be drawn is already depleted. A coordinated International Energy Agency release, similar to the mechanism deployed in 2022, remains a credible policy option if Brent crude sustains above the $90 per barrel threshold, but it would further erode a reserve that has not been meaningfully rebuilt.
Refinery Behaviour as a Forward Indicator
The divergence between gasoline and distillate inventory movements this week carries forward-looking information that is easy to miss in headline-level analysis. Average daily gasoline production moderated to 9.6 million barrels, while distillate output climbed to 5.3 million barrels per day. This is not a coincidence. Refiners actively shift their product slate in response to price signals and anticipated demand, and the current configuration suggests they are prioritising middle distillate output.
The practical interpretation is significant:
-
Diesel and jet fuel margins are widening relative to gasoline, incentivising refiners to maximise middle distillate yield from each barrel processed
-
This throughput pattern consumes crude inputs at an accelerating rate, contributing mechanically to commercial crude drawdowns even when export volumes remain steady
-
Distillate stocks, despite the 4.6 million barrel weekly build, remain 11% below the five-year seasonal average, meaning the category is still structurally short relative to historical norms
-
Gasoline inventories fell by 1.5 million barrels following a prior week decline of 1.9 million barrels, with four-week average demand holding at 8.9 million barrels per day through peak summer driving season
The sustained consumer demand for gasoline during this period, despite elevated pump prices, reflects the price inelasticity of fuel consumption during summer travel months. Analysts have warned that U.S. retail gasoline prices could breach the $4.00 per gallon threshold within days if current inventory trends and geopolitical dynamics persist, which would represent the first time that level has been reached since the 2022 energy shock.
The Strait of Hormuz and the Architecture of a Supply Crisis
The escalation of U.S.-Iran hostilities has introduced a supply disruption mechanism that operates through a chokepoint with no readily available substitute. The Strait of Hormuz carries an estimated 20% of globally traded crude oil on any given day. Furthermore, tanker traffic through the strait has fallen to five-week lows, vessels have been going dark to avoid targeting, and maritime insurers have sharply repriced risk premiums to reflect the elevated probability of vessel damage or seizure.
According to analysis from Columbia University's energy policy experts, U.S. and Israeli strikes on Iran carry significant implications for global energy markets that extend well beyond short-term price movements. The downstream consequences of this single-point disruption are cascading across global supply chains in ways that are only partially visible in weekly EIA data:
-
Saudi Arabia and Iraq have suspended shipments totalling an estimated 140 million barrels, creating a supply deficit that is materialising in U.S. commercial inventory trends as Asian buyers redirect purchases toward American crude
-
Japan, South Korea, and India have actively pivoted procurement away from Middle Eastern suppliers, with U.S. export volumes absorbing demand that would ordinarily flow through Persian Gulf routes
-
Brent crude futures have flipped into backwardation, a structural market signal indicating that traders and physical buyers perceive near-term supply as genuinely more scarce than future supply, rather than the contango structure typical of oversupplied markets
-
European natural gas prices have spiked in sympathy as LNG tanker rerouting compounds regional energy insecurity, demonstrating that Hormuz disruption transmits across commodity classes, not just crude
Backwardation in the Brent forward curve is particularly meaningful for market analysts. Unlike spot price spikes, which can reflect short-term sentiment, a sustained backwardated term structure indicates that professional traders with access to physical barrels are pricing real scarcity into their hedging books, not just speculating on geopolitical headlines.
The IEA has warned that renewed U.S.-Iran conflict has the potential to completely overturn prior oil surplus forecasts for 2026, transforming an anticipated supply glut into a structural deficit within weeks. That warning, which would have seemed speculative as recently as April 2026, now reads as a base case rather than a tail risk scenario. The geopolitical oil supply risks at play here are, in fact, reshaping the entire demand outlook for the year.
Oil Price Behaviour: Reading the Intraday Paradox
One of the more counterintuitive features of the current market environment is that both Brent and WTI futures softened during Wednesday morning trading despite intensifying geopolitical rhetoric. At 10:45 a.m. New York time, Brent was trading at $84.08 per barrel, down $0.65 (-0.77%) on the session, while WTI stood at $79.13 per barrel, down $0.21 (-0.26%).
This intraday softness reflects several layers of modern oil price discovery that experienced traders understand but that can mislead casual observers:
-
Profit-taking after a sustained rally: The cumulative price appreciation since the onset of U.S.-Iran hostilities exceeded 25%, including a single-session surge of 8% immediately following the reimposition of a U.S. blockade on Iranian exports and a subsequent four-day rally. Profit-taking at these levels is mechanically normal
-
China's demand collapse as a counterweight: Chinese refinery runs have fallen to pandemic-era lows, and crude imports have crashed to a decade-low level. Demand destruction from the world's largest crude importer introduces a deflationary counterforce that partially offsets the geopolitical supply premium
-
Geopolitical risk premium already embedded in forward pricing: Despite the intraday decline, Brent remained approximately $7 per barrel higher than it had been at the same point the prior week. The market is not abandoning the risk premium; it is consolidating around it
| Scenario | Disruption Duration | Estimated Brent Range | U.S. Inventory Implication |
|---|---|---|---|
| Base Case | 2-4 weeks | $82-$87/bbl | Drawdowns continue at 1-2M bbl/week |
| Moderate Escalation | 4-8 weeks | $90-$95/bbl | SPR release becomes policy consideration |
| Severe Disruption | 8+ weeks | Above $100/bbl | Emergency IEA coordinated release likely |
| Resolution/Ceasefire | Imminent | $75-$78/bbl | Inventory rebuild begins within 3-4 weeks |
The next major ASX story will hit our subscribers first
Russia, China, and the Competing Forces Shaping the Global Supply Picture
Two significant supply-side dynamics are operating simultaneously and pulling in different directions. On one hand, Russia has attempted to capitalise on elevated prices by surging export volumes, but an estimated 135 million barrels of Russian crude exports are currently caught in a logistical traffic jam. Sanctions enforcement, tanker availability constraints driven by the shadow fleet's operational limitations, and rerouting requirements converge to limit Moscow's ability to bring supply to market at scale.
Ukraine's ongoing attacks on Russian tankers in the Black Sea have further compressed that export capacity. On the other hand, China's simultaneous demand collapse represents the most significant deflationary counterweight in the current environment. Chinese crude imports have fallen to decade-low levels as both Hormuz transit risks and domestic economic pressures suppress refinery throughput.
How Does OPEC's Position Complicate the Outlook?
OPEC faces its own balancing challenge. The cartel has revised its demand forecast downward while attempting to support member revenue through higher prices. Understanding OPEC's market influence is essential here, as the organisation's strategic decisions carry outsized consequences for global supply balances. If Hormuz disruption persists, OPEC's ability to meaningfully supplement global supply is constrained, both by the transit risk affecting its own exports and by the political complexity of being seen to benefit commercially from a regional conflict.
Furthermore, OPEC demand forecast revisions issued earlier this year already signalled a more cautious consumption outlook, meaning the cartel entered this crisis period with less room to manoeuvre than in previous episodes of geopolitical disruption. For China's trajectory in the coming weeks, that may ultimately matter as much as the diplomatic situation in the Persian Gulf.
Key Risk Variables and What Market Participants Are Watching
The three variables that will most directly determine oil's directional move over the coming weeks are:
-
Iran ceasefire probability: Any credible diplomatic signal toward de-escalation would trigger a rapid unwind of the embedded geopolitical risk premium, potentially pulling Brent back toward the $75-$78 range within days. The speed and scale of that reversal would depend heavily on whether Hormuz tanker traffic normalises quickly or remains disrupted by residual insurance and operational hesitancy
-
SPR release decision: With combined inventories at 40-year lows, the threshold for a politically motivated emergency release is lower than at any previous point this decade. The question is whether the administration is willing to further deplete a reserve that has not been rebuilt since the 2022 drawdown
-
OPEC+ supply response: The cartel's next scheduled meeting and any interim emergency discussions will be closely watched. Historically, OPEC has used supply increases strategically to cap prices before they trigger demand destruction or accelerate energy transition investment. That dynamic is fully in play at current price levels
According to OilPrice.com's coverage of the inventory data, the combination of falling U.S. crude stockpiles and escalating Iran tensions has created a particularly volatile market environment that warrants close monitoring. The trade war impact on oil markets adds yet another layer of complexity to an already strained global supply picture.
Disclaimer: This article is intended for informational purposes only and does not constitute financial, investment, or trading advice. Oil market forecasts and price scenario projections involve significant uncertainty and should not be relied upon as the basis for investment decisions. Past price behaviour is not indicative of future results.
What the Streak of Ten Consecutive Drawdowns Signals for Q3 2026
The significance of a tenth consecutive weekly inventory decline cannot be overstated in the context of seasonal norms. Summer demand typically draws down crude and refined product inventories, but a streak of this duration and magnitude exceeds the ordinary seasonal pattern. When combined with the SPR's structural depletion, the Hormuz disruption, and the accelerating pivot of Asian buyers toward U.S. crude, the directional pressure on domestic stockpiles points toward continued tightening through the third quarter.
The distillate deficit of 11% below the five-year seasonal average is particularly instructive as a forward indicator. Diesel and jet fuel underpin freight, logistics, and aviation demand in ways that directly affect inflation and economic activity. Consequently, if distillate stocks do not rebuild meaningfully before the transition to winter heating demand, the downstream price implications could extend well beyond the energy sector into broader consumer costs heading into Q4 2026.
For market participants, the data from the week ending July 10 is best understood not as an isolated EIA report but as the latest confirmation of a supply-demand rebalancing that began gradually and has now accelerated sharply. US crude inventories fall 1.7 million barrels as Iran tensions rattle markets, and this figure represents the clearest empirical evidence that the oversupply narrative dominating early 2026 has not merely softened — it has been replaced entirely by a structural deficit framework.
Want to Stay Ahead of the Resource Discoveries Driving the Next Market Shift?
While geopolitical tensions reshape global energy supply chains and commodity markets tighten, Discovery Alert's proprietary Discovery IQ model delivers real-time notifications on significant ASX mineral discoveries — instantly translating complex resource data into actionable investment insights for both short-term traders and long-term investors. Explore how major discoveries have historically generated exceptional returns and begin your 14-day free trial at Discovery Alert to position yourself ahead of the market.