August 12, 2026
The Geology of Scarcity: Why the Copper Concentrate Market Is Structurally Broken
Commodity markets are frequently misread when analysts focus on the wrong layer of the supply chain. For copper in 2026, that misreading is happening at scale. The headline narrative, built around a projected 96,000-tonne refined copper surplus, has dominated institutional commentary since the International Copper Study Group's April 2026 forecast revision. Yet the physical market is transmitting signals that flatly contradict the notion of abundant supply. Understanding copper concentrate supply tightness requires moving one step upstream, away from refined metal balances and into the world of copper concentrate, where the real supply crisis is unfolding.
When big ASX news breaks, our subscribers know first
The Disconnect Between Refined Forecasts and Physical Market Reality
On April 23, 2026, the ICSG revised its copper market outlook dramatically. Where it had previously forecast a 150,000-tonne deficit for 2026, it pivoted to a 96,000-tonne surplus, followed by a projected 377,000-tonne surplus in 2027. On paper, this looked like a market moving toward comfort. In physical trading, however, the evidence pointed in the opposite direction.
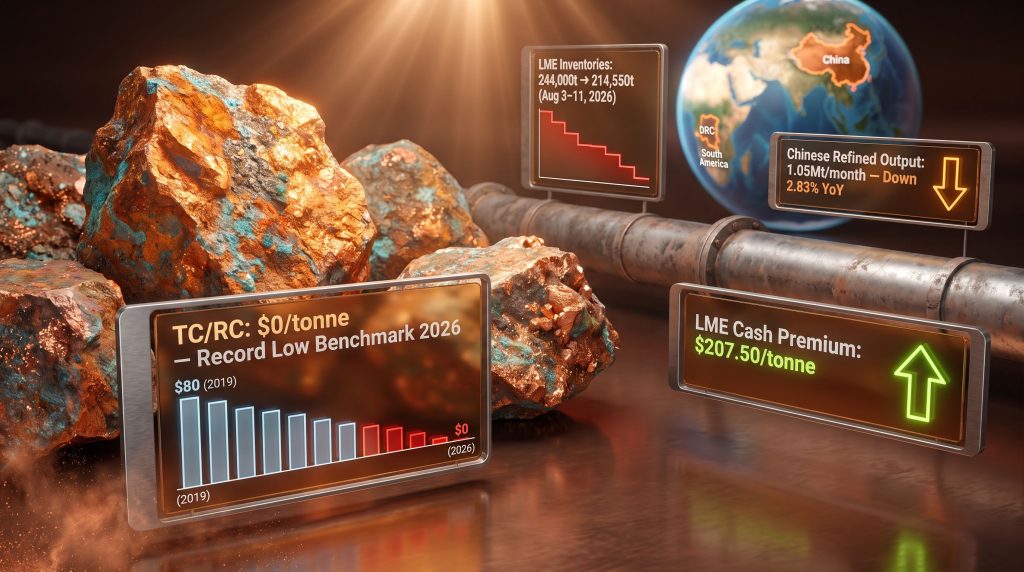
LME cash copper settled at $14,424.50 per tonne on August 11, 2026, while the cash-to-three-month spread — the premium buyers must pay to secure immediate delivery over three-month forward contracts — surged from $69 per tonne at the start of August to $207.50 per tonne by August 11. That acceleration over eight trading days is not a noise event. It is a stress signal from the physical market that immediate copper availability is being competed for aggressively.
Simultaneously, LME exchange inventories fell from over 244,000 tonnes on August 3 to 214,550 tonnes on August 11, a drawdown of approximately 29,450 tonnes in eight days. When a cash premium surges and inventories fall together, the combination tells a consistent story: the market is short of metal that can be delivered today.
The cash-to-three-month spread is not a long-term price forecast. It measures near-term physical scarcity in real time. A premium above $100 per tonne is generally interpreted as a strong tightness signal. At $207.50 per tonne, the copper market was transmitting one of its most acute scarcity readings in recent history.
The important distinction here is that refined surplus forecasts and concentrate availability operate on entirely separate timescales and through different segments of the supply chain. A refined surplus can develop if smelters have been running hard and stockpiling cathode, even while the raw concentrate feeding those same smelters becomes critically scarce. Both conditions can coexist during a supply chain transition, and that is precisely what 2026 is demonstrating.
What Is Driving Copper Concentrate Supply Tightness in 2026?
The TC/RC Collapse: The Market's Most Precise Feedstock Signal
Treatment and refining charges are the fees that copper miners pay smelters to process concentrate into refined metal. When concentrate is abundant, smelters can demand high fees, and TC/RCs rise. When concentrate is scarce, the negotiating power shifts to miners, fees fall, and in extreme cases, smelters must pay above market rates just to secure feedstock. The 2026 annual benchmark TC/RC reached $0 per tonne, a record low, following a period in which spot TC/RCs had already turned negative in 2024.
| Year | Annual Benchmark TC/RC (USD/tonne) | Market Condition |
|---|---|---|
| 2019 | ~$80 | Balanced |
| 2021 | ~$59 | Moderately tight |
| 2023 | ~$80 | Temporary ease |
| 2024 | Spot rates turned negative | Severe tightness |
| 2026 | $0 (record low benchmark) | Structural constraint |
A benchmark of zero means custom smelters — those that purchase concentrate on the open market rather than sourcing it from affiliated mines — are processing at no margin. On spot terms, some were operating at a loss. This is not a cyclical wobble. It is a structural signal that mine output has fundamentally failed to keep pace with global smelting capacity. The IEA has noted that these mounting strategic pressures on smelters reflect a deeper structural imbalance between processing capacity and available feedstock.
The distinction between integrated and custom smelters matters enormously here. Integrated operations, where a single company controls both mining and smelting, can absorb TC/RC volatility internally because concentrate moves between divisions at a transfer price. Custom smelters have no such buffer. For them, a zero or negative TC/RC environment is an immediate and severe margin compression event.
Mine-Level Disruptions and Concentrated Production Risk
Global copper concentrate output is highly concentrated among a small number of very large operations. This structural characteristic means that operational disruptions at flagship assets have outsized market effects. Disruptions at major producing operations, including at assets such as Grasberg in Indonesia — one of the largest copper mines in the world by volume — remove significant concentrate volumes from the global pipeline in ways that smaller, more distributed production bases never could.
This concentration risk is a feature of the copper mining landscape that is frequently underappreciated by analysts working from aggregated supply forecasts. When a single mine contributes several hundred thousand tonnes of annual output and faces operational challenges, the ripple effect through concentrate availability can be felt for quarters.
Chinese Smelter Expansion: The Structural Engine of Tightness
China's role in the copper concentrate market cannot be overstated. As the world's largest importer of copper concentrate, China has been on a sustained smelter capacity buildout, adding processing capacity at a rate that has systematically outpaced global mine supply growth. The result is a widening structural gap between the volume of concentrate the world's mines can produce and the volume that Chinese smelters alone are capable of consuming.
According to data from Antaike, refined copper output among Chinese producers representing 81.97% of capacity fell to 1.05 million tonnes in August 2026, down 2.83% year on year. This followed a 3.18% decline in July 2026, making it two consecutive months of contraction. Back-to-back output declines of this magnitude are a direct fingerprint of feedstock scarcity, not demand weakness.
The ICSG itself projected refined production growth of only 0.4% for 2026, a figure explicitly constrained by concentrate availability rather than by smelter capacity. That framing is significant: the forecast surplus is built on an assumption of constrained output, which means copper concentrate supply tightness is already baked into the bullish supply side of the refined balance sheet.
The DRC Export Ban: Market Noise or Genuine Risk?
The Democratic Republic of Congo's role as a major copper concentrate exporter ensures that any policy action from Kinshasa immediately captures market attention. An export restriction from the DRC drew significant commentary in mid-2026. However, Goldman Sachs assessed that the ban carried no material impact on global copper balances. The market quickly refocused from the DRC event toward the underlying structural question of concentrate availability more broadly.
This episode illustrates an important dynamic in commodity markets: geopolitical supply risks in major producing jurisdictions can amplify existing tightness in sentiment even when their direct physical impact is limited. The DRC ban may not have materially moved concentrate volumes, but it served as a catalyst for reassessing the fragility of global concentrate supply chains. Furthermore, understanding the copper supply crunch in its broader context helps explain why even perceived threats carry significant market weight.
The Geological Reality Behind Long-Term Copper Concentrate Supply Tightness
A 17-Year Pipeline Problem
One of the most consequential and least discussed constraints on copper supply is the time it takes to develop a new mine. From discovery to first production, the average timeline for a copper project is approximately 17 years. This means that elevated copper prices today, regardless of how high they go, cannot stimulate meaningful new mine supply within the current decade. The pipeline is fixed by decisions — or non-decisions — made nearly two decades earlier.
This structural reality fundamentally undermines the notion that price signals alone will resolve copper concentrate supply tightness within a short timeframe. In addition, the copper exploration pipeline has been critically underfunded for years, further compressing the medium-term supply outlook.
Ore Grade Decline and Rising Capital Intensity
The quality of what miners are working with has deteriorated significantly over time. Average global copper ore grades have fallen approximately 40% since 1991, meaning that miners must move, crush, and process far more rock to extract the same volume of copper as their predecessors did. At the same time, brownfield capital intensity has risen approximately 65% since 2020, reflecting higher energy costs, deeper ore bodies, more complex metallurgy, and more stringent environmental requirements.
The combined effect is a unit economics squeeze: each tonne of copper produced requires more capital, more processing, and more energy than it did even five years ago.
The Discovery Drought: A Generational Problem
Perhaps the most sobering geological data point is this: of all copper deposits discovered over the past 35 years, only approximately 5% were found in the most recent decade. This near-collapse in discovery rates means that the long-term pipeline of projects capable of replacing aging, depleting mines is critically thin.
The combination of a 17-year development timeline, a 40% decline in average ore grades since 1991, and a discovery rate that has fallen to approximately 5% of historical norms over the past decade creates a supply constraint that market price signals alone are unlikely to resolve within this decade.
This is not a cyclical phenomenon. It is a multi-decade geological reality that industry analysts and institutional investors are only beginning to fully price into long-term copper frameworks.
Who Wins and Who Loses in a Tight Concentrate Market
The Competitive Landscape Reshaped by Feedstock Control
Copper concentrate supply tightness does not affect all market participants equally. The winners and losers are determined largely by their position in the supply chain and their ability to control feedstock.
- Integrated producers (mining and smelting under one roof): insulated from external TC/RC pressure; high copper prices translate directly into expanded margins without feedstock cost exposure.
- Custom smelters: immediately exposed to negative spot TC/RCs; margin compression is severe and ongoing as long as concentrate scarcity persists.
- Fabricators and cable manufacturers: absorb the $207.50 per tonne spot premium as a direct input cost increase, compressing their own margins or passing costs downstream.
- Development-stage miners with high-grade, high-throughput assets: benefit from elevated copper prices if they can demonstrate credible near-term production potential, as the market assigns forward value to future concentrate supply.
Aluminium Substitution: A Real but Bounded Risk
Copper's 47.33% price appreciation over the year to August 11, 2026, has widened the cost gap between copper and aluminium in price-sensitive applications. Aluminium traded near $3,373 per tonne in August 2026 without a comparable spot premium, making substitution economics increasingly attractive in specific applications.
Where substitution is technically feasible — primarily in certain power cable configurations — sustained copper prices above $6.60 per pound have historically accelerated substitution trials among industrial buyers. However, copper remains irreplaceable in high-performance electrical, electronics, and motor applications where its superior conductivity, malleability, and thermal properties cannot be matched by aluminium at equivalent performance levels. Consequently, the copper price drivers underpinning this premium are expected to remain structurally intact.
The Four Filters That Define Producer Advantage at Record Prices
For mining companies operating or developing copper assets, four variables determine how effectively elevated prices translate into actual margin:
- Ore grade: higher grades reduce processing costs per unit of copper and amplify the value of each tonne mined.
- Throughput capacity: volume leverage means that margin improvement compounds with scale at elevated prices.
- All-in sustaining costs (AISC): the gap between AISC and spot price determines actual margin capture; cost discipline matters more, not less, at record prices.
- Concentrate security: miners with captive smelting arrangements or long-term processing contracts avoid the TC/RC volatility that is currently destroying margins for spot-market participants.
Furthermore, majors-junior copper partnerships have emerged as a strategic response to feedstock insecurity, with larger producers seeking to lock in future concentrate supply through equity stakes and offtake arrangements with junior developers.
Key Metrics to Monitor for Copper Concentrate Market Conditions
| Indicator | Level (August 2026) | Tightness Signal | Easing Signal |
|---|---|---|---|
| LME Cash-to-3M Premium | $207.50/tonne | Above $100/tonne | Below $69/tonne |
| LME Exchange Inventories | 214,550 tonnes | Below 244,000 tonnes | Above 244,000 tonnes |
| Chinese Refined Output | 1.05 Mt/month | Below 1.07 Mt/month | Above 1.07 Mt/month |
| Annual TC/RC Benchmark | $0/tonne | At or below $0 | Recovery above $30-$40/tonne |
| Copper Price (YoY Change) | +47.33% to Aug 11, 2026 | Sustained above $6.60/lb | Reversal below $6.00/lb |
The next major ASX story will hit our subscribers first
Base Case and Bear Case: Scenarios for the Remainder of 2026
| Scenario | Key Conditions | Copper Price Range | Cash Premium Level |
|---|---|---|---|
| Base Case | Concentrate tightness persists into Q4 2026; Chinese output stays near 1.05 Mt/month | ~$6.61-$6.83/lb | Above $100/tonne |
| Bear Case | Chinese smelter cuts exceed 10%; exchange stocks rise above 244,000 t; 2027 surplus of 377,000 t develops | Downward pressure | Returns to ~$69/tonne |
The bear case hinges on a scenario in which Chinese smelters cut utilisation rates sharply enough to reduce their own competition for feedstock, allowing concentrate availability to normalise. The IEA, however, has noted broad institutional consensus that low TC/RCs are likely to persist over the medium term, suggesting the structural mismatch between smelting capacity and mine output is not easily unwound.
It is worth noting that industry deficit estimates for 2026 range from approximately 150,000 to 751,000 tonnes, depending on methodology and how inventory drawdowns are treated. Even the most conservative analytical frameworks do not point to a well-supplied concentrate market. This dispersion itself is a signal: the debate is not resolved, and the uncertainty premium embedded in current prices reflects that reality.
Frequently Asked Questions: Copper Concentrate Supply Tightness
What does copper concentrate supply tightness mean in practice?
Copper concentrate is the partially processed ore that miners ship to smelters for conversion into refined metal. Concentrate supply tightness occurs when the volume of concentrate available is insufficient to meet smelter processing demand. The direct market signal is a collapse in TC/RCs — the fees smelters charge miners for processing. When those fees fall to zero or turn negative, smelters are no longer being compensated for processing, signalling that miners hold all the negotiating leverage in a feedstock-scarce environment.
Why did TC/RCs fall to zero in 2026?
The 2026 annual benchmark TC/RC reached $0 per tonne following a period in which spot rates had already turned negative in 2024. The primary drivers include a structural capacity mismatch created by China's aggressive smelter buildout, operational disruptions at major producing mines, declining global ore grades requiring more ore movement per tonne of copper produced, and a thin greenfield discovery pipeline that limits medium-term supply growth.
How can a refined copper surplus and a concentrate deficit coexist?
Refined copper balances measure total production against total consumption of finished metal. A concentrate deficit measures the gap between raw mine output and smelter processing demand. These operate on different timescales. If smelters cannot access sufficient concentrate, their refined output falls, which can eventually erode a projected refined surplus. The two metrics can coexist during the transition period before feedstock scarcity fully flows through to reduced refined production — which is precisely the configuration the copper market exhibited through mid-2026.
What signals would confirm that tightness is easing?
Analysts should watch for the following reversal indicators:
- The LME cash-to-three-month premium falling below $100 per tonne for five or more consecutive trading days.
- Chinese refined copper output recovering above 1.07 million tonnes per month.
- LME exchange inventories rebuilding above 244,000 tonnes.
- The ICSG confirming its 96,000-tonne 2026 surplus projection in its next forecast update without material revision.
Disclaimer: This article is for informational purposes only and does not constitute financial or investment advice. All forecasts, price projections, and market scenarios involve inherent uncertainty and should not be relied upon as predictions of future outcomes. Investors should conduct their own due diligence and consult qualified financial advisers before making investment decisions. Statistics and data cited reflect conditions as of August 2026 and are subject to revision.
Want to Know When the Next Major Copper Discovery Hits the ASX?
Discovery Alert's proprietary Discovery IQ model delivers real-time alerts on significant ASX mineral discoveries, cutting through complex geological and market data to surface actionable opportunities the moment they are announced — exactly the kind of edge that matters in a structurally tight copper concentrate market. Explore historic discoveries and their returns to understand the magnitude of what major finds can deliver, then begin your 14-day free trial at Discovery Alert to position yourself ahead of the broader market.