
June 25, 2026
When Benchmark Design Becomes a Market-Moving Decision
Commodity price benchmarks are rarely front-page news. They operate quietly in the background of global trade, shaping the economics of billions of dollars in offtake agreements, smelting contracts, and structured financial products. Yet the methodological choices embedded in those benchmarks carry enormous commercial weight. When a price reporting agency recalibrates how an index is constructed, the ripple effects travel across every contract referencing that number.
The proposed Asia-Pacific copper concentrates TC/RC index weighting changes currently under consultation represent exactly this kind of inflection point. Far from a routine administrative update, the two-pronged proposal touching dynamic volume weighting and precious metal normalisation has the potential to redefine how treatment and refining charges are benchmarked across one of the world's most strategically important commodity corridors.
When big ASX news breaks, our subscribers know first
Understanding TC/RC Fundamentals Before Unpacking the Reform
What Treatment and Refining Charges Actually Represent
In the copper supply chain, concentrate is the intermediate product that sits between a mine and a refined metal refinery or smelter. Miners ship copper concentrates, typically grading between 20% and 30% copper, to smelters who process them into blister or anode copper. The cost of that processing is captured in two related charges:
- Treatment charges (TC): A fee paid by the miner to the smelter, expressed in US dollars per dry metric tonne of concentrate, covering the cost of smelting.
- Refining charges (RC): A secondary fee expressed in US cents per pound of copper, covering electrolytic refining into cathode-grade metal.
Together, TC/RCs represent the commercial fulcrum of the miner-smelter relationship. When concentrate supply is abundant, smelters hold negotiating leverage and TC/RCs rise. When supply tightens — contributing to the copper supply crunch observed in recent years — miners gain the upper hand and TC/RCs fall, often turning negative in extreme cases where smelters are effectively paying a premium to secure feed material.
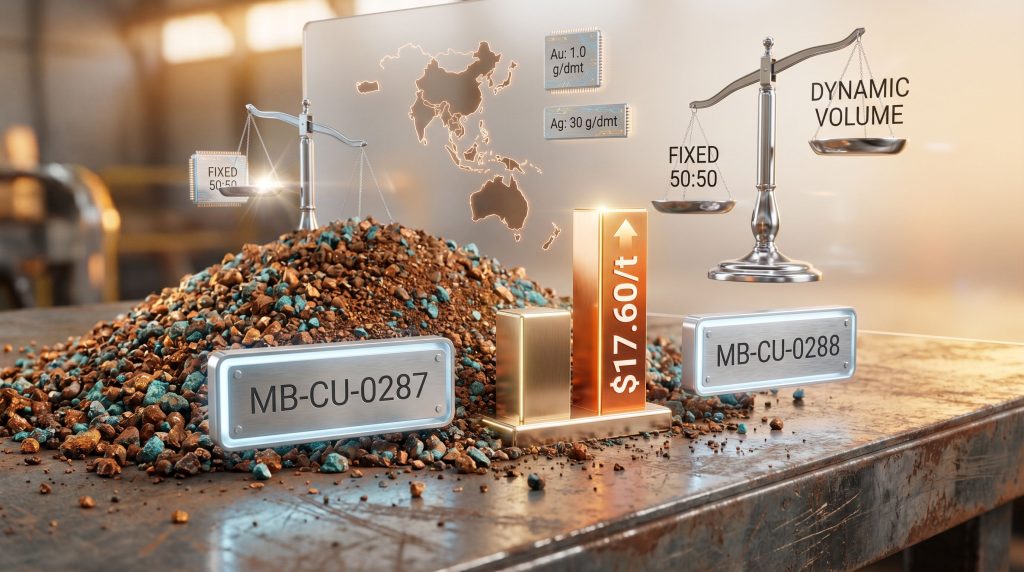
The Asia-Pacific cif benchmark covers concentrates traded on a cost-insurance-freight basis into the region, encompassing major smelting hubs across China, Japan, South Korea, and India. Two index codes track this market:
- MB-CU-0287 covering TC values in $/tonne
- MB-CU-0288 covering RC values in US cents/lb
Why Late 2023 Changed Everything
The copper concentrates market entered a period of sustained and, by historical standards, unprecedented tightness beginning in late 2023. Several forces converged simultaneously: mine supply disruptions, particularly at large operations in Latin America; accelerating smelter capacity additions in China outpacing available concentrate supply; and a dramatic rally in gold and silver prices that altered the relative economics of different concentrate grades.
This environment exposed a structural weakness in the existing index construction. A fixed 50:50 weighting between trader-reported and smelter-reported transactions was designed for a more balanced market, where both counterparty types contributed roughly equal volumes to the spot market. As conditions shifted materially, the equal-weight assumption became increasingly disconnected from observable market reality.
The Structural Case for Replacing Fixed Counterparty Weighting
How Liquidity Asymmetry Distorts a Fixed-Weight Index
Price benchmarks derive their credibility from their ability to reflect actual market conditions. When physical trading activity concentrates predominantly on one side of a bilateral market, an index that treats both sides equally is no longer measuring what it claims to measure.
Consider the mechanics: if traders are accounting for, say, 70% of reported spot transaction volume in a given period while smelters account for the remaining 30%, a 50:50 weighted index is implicitly over-representing smelter pricing and under-representing trader pricing. Since trader-reported and smelter-reported TC/RC levels can diverge materially, this mismatch introduces a systematic bias into the headline benchmark.
Furthermore, as Fastmarkets has outlined in its consultation documentation, the index ceases to function as a neutral price signal and instead becomes an artefact of its own construction assumptions, insulated from the market it is designed to represent.
This is precisely the structural problem that the Asia-Pacific copper concentrates TC/RC index weighting changes are designed to address. The proposal introduces dynamic volume weighting, updated weekly on a rolling six-month basis, so that the relative influence of each counterparty type in the final index reflects their actual share of reported transaction volumes, not a predetermined assumption.
What Dynamic Weighting Looks Like in Practice
| Methodology Dimension | Current Framework | Proposed Framework |
|---|---|---|
| Counterparty Weighting | Fixed 50:50 split | Dynamic, volume-driven weighting |
| Adjustment Frequency | Static | Weekly, rolling 6-month basis |
| Data Inputs | Equal weight regardless of volume | Reported transaction volumes only |
| Benchmark Sensitivity | Insensitive to market share shifts | Reflects prevailing spot conditions |
| Affected Indices | MB-CU-0287, MB-CU-0288 | MB-CU-0287, MB-CU-0288 |
It is important to note that the individual sub-indices, MB-CU-0508 (implied smelter TC) and MB-CU-0509 (implied trader TC), are not affected by the weighting change itself. Those assessments continue to reflect their respective counterparty segments independently. Only the blended headline index changes.
The six-month rolling window is a deliberate design choice. A shorter window would make the index more responsive to sudden shifts in trading activity but also more vulnerable to temporary distortions caused by thin data periods. A longer window would improve data liquidity but delay the index's ability to reflect genuine structural market transitions. Six months represents the proposed equilibrium between these competing considerations.
Gold and Silver Normalisation: The Second Pillar of Reform
Why Precious Metal Content Creates Pricing Noise
Copper concentrates are rarely pure. Beyond copper, concentrates frequently carry economically significant quantities of gold and silver, whose value is partially credited back to the miner under payable agreements. The precise credit depends on the grade of precious metals present, the applicable payable threshold, and the prevailing spot price of gold or silver at the time of the transaction.
When TC/RC values are reported without standardising for precious metal content, the resulting data is not directly comparable across transactions. A concentrate carrying 3.0 grams of gold per dry metric tonne generates a meaningfully different set of economics from one carrying 0.5 g/dmt, even at identical TC/RC levels. Without normalisation, the headline index blends these incomparable transactions and produces a distorted price signal. The commodity pricing impact of this distortion can reverberate significantly across broader mining company performance metrics.
The proposed normalisation addresses this by adjusting all reported TC/RC values to a common base specification before they enter the index calculation. The normalisation process accounts for:
- Reported gold and silver content per transaction
- The applicable deduction or payable threshold in each contract
- The payable percentage agreed between the miner and smelter
- The prevailing precious metal spot price on the transaction date
- Standard unit conversions used across the Asia-Pacific market
Revised Base Specifications: What Is Changing and Why
The normalisation proposal also involves revising the base specifications themselves to better align with the structural reality of concentrate grades currently entering the Asia-Pacific market.
| Precious Metal | Current Base Specification | Proposed Base Specification | Maximum Specification |
|---|---|---|---|
| Gold (Au) | 1.1 g per dry metric tonne | 1.0 g per dmt | 30 g per dmt (unchanged) |
| Silver (Ag) | 75 g per dmt | 30 g per dmt | 350 g per dmt (unchanged) |
The reduction in both base thresholds is particularly telling for silver. Dropping the silver base from 75 g/dmt to 30 g/dmt reflects the reality that many concentrates entering the Asia-Pacific market today carry silver grades substantially below the old threshold, meaning the prior base specification was systematically misaligned with actual market material.
The surge in gold and silver trends since 2023 — with spot gold trading well above historical averages — amplified this problem considerably. High precious metal prices magnify the economic impact of any misalignment between the reported precious metal grade and the index's base specification. In a gold price environment exceeding $3,000 per troy ounce, even a small discrepancy in gold grade normalisation translates into a significant distortion in the implied TC/RC.
The following six index codes are affected by the normalisation proposal:
- MB-CU-0287 Copper concentrates TC index, cif Asia Pacific
- MB-CU-0288 Copper concentrates RC index, cif Asia Pacific
- MB-CU-0508 Copper concentrates TC implied smelters purchase, cif Asia Pacific
- MB-CU-0510 Copper concentrates RC implied smelters purchase, cif Asia Pacific
- MB-CU-0509 Copper concentrates TC implied traders purchase, cif Asia Pacific
- MB-CU-0511 Copper concentrates RC implied traders purchase, cif Asia Pacific
Modelled Pricing Impact: What the Historical Simulation Reveals
A $17.60/t Uplift and What It Signals
To provide market participants with concrete guidance on the potential commercial impact of the proposed dynamic weighting, a simulated price history was modelled covering the period from January 1 to June 19, 2026. The result was striking: under the proposed methodology, the copper concentrates TC index, cif Asia Pacific, would have averaged $17.60 per tonne higher (less negative) than the current fixed-weight methodology produced over that period.
It is essential to treat this figure carefully. The modelled analysis is explicitly not a price forecast, and it does not incorporate the effects of the gold and silver normalisation proposal. Supply and demand fundamentals, as well as reporting behaviour from market participants, may evolve in ways that alter future outcomes materially.
A $17.60/t average divergence over six months is not a rounding error. For smelters operating on razor-thin processing margins in a structurally tight concentrate market, this differential is commercially significant in every contract negotiation that references the cif Asia Pacific benchmark.
Who Stands to Be Affected, and How
The commercial implications vary considerably depending on where a participant sits in the supply chain:
Smelters: A higher (less negative) TC value effectively improves the optics of concentrate procurement costs when measured against the benchmark. In practical terms, it reduces the degree to which smelters appear to be paying above the historical norm for feed material.
Traders: Dynamic volume weighting means their relative contribution to the index fluctuates based on actual market share rather than a guaranteed 50% allocation. In periods when trader volumes dominate the spot market, their pricing signals carry more weight. In periods when smelters drive the majority of activity, the reverse applies.
Miners and producers: Any long-term offtake agreement with TC/RC terms linked directly or indirectly to the cif Asia Pacific benchmark may need to be reviewed. A sustained shift in the average index level of the magnitude modelled would have material implications for the economics of index-referenced contracts. Understanding the copper price drivers at play is consequently essential for producers reassessing their exposure.
Financial participants: Derivatives, structured products, or any financial instrument using MB-CU-0287 or MB-CU-0288 as a reference price face repricing risk if the methodology change is implemented as proposed.
Precedents From Other Commodity Markets
How Benchmark Evolution Has Played Out Elsewhere
The Asia-Pacific copper concentrates TC/RC index weighting changes reflect a broader global trend in commodity price benchmark design. Fixed-weight and fixed-specification methodologies have come under sustained pressure across multiple markets as trading patterns and product characteristics evolve beyond the assumptions embedded at index inception.
Iron ore benchmarks transitioned from annual benchmark negotiations to daily, transaction-based assessments over the course of the 2000s and early 2010s — a shift that was disruptive in the short term but widely regarded as improving price transparency over time. Lithium carbonate benchmarks have faced similar scrutiny as the market moved from a relationship-driven, opaque pricing environment toward more liquid spot trading.
The trade-off is consistent across markets: long-term contract users often prefer index stability, while spot market participants benefit from indexes that track actual liquidity. The proposal for rolling six-month dynamic weighting in copper concentrates represents an attempt to honour both objectives simultaneously. For context on how this plays out regionally, the Chile copper price outlook offers a useful lens on how benchmark shifts influence producer-level economics across key mining jurisdictions.
What Is Dynamic Volume Weighting?
In a commodity price index, dynamic volume weighting assigns each market participant category an influence proportional to their actual share of reported transaction volumes over a defined rolling period. Unlike a fixed ratio, this approach recalibrates regularly to ensure the index tracks the segment of the market that is most actively transacting, rather than reflecting a structural assumption that may no longer be valid.
The next major ASX story will hit our subscribers first
Consultation Timeline and Participation
Key Dates Market Participants Should Track
| Milestone | Date |
|---|---|
| Open consultation published | February 3, 2026 |
| Formal proposal published | April 8, 2026 |
| Feedback period extended | Post-April 8, 2026 |
| Current feedback deadline | July 31, 2026 |
| Proposed implementation date | September 4, 2026 |
Responses should be directed to [email protected] and [email protected] with the subject line Re: Copper Concentrates TC/RC Index. Participants wishing to keep their submissions confidential should indicate this clearly, as non-confidential responses may be made available upon request. All market participants — whether smelters, traders, miners, financial institutions, or downstream index users — are eligible to contribute.
The September 4, 2026 implementation date is proposed, not confirmed, and remains subject to the outcome of the consultation process. For those seeking a broader overview of the index mechanics, the AusIMM's guide to concentrate marketing provides a useful foundational reference.
Broader Market Implications and the Long-Term Structural Signal
Near-Term Risks for Market Participants
The period between the methodology announcement and the September implementation date carries its own commercial risks. Counterparties currently in TC/RC contract negotiations face uncertainty about which benchmark level their agreements will be referencing in the medium term. This uncertainty is not hypothetical: a $17.60/t average divergence over six months is large enough to shift the commercial calculus of multi-year smelting agreements.
Smelters across China, Japan, South Korea, and India will likely assess their exposure differently depending on how much of their concentrate procurement is referenced against the cif Asia Pacific index versus internal bilateral terms. Those with high spot market exposure are most directly affected.
What This Reform Signals for the Future of Concentrate Benchmarks
The direction of travel implicit in this proposal carries significance beyond the immediate methodology change. As trader market share in the Asia-Pacific spot concentrate market has grown, the fixed 50:50 weighting effectively underweighted a segment of the market that was increasingly driving price discovery. Dynamic volume weighting corrects this, but it also signals that the structural role of traders in concentrate markets has reached a level of significance that price reporting agencies can no longer treat as a fixed minority.
Simultaneously, the downward revision of silver's base specification from 75 g/dmt to 30 g/dmt quietly acknowledges something the market has observed for some time: the average silver grade of concentrates being traded into Asia-Pacific has declined, and a benchmark calibrated to a 75 g/dmt base was systematically mispricing a large portion of transactions.
Gold and silver price trajectories will continue to influence concentrate valuation well beyond this specific methodology revision. If precious metal prices remain elevated, the economic significance of precise normalisation will only increase, reinforcing the case for the reform being proposed.
Whether dynamic volume weighting becomes the global standard for concentrate benchmarks, or remains an Asia-Pacific-specific adaptation, will depend significantly on whether the market perceives the September 2026 implementation as improving benchmark credibility. The consultation process itself — spanning more than six months from initial open consultation to proposed implementation — represents the kind of rigorous stakeholder engagement that benchmark governance increasingly demands.
Disclaimer: This article is intended for informational purposes only and does not constitute financial or investment advice. The modelled price impact of $17.60 per tonne referenced herein is derived from a simulation exercise and should not be interpreted as a forecast of future index values. Market participants should conduct their own independent analysis before making commercial or investment decisions based on benchmark methodology changes.
Want to Track the ASX Discoveries That Could Reshape Commodity Markets?
Discovery Alert's proprietary Discovery IQ model delivers real-time alerts the moment significant mineral discoveries hit the ASX, transforming complex data across more than 30 commodities into clear, actionable insights for both traders and long-term investors — explore Discovery Alert's discoveries page to see the historic returns major finds have generated, and begin your 14-day free trial to stay ahead of the next market-moving announcement.