June 12, 2026
Industrial demand patterns are evolving beyond traditional applications as global electrification accelerates across multiple sectors. Mining companies worldwide are witnessing a fundamental transformation in how copper consumption drives project economics, investment decisions, and long-term strategic planning. This transition in copper demand represents more than cyclical market dynamics, reflecting structural changes that could reshape the industry for decades.
Understanding the Copper Demand Revolution: From Industrial Metal to Energy Transition Catalyst
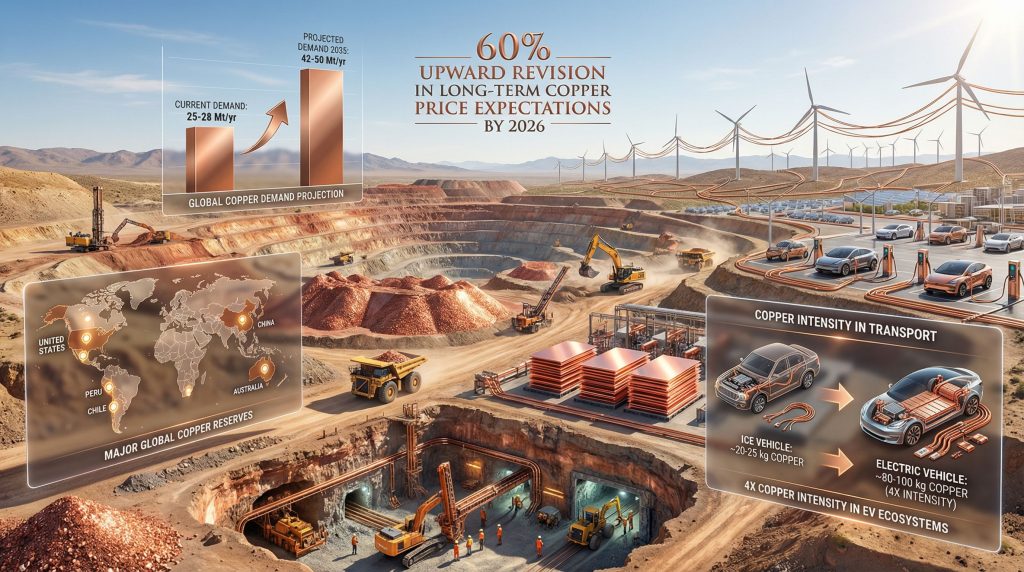
The transition in copper demand reveals itself through dramatic consumption pattern changes that extend far beyond conventional infrastructure applications. Current global copper consumption approaches 25-28 million tonnes annually, with projections indicating potential demand reaching 42-50 million tonnes by 2035. This unprecedented growth trajectory stems primarily from energy transition catalysts, which now represent approximately 40-50% of incremental demand growth.
Quantifying the Magnitude of Demand Transformation
The International Energy Agency's Critical Minerals Market Review demonstrates that clean energy technologies require substantially higher copper intensity compared to traditional applications. Electric vehicles exemplify this transformation, containing approximately 25-50 kilograms of copper per vehicle compared to 10-15 kilograms in conventional internal combustion engines. This represents a 4x copper intensity increase that directly correlates with global EV adoption rates.
Wind turbine installations further illustrate copper demand intensity changes. According to the International Renewable Energy Agency, onshore wind turbines require approximately 3-7 tonnes of copper per megawatt of capacity, depending on generator specifications and design configurations. Permanent magnet generators utilise slightly different copper requirements than conventional copper-wound alternatives, though both configurations maintain substantial copper content.
Regional electrification initiatives compound these individual technology demands. The Australian Energy Market Operator projects renewable energy capacity expansion from 40 gigawatts in 2022 to over 100 gigawatts by 2030, requiring extensive transmission infrastructure upgrades and substation installations across the continent.
Sector-by-Sector Demand Driver Analysis
Grid modernisation represents perhaps the most copper-intensive aspect of energy transition implementation. Smart grid technologies mandate upgraded distribution infrastructure capable of accommodating distributed renewable generation and demand-side management systems. The Edison Electric Institute reports that U.S. utilities invest approximately $30+ billion annually in transmission and distribution upgrades, with copper-intensive components representing 15-20% of material costs.
Energy storage systems add another layer of copper demand complexity. Battery storage installations require substantial copper wiring for power conversion systems, cooling mechanisms, and grid interconnection equipment. As battery deployment accelerates globally, these auxiliary copper requirements multiply proportionally.
Data centre expansion, driven by artificial intelligence and cloud computing growth, creates additional copper demand vectors. Modern hyperscale data centres require extensive copper infrastructure for power distribution, cooling systems, and networking equipment. This demand stream operates independently of traditional industrial cycles, providing consistent consumption growth.
When big ASX news breaks, our subscribers know first
What Economic Forces Are Driving Long-Term Price Expectation Adjustments?
Mining industry price assumptions have undergone systematic revision as companies internalise structural supply-demand imbalances. Analysis of over 300 technical studies conducted between 2015 and 2026 reveals that long-term copper price assumptions increased from approximately US$3.00 per pound during 2015-2020 to US$4.80 per pound by early 2026, representing a 60% nominal increase.
Investment Decision Framework Evolution
This price assumption evolution reflects more than market speculation. Industry analysts have incorporated observable supply constraints and demand acceleration into probabilistic modelling frameworks. Even when adjusted for inflation, current long-term price assumptions represent approximately 28% increases above 2020 real levels, indicating fundamental expectation shifts rather than temporary optimism.
According to research from Chilean consultancy Plusmining, industry participants maintain disciplined pricing assumptions anchored to observable market references rather than speculative peaks. Head of Mining Industry Analysis Andrés González notes that companies avoid excessive optimism despite upward expectation revisions, suggesting that pricing assumptions reflect internalised structural market changes.
Current London Metal Exchange copper prices exceeded US$6.00 per pound in early 2026, representing historically elevated levels even when adjusted for inflation. However, long-term assumptions at US$4.80 per pound remain below recent spot prices, indicating industry conservatism and focus on sustainable pricing rather than peak market conditions.
Market Structure Transformation Indicators
| Investment Parameter | 2015-2020 Baseline | 2026 Projections | Strategic Impact |
|---|---|---|---|
| Long-term price assumptions | $3.00/lb | $4.80/lb | 60% upward revision |
| Project IRR thresholds | 8-12% | 15-18% | Higher return requirements |
| Development timelines | 12-15 years | 17-20 years | Extended capital cycles |
| Resource grade expectations | 0.8-1.0% copper | 0.6-0.8% copper | Declining ore quality |
These parameter changes fundamentally alter project economics and capital allocation priorities. Previously marginal or sub-economic projects now demonstrate acceptable returns under revised pricing assumptions, expanding the potential project pipeline for development consideration.
Risk-adjusted modelling frameworks now incorporate supply constraint probabilities, including geopolitical risks, operational disruption scenarios, and permitting delays. Furthermore, this probabilistic approach recognises that supply-side uncertainties warrant premium pricing assumptions compared to historical precedent.
Why Are Supply-Side Constraints Creating Structural Market Imbalances?
Supply-side constraints operate across multiple dimensions that collectively limit copper production capacity expansion. These constraints range from geological factors to regulatory complexities, creating compounding effects on market balance.
Geological and Operational Bottlenecks
Ore grade deterioration represents the most fundamental supply constraint affecting the copper industry. Global average copper ore grades have declined from approximately 1.0-1.5% copper content in the 1990s to 0.6-0.8% copper in the 2020s, according to U.S. Geological Survey data. This ongoing degradation requires proportionally more mining, crushing, and milling operations per unit of copper recovered.
The mathematical implications are significant: processing lower-grade ore increases both capital requirements for equipment capacity and operating costs for energy consumption. A mine processing 0.6% copper ore requires approximately 30-40% more material handling compared to processing 0.8% copper ore for equivalent copper production.
Geographic concentration compounds these grade challenges. For instance, Chile controls approximately 28% of identified reserves, Peru holds 13%, Australia contains 9%, and Russia and Mexico each maintain roughly 5%. This concentration creates supply vulnerability to regional disruptions and geopolitical tensions.
Development Timeline Challenges
Discovery-to-production timelines average 17 years for major copper projects, creating substantial lag between market demand signals and supply responses. Even projects approved today will unlikely contribute significant production volumes before 2040, regardless of current market conditions.
This timeline constraint reflects multiple factors:
• Exploration and resource definition: 3-5 years for initial resource estimation
• Feasibility studies and engineering: 2-4 years for technical and economic validation
• Permitting and regulatory approval: 3-7 years depending on jurisdiction complexity
• Construction and commissioning: 3-5 years for mine development and processing facilities
• Ramp-up to full production: 1-2 years for operational optimisation
Environmental permitting has become increasingly complex across major mining jurisdictions. Projects must navigate multiple regulatory frameworks covering environmental impact, community consultation, water usage, and biodiversity protection. However, these requirements, while necessary for sustainable development, extend approval timelines significantly.
Operational disruptions during 2025 highlighted supply chain fragility. Major operations including Grasberg in Indonesia, Kamoa-Kakula in the Democratic Republic of Congo, and El Teniente in Chile experienced various operational challenges that reduced global copper availability. El Teniente specifically faced workplace safety issues that resulted in legal penalties exceeding 234 million Chilean pesos, demonstrating how operational disruptions can compound supply constraints.
How Are Mining Companies Adapting Investment Strategies to New Demand Realities?
Mining companies are fundamentally restructuring portfolios to increase copper exposure through multiple strategic approaches. These adaptations reflect recognition that the transition in copper demand represents a multi-decade trend rather than cyclical market conditions. Companies are exploring various copper investment strategies to capitalise on this transformation.
Portfolio Rebalancing Initiatives
Major mining companies are targeting 60-70% copper revenue composition by 2030, compared to historical averages of 40-50%. This strategic shift requires systematic asset reallocation, including divestment of non-copper assets and acquisition of copper-focused operations.
Brownfield expansion projects receive prioritised capital allocation due to shorter development timelines and reduced execution risk. Consequently, these projects typically require 3-5 years from approval to production, compared to 10-15 years for greenfield developments.
Technology integration accelerates across exploration and extraction operations. Artificial intelligence applications include:
• Predictive geology modelling for exploration targeting
• Automated ore sorting for grade optimisation
• Predictive maintenance for equipment reliability
• Process optimisation for recovery efficiency
Capital Deployment Strategic Shifts
Investment decision frameworks now incorporate longer planning horizons and higher price assumptions. Projects previously categorised as sub-economic demonstrate acceptable returns under revised economic parameters.
Consider a representative brownfield expansion scenario:
| Economic Parameter | US$3.00/lb Assumption | US$4.80/lb Assumption | Decision Impact |
|---|---|---|---|
| Annual Operating Margin | $25M | $115M | 360% increase |
| Project IRR (20-year) | 6-8% | 18-22% | Above hurdle rate |
| Payback Period | 12-15 years | 6-8 years | Accelerated returns |
| Investment Status | Deferred | Approved | Status reversal |
This economic transformation explains renewed interest in previously marginal projects and increased merger and acquisition activity targeting copper-rich assets. In addition, successful gold and copper exploration programmes are becoming increasingly valuable in the current market environment.
Joint ventures and strategic partnerships enable risk sharing for large-scale developments. These arrangements allow companies to participate in major projects while managing capital exposure and technical execution risk.
What Role Does Recycling Play in Meeting Future Demand Requirements?
Secondary copper supply currently contributes approximately 20% of global copper consumption, representing roughly 4.5 million tonnes annually. However, recycling expansion potential could add an additional 3.5 million tonnes by 2035, providing significant supply augmentation without new mining operations.
Secondary Supply Optimisation Potential
Urban mining represents the largest recycling opportunity, targeting copper recovery from building demolition, infrastructure replacement, and electronic waste. Developed economies contain substantial copper inventory in existing infrastructure that becomes available for recovery as assets reach end-of-life.
Technology advancement improves recycling economics through enhanced recovery processes. Modern recycling facilities achieve 95-98% copper recovery rates from appropriate feedstock, compared to 80-85% recovery rates using conventional methods.
Regional recycling hub development reduces transportation costs and import dependency. The European Union and North America are developing comprehensive recycling infrastructure targeting domestic copper waste streams.
Circular Economy Integration Strategies
Design for recyclability initiatives improve future copper recovery potential. Manufacturers increasingly consider end-of-life copper recovery during product design, facilitating higher recovery rates and reduced contamination.
Supply chain localisation through recycling provides multiple benefits:
• Reduced import dependency for copper-consuming nations
• Lower carbon emissions compared to primary copper production
• Economic development in recycling infrastructure regions
• Price stability through diversified supply sources
Economic viability thresholds for recycling operations depend on copper prices, labour costs, and environmental regulations. Current price levels support recycling expansion across most developed economies, though emerging markets require higher copper prices for recycling viability.
How Do Regional Demand Patterns Influence Global Market Dynamics?
Regional demand variation creates distinct market dynamics that influence global copper allocation and pricing. Emerging markets drive absolute demand growth, while developed economies focus on infrastructure replacement and electrification.
Emerging Market Growth Trajectories
India and Southeast Asia represent the largest incremental copper demand growth regions, potentially adding 3.3 million tonnes of annual consumption by 2035. This growth stems from economic development, urbanisation, and infrastructure modernisation requirements.
Infrastructure copper intensity varies significantly by development stage and technology adoption rates. Smart city initiatives require substantially higher copper intensity compared to conventional urban development, reflecting advanced electrical systems and data infrastructure requirements.
Power grid modernisation across emerging economies necessitates wholesale infrastructure replacement rather than incremental upgrades. Many developing nations lack comprehensive electrical grid coverage, requiring new transmission and distribution infrastructure construction.
Developed Market Transition Scenarios
Net-zero policy commitments drive copper demand acceleration across developed economies. These commitments mandate renewable energy expansion, electric vehicle adoption, and industrial decarbonisation initiatives within specific timeframes.
Energy security considerations following recent geopolitical events prioritise domestic renewable capacity expansion. European nations particularly emphasise energy independence through accelerated renewable energy deployment, requiring substantial copper infrastructure investments.
Industrial decarbonisation programmes focus on electrification of manufacturing processes previously dependent on fossil fuels. Consequently, steel production, chemical manufacturing, and cement production are evaluating electric alternatives that substantially increase copper consumption.
The next major ASX story will hit our subscribers first
What Are the Investment Implications of Copper Market Transformation?
Investment framework evolution reflects recognition that copper market transformation represents structural rather than cyclical change. This recognition influences risk assessment, return expectations, and portfolio allocation strategies. The copper supply forecast suggests continued constraints that support higher pricing assumptions.
Risk Assessment Framework Updates
Demand volatility modelling incorporates technology adoption rate sensitivity and policy implementation scenarios. Electric vehicle adoption rates demonstrate how technology penetration can accelerate beyond linear projections, creating upside demand scenarios.
Supply disruption probability matrices consider geopolitical tensions, climate change impacts, and operational complexity increases. Recent disruptions at major operations demonstrate how single-point failures can affect global market balance.
Price volatility management strategies acknowledge higher baseline price assumptions while protecting against downside scenarios. Advanced research indicates that supply constraints may persist longer than initially anticipated.
Strategic Positioning Opportunities
| Investment Category | Risk Profile | Return Potential | Timeline | Key Considerations |
|---|---|---|---|---|
| Brownfield Expansions | Medium | Moderate-High | 3-5 years | Operational track record |
| Greenfield Development | High | High | 10-15 years | Execution and permitting risk |
| Recycling Infrastructure | Low-Medium | Moderate | 2-4 years | Technology and feedstock access |
| Technology Partnerships | Medium-High | Variable | 5-10 years | Innovation adoption rates |
Technology partnerships offer exposure to copper demand growth through innovation rather than traditional mining investments. Companies developing electric vehicle components, renewable energy systems, and grid infrastructure provide alternative copper market participation.
Vertical integration strategies consider copper market exposure through downstream applications. Battery manufacturers, electric motor producers, and renewable energy developers offer copper demand exposure with value-added processing capabilities.
How Should Stakeholders Prepare for Copper Market Evolution?
Stakeholder preparation requires scenario planning that accommodates multiple demand growth trajectories and supply constraint scenarios. The transition in copper demand creates both opportunities and challenges across the copper value chain. Moreover, mining industry innovation will play a crucial role in addressing these challenges.
Strategic Planning Considerations
Scenario planning frameworks evaluate multiple demand growth trajectories based on policy implementation rates, technology adoption speeds, and economic development patterns. Base case scenarios assume current trend continuation, while accelerated scenarios model rapid electrification adoption.
Supply chain resilience building prioritises diversification across geographic regions and supply sources. Single-source dependency creates vulnerability to operational disruptions, political instability, and regulatory changes.
Technology adoption roadmaps identify automation and efficiency improvement opportunities that reduce operational costs and improve productivity. Digital transformation initiatives target predictive maintenance, process optimisation, and resource recovery enhancement.
Policy and Regulatory Adaptation Requirements
Permitting process optimisation requires collaboration between industry and regulatory agencies to streamline approval mechanisms without compromising environmental protection standards. Regulatory certainty reduces project development risk and encourages investment commitment.
International cooperation frameworks address resource security concerns and trade facilitation requirements. Copper-consuming nations require reliable supply access, while copper-producing countries seek stable demand and fair pricing.
Environmental standard harmonisation facilitates sustainable mining practice implementation across jurisdictions. Consistent environmental requirements reduce compliance complexity while ensuring responsible resource development.
Disclaimer: This analysis contains forward-looking statements and projections based on current market conditions and publicly available information. Copper prices, demand projections, and supply estimates involve significant uncertainties and may differ materially from actual outcomes. Investors should conduct independent research and consider consulting financial advisors before making investment decisions. Past performance does not guarantee future results.
Are You Tapping Into the Copper Market Transformation?
As the demand for copper shifts dramatically with global electrification, Discovery Alert provides real-time alerts on significant ASX mineral discoveries using its proprietary Discovery IQ model. Discover how to capitalise on these transformative opportunities by visiting Discovery Alert’s discoveries page today.