July 8, 2026
When Surplus Meets Speculation: The Copper Market's Uncomfortable Truth
Commodity markets have a long history of pricing tomorrow's scarcity before it arrives. Copper is no exception. Over multiple decades, the metal has oscillated between periods of genuine supply tightness and speculative overreach, with financial markets consistently running ahead of physical reality. The current cycle is playing out with unusual intensity. Prices have reached record territory whilst a confirmed global surplus sits beneath the surface, demand is expected to cool in key consuming regions, and the structural forces that lifted copper to its January CY26 peak are quietly unwinding. For investors and industry participants watching copper demand to slide as prices rise, understanding the mechanics behind this divergence is essential.
When big ASX news breaks, our subscribers know first
The Mechanics of Price-Induced Demand Destruction
How Elevated Prices Reshape Buyer Behaviour Across the Chain
In commodity economics, demand destruction is not a cliff edge. It is a gradual erosion that begins at the margins, spreads through substitution decisions, and eventually surfaces in consumption data months after the pricing signal first appeared. Copper's current situation follows this pattern closely.
When LME copper prices hold well above what analysts estimate as fundamental fair value, the consequences cascade through multiple layers of the supply chain. Fabricators begin stretching existing inventories rather than replenishing at spot prices. Manufacturers conduct engineering reviews to assess whether aluminium wiring or alternative conductors can substitute for copper in non-critical applications. Construction project timelines shift. Capital expenditure plans for copper-intensive industrial buildout face budget pressure.
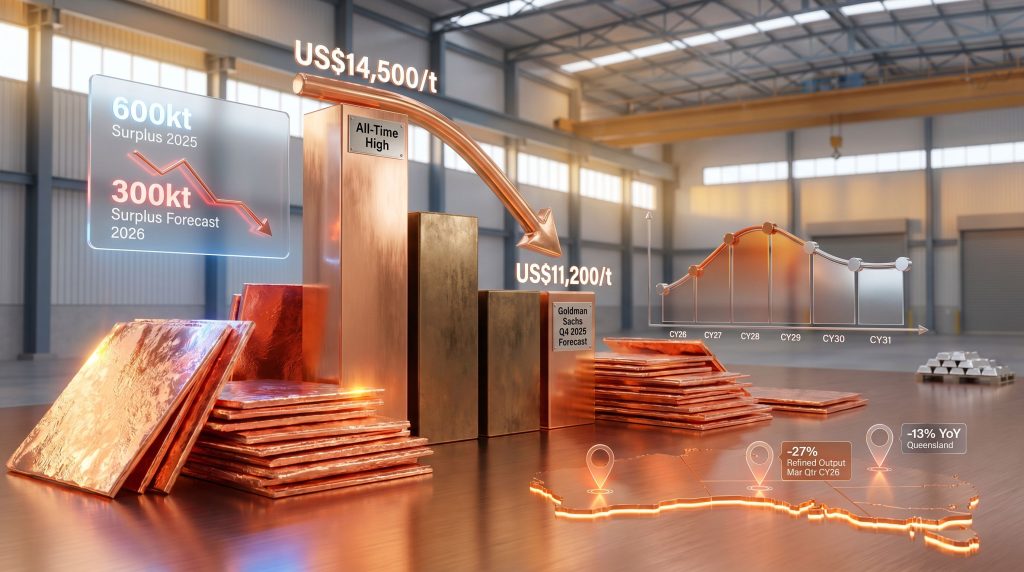
Goldman Sachs has estimated copper's fundamental fair value at approximately US$11,500 per tonne, with Q4 CY26 forecasts pointing toward US$11,200 per tonne. With the metal having peaked at US$14,500 per tonne in January CY26, the gap between financial pricing and physical demand reality had widened to a degree that market participants could not sustain indefinitely. Understanding copper market trends helps contextualise why this divergence has emerged so sharply in the current cycle.
The Threshold Effect in Practice
There is no universally agreed price level at which copper demand begins contracting, but analyst models consistently identify a zone where behavioural shifts become material. Historically, when copper prices exceed long-run marginal cost of production by 40% or more for an extended period, the combination of substitution, inventory drawdown, and project deferral begins suppressing apparent demand by a measurable margin. The current cycle has exceeded that threshold for several consecutive quarters.
Global Copper Demand in CY25: Strong Growth With Uneven Distribution
A Market Running Hot Before the Slowdown
Global demand for newly refined copper rose 1.3% year-on-year in CY25, reaching 27.9 million tonnes. That headline figure masked significant regional divergence, with a handful of high-growth markets doing the heavy lifting whilst structural decline weighed on established industrial economies.
| Region | CY25 Demand Change (YoY) | Key Demand Driver |
|---|---|---|
| China | +4.0% to 16.6 Mt | Infrastructure buildout, EV manufacturing |
| India | +5.2% | Industrial and grid expansion |
| United States | +3.9% | Pre-tariff inventory accumulation |
| Germany | +3.6% | Moderate industrial recovery |
| South Korea | -8.6% | Electronics sector contraction |
| Japan | -4.5% | Structural industrial decline |
| European Union | -2.8% | Weak manufacturing output |
China's consumption of 16.6 million tonnes represented approximately 59% of global copper usage in CY25, a concentration that makes Beijing's industrial and infrastructure policy decisions the single most consequential variable for global copper price dynamics. India and the United States delivered meaningful growth, but neither market is large enough to offset a meaningful Chinese demand correction. Furthermore, China's industrial demand outlook points to headwinds that could amplify the slowdown across broader commodity markets.
The Double-Edged Nature of China's Dominance
China's outsized share of global copper consumption creates an asymmetric risk profile for the market. When China's industrial pipeline is active, copper demand absorbs available supply with ease. However, when Chinese policymakers moderate infrastructure stimulus, defer real estate activity, or face export headwinds that compress manufacturing output, the global market faces a demand void that no other region can quickly fill.
Analysts monitoring the H2 CY26 outlook describe the anticipated Chinese demand pullback as more pronounced than the softening experienced in 2024, with the combination of property sector deleveraging, export uncertainty, and reduced fiscal stimulus creating a more durable demand headwind than previous cycles produced.
Record Prices, Confirmed Surplus: The Disconnect That Defined Early CY26
From Fundamentals to Financial Positioning
LME copper prices surged 38% year-on-year in Q1 CY26, with the January all-time high of US$14,500 per tonne driven by a market dynamic that had less to do with physical copper scarcity and considerably more to do with financial positioning and trade policy arbitrage. The tariff-driven copper rally has been well-documented as a distorting force rather than a reflection of genuine supply constraints.
The core distortion mechanism was straightforward: anticipation of US import tariffs on copper drove an aggressive wave of pre-emptive inventory accumulation in American warehouses. Traders and industrial buyers moved to import copper ahead of potential tariff implementation, creating a surge in apparent demand that flattered global consumption statistics whilst building stockpiles that would subsequently weigh on forward purchasing.
Analysts have characterised the early CY26 copper market as one of the most distorted in recent memory, with inventory-driven price signals masking an underlying physical surplus rather than reflecting genuine supply scarcity.
The scale of that surplus makes the price rally particularly difficult to justify on fundamental grounds. The global copper market recorded an estimated 600 kiloton surplus in 2025, and Goldman Sachs has projected a further 300 kiloton surplus for 2026. Prices rising sharply against a backdrop of confirmed surplus is a pattern that commodity historians recognise as a late-cycle financial phenomenon rather than a supply-driven price discovery event.
Mine Disruptions and the Sulphuric Acid Variable
Not all of the price support has been speculative. Genuine supply-side disruptions have contributed to keeping prices elevated even as surplus data points in the opposite direction. Mine disruptions at several major producing operations, combined with emerging risks around sulphuric acid availability — a critical reagent in copper solvent extraction-electrowinning (SX-EW) processing — have added a supply-side risk premium to market pricing.
SX-EW processing is a hydrometallurgical technique used to recover copper from oxide ores. It requires substantial quantities of sulphuric acid, and any tightening in acid availability, whether from smelter shutdowns or logistics constraints, can reduce output at SX-EW operations independently of ore availability or mine throughput. According to the IEA's analysis of copper smelter pressures, this lesser-known supply variable has kept a floor under copper prices even when broader fundamentals suggest softness.
The AI and Energy Transition Copper Demand Debate
Structural Demand That Is Real But Frequently Overstated
The narrative linking artificial intelligence infrastructure buildout and energy transition investment to copper demand is not without merit. Data centres require copper-intensive power distribution systems. Electric vehicles use approximately three to four times more copper than internal combustion engine vehicles. Grid modernisation and offshore wind deployment are genuinely copper-intensive activities.
The analytical challenge is in the magnitude and timing of this incremental demand. Forward estimates for AI-driven copper demand by 2030 range from approximately 500,000 tonnes at the conservative end to over 1 to 2 million tonnes at more optimistic projections. That variance of 400% between analyst forecasts is not a minor modelling disagreement. It reflects genuine uncertainty about the pace of AI infrastructure deployment, the copper intensity of different data centre configurations, and the timeline for grid upgrade programmes across major economies.
What the Demand Gap Means for Pricing
When forward demand estimates carry that degree of uncertainty, the risk of a price premium correction is meaningful. Markets tend to price the optimistic scenario when sentiment is positive and then reprice toward the conservative scenario when near-term demand data disappoints. The current copper market appears to have embedded a forward demand premium that assumes rapid AI and energy transition uptake — a scenario that may prove directionally correct over the decade but is unlikely to prevent a nearer-term price normalisation.
Scrap copper availability adds another layer of complexity. Elevated prices accelerate the release of secondary copper supply from recycling streams and dormant stockpiles, increasing market availability precisely when primary supply is expected to moderate. This dynamic, known as the scrap feedback loop, is a feature of copper market cycles that can extend surplus conditions longer than primary supply data alone would suggest. Consequently, the global copper supply gap may prove less severe in the near term than structural narratives currently imply.
Macroeconomic and Geopolitical Headwinds Amplifying the Demand Risk
The GDP Sensitivity Factor
Copper's demand trajectory is tightly correlated with global economic growth. J.P. Morgan's analytical framework identifies a GDP-to-copper demand sensitivity multiplier of approximately 1.2x, meaning a 1% deceleration in global GDP growth tends to produce roughly a 1.2% drag on copper demand growth. In an environment where geopolitical uncertainty is already suppressing industrial activity and capital investment, this sensitivity becomes a meaningful downside variable.
Energy price inflation compounds the effect in manufacturing-heavy economies. Higher energy costs raise the input cost of copper fabrication, incentivising producers to reduce throughput and defer capacity expansion, effectively transmitting an energy price shock into the copper demand chain even without any change in final consumption patterns.
The Tariff Resolution Paradox
One of the more counterintuitive near-term risks for copper demand involves the resolution of US trade policy uncertainty. The pre-tariff stockpiling cycle that inflated apparent US demand in H1 CY26 will reverse once tariff certainty is established. If tariffs are implemented at rates lower than feared, or if exemptions emerge, buyers who accumulated inventory in anticipation of higher import costs will reduce forward purchasing to work down their positions. If tariffs are implemented as expected, the same drawdown dynamic applies as buyers consume accumulated stock before returning to the spot market. Either outcome suggests US apparent copper demand will moderate materially in H2 CY26 relative to the elevated H1 pace.
The next major ASX story will hit our subscribers first
Australia's Copper Sector: A Market in Transition
Production Constraints Beneath the Price Boom
Australian copper production presents a paradox of its own. The country's miners are operating in the most favourable price environment in the metal's recorded history, yet domestic mined copper output is estimated to have fallen 2.2% year-on-year in CY25-26, with multiple operational disruptions reducing both mined and refined output simultaneously.
The geographic concentration of Australia's copper production challenges created a compounding effect:
- Western Australia: Output at the Boddington mine declined from H2 CY25 onward due to deteriorating ore grades combined with bushfire damage to operational infrastructure
- Queensland: State-level copper output fell 13% year-on-year in CY25, reflecting the suspension of the Capricorn project following 2024 flood damage; Mount Colin entered care and maintenance in early 2025; and the Mount Isa underground copper mine permanently ceased operations in July 2025
- South Australia: Modest growth partially offset the Queensland shortfall, supported by steady production at BHP's Olympic Dam and improved throughput at Kanmantoo
The Refined Output Collapse and Its Implications
The closure of the Mount Isa underground copper mine created a feedstock problem that reverberated through Australia's refining infrastructure. Australian refined copper output fell 27% year-on-year in the March quarter of CY26, driven by reduced feedstock availability at the Mount Isa smelter and the disruption of third-party feed supply chains across Queensland.
This refined output decline is significant beyond its immediate production impact. Refined copper is the market-ready product, and a 27% quarterly decline means Australia's contribution to global refined copper supply contracted sharply at exactly the moment when prices incentivised maximum output. BHP's own research on copper's future role underscores why these structural constraints matter beyond the immediate production figures.
| Metric | CY25-26 Estimate | YoY Change |
|---|---|---|
| Australian copper export earnings | A$14.6 billion | +17% vs CY24-25 |
| Refined copper output (March Qtr CY26) | Significantly reduced | -27% YoY |
| Mined copper production (CY25-26) | Declining | -2.2% YoY |
| Queensland copper output (CY25) | Reduced | -13% YoY |
Despite these volume constraints, Australia's copper export earnings are estimated to reach A$14.6 billion in CY25-26, approximately 17% higher than CY24-25, as elevated spot prices more than compensated for reduced shipment volumes. This price-volume dynamic illustrates how revenue metrics can paint an optimistic picture at the same time as operational metrics signal structural challenges.
Australia's Long-Term Copper Recovery Pathway
The Road to 481kt by CY30-31
Australian refined copper output is projected to recover gradually, with the Department of Industry, Science, and Resources forecasting production reaching approximately 481 kilotonnes by CY30-31. Two primary engines are expected to drive that recovery.
BHP's Copper South Australia expansion programme, centred on Olympic Dam and related infrastructure, represents the most substantial volume growth catalyst in Australia's copper pipeline. The expansion leverages Olympic Dam's status as one of the world's largest known copper-uranium-gold deposits and involves significant processing capacity upgrades. In addition, reviewing available copper investment strategies may help investors position appropriately ahead of this anticipated production recovery.
SX-EW operations across Queensland and South Australia will play a bridging role, processing oxide ore bodies and heap leach material to supplement concentrator output during the period when underground mine feedstock availability remains constrained.
Global Price Trajectory: Elevated Near-Term, Gradual Moderation Ahead
| Period | Price Outlook | Demand Trajectory | Key Variable |
|---|---|---|---|
| H2 CY26 | Elevated but retreating from peak | Slowing materially | Tariff unwind, Chinese pullback |
| CY27-CY28 | Supported above long-run average | Stabilising with structural growth | Energy transition demand, supply tightness |
| CY29-CY31 | Gradual moderation | Steady growth resumption | New mine supply, scrap availability |
The DISR's outlook anticipates that tight supply conditions and ongoing structural demand from energy transition applications will keep prices supported above long-run average levels through CY28, before new mine supply additions and improved scrap availability facilitate a gradual normalisation into CY31.
Frequently Asked Questions: Copper Demand and Price Outlook
Why is copper demand expected to fall when prices are high?
High prices trigger demand destruction through substitution, inventory drawdown, and project deferrals. Fabricators and manufacturers reduce purchases when copper trades well above fair value, particularly when alternative conductors like aluminium become cost-competitive for specific applications. This is a core reason why copper demand to slide as prices rise is a recurring pattern in commodity market cycles.
What is the current global copper surplus and why does it matter?
The global copper market recorded an estimated 600 kiloton surplus in 2025, with a further 300 kiloton surplus projected for 2026 by Goldman Sachs. Surplus conditions typically precede price corrections once the financial positioning that supported elevated prices begins unwinding.
How much of the copper price rally reflects AI and energy transition demand?
Structural demand from data centres, EVs, and grid infrastructure is real and growing, but forward estimates vary enormously — from 500,000 tonnes to over 1–2 million tonnes of incremental demand by 2030. Near-term physical consumption does not yet justify the full forward premium embedded in current prices.
What happens to copper prices when US tariff uncertainty resolves?
Resolution of tariff uncertainty will likely trigger a destocking cycle as buyers who accumulated pre-tariff inventory reduce forward purchasing. This unwinding of apparent demand will expose the underlying market surplus more clearly, creating near-term downward price pressure.
How does China's demand slowdown affect global copper markets?
With China representing approximately 59% of global refined copper consumption, even a modest contraction in Chinese demand has a disproportionate impact on global balance. Analysts expect H2 CY26 Chinese demand weakness to exceed the 2024 correction in severity.
What is Australia's copper production outlook through to 2031?
Australian mined copper output declined approximately 2.2% year-on-year in CY25-26 due to multiple operational disruptions. Refined output fell sharply in early CY26 but is projected to recover toward 481 kilotonnes by CY30-31, anchored by BHP's Copper South Australia expansion and SX-EW operations across multiple states.
Five Forces Reshaping the Copper Market in H2 CY26
The convergence of multiple distinct pressures distinguishes this copper market cycle from previous episodes of price volatility:
- Price-induced demand destruction is accelerating as LME copper holds well above Goldman Sachs' fundamental fair value estimate of US$11,500 per tonne, triggering substitution decisions and inventory management strategies across fabrication and manufacturing industries
- Chinese demand contraction representing roughly 60% of global consumption is the single largest near-term demand risk, with H2 CY26 weakness expected to exceed the 2024 correction in both depth and duration
- US tariff-driven stockpiling reversal will expose the underlying 300 kiloton-plus market surplus once buyers shift from accumulation to drawdown mode, removing a key pillar of apparent demand support
- Australian production constraints have prevented the country from fully capitalising on elevated prices, with refined output down 27% year-on-year in Q1 CY26 and mined output declining despite the best price environment on record
- Long-term structural demand from AI infrastructure and energy transition investment remains directionally intact but is unlikely to prevent near-term price normalisation given the scale of current surplus conditions and demand destruction dynamics already in motion
The copper market's long-term thesis, grounded in genuine physical scarcity relative to energy transition requirements, remains structurally compelling. However, the near-term path is shaped by forces that point firmly toward demand moderation and price correction before that longer-term story reasserts itself.
This article is for informational purposes only and does not constitute financial or investment advice. Readers should conduct independent research and consult a licensed financial adviser before making investment decisions. Forward-looking statements, price forecasts, and demand projections involve uncertainty and should not be relied upon as predictions of future outcomes.
Readers seeking further data on Australia's copper and resources market outlook can consult the Resources and Energy Quarterly reports published by the Australian Government's Department of Industry, Science, and Resources, available through the department's official publications portal.
Want to Capitalise on the Next Major ASX Copper Discovery Before the Market Moves?
Discovery Alert's proprietary Discovery IQ model scans ASX announcements in real time, instantly identifying significant mineral discoveries — including copper — and translating complex data into actionable insights for both traders and long-term investors. Explore historic examples of major discovery returns and begin your 14-day free trial to position yourself ahead of the broader market.