July 23, 2026
Understanding the Structural Forces Behind Copper's Essential Role in Modern Economies
Industrial metals face unprecedented demand pressures as global economies undergo simultaneous technological transformations. Unlike previous commodity cycles driven by cyclical construction booms or emerging market industrialisation, today's copper consumption patterns reflect structural shifts across multiple sectors occurring concurrently. The global demand for copper reflects a convergence of electrification mandates, artificial intelligence infrastructure expansion, and renewable energy deployment creating a fundamentally different demand profile compared to historical precedents.
Traditional economic models struggle to capture the compound effect of overlapping technology adoption curves, each requiring significant copper intensity. This metal's unique properties – exceptional electrical conductivity, corrosion resistance, and malleability – position it as irreplaceable across emerging applications from electric vehicles to data centres to smart grid infrastructure.
When big ASX news breaks, our subscribers know first
How Much Copper Does the World Actually Need by 2040?
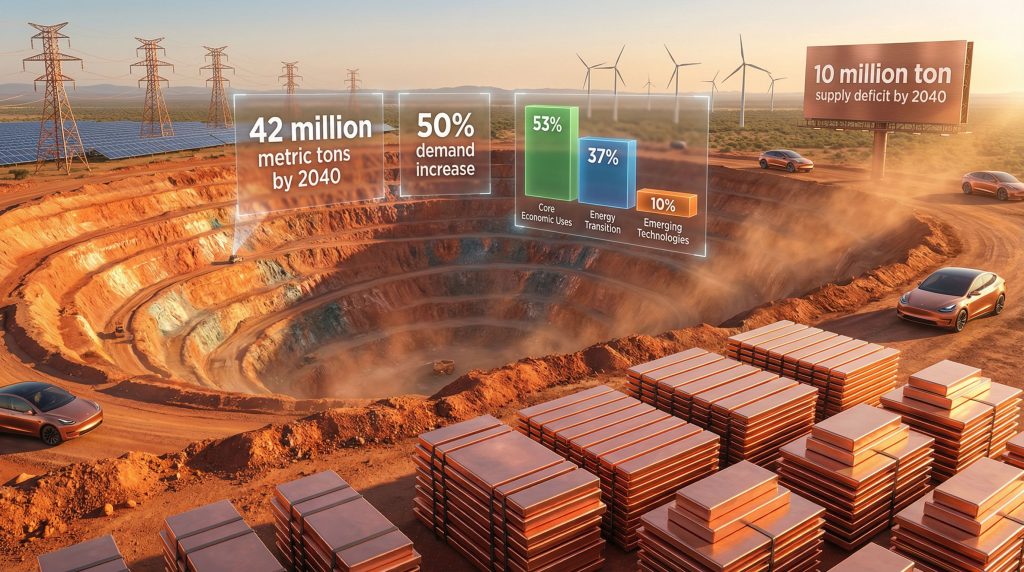
The 50% Demand Surge – Breaking Down the Numbers
Global copper consumption currently operates at approximately 26 million metric tons annually, establishing the baseline for unprecedented growth projections ahead. Furthermore, independent forecasting institutions converge on estimates suggesting worldwide requirements could reach 36-42 million metric tons by 2040, representing a dramatic 50% increase from present levels.
This expansion trajectory implies annual incremental demand of 800,000 to 1.1 million metric tons throughout the projection period, far exceeding historical growth patterns. The International Energy Agency specifically identifies clean energy technologies alone requiring 11.5 million tons by 2040, compared to just 3.2 million tons consumed in 2020.
Such growth rates compound annually at 2.1-2.7%, driven by policy mandates rather than traditional economic cycles. This fundamental shift from cyclical to structural demand creates persistent consumption floors even during economic downturns.
Sectoral Demand Distribution Analysis
The composition of future copper consumption reveals distinct patterns across application categories:
| Sector Category | Volume (Mt) | Share of Total | Primary Growth Driver |
|---|---|---|---|
| Traditional Uses | 23.0 | 55% | Construction, appliances, industrial equipment |
| Energy Transition | 15.5 | 37% | EVs, renewables, grid modernisation |
| Digital Infrastructure | 3.5 | 8% | Data centres, telecommunications, AI computing |
Traditional applications maintain the largest absolute volume but demonstrate slower growth trajectories. In addition, energy transition technologies drive the majority of incremental demand, while digital infrastructure represents the fastest percentage growth rate despite smaller absolute volumes.
Electric vehicles alone require 2.7 million tonnes by 2030, while power networks demand 4.7 million tonnes and renewable generation facilities need an additional 2.5 million tonnes within the same timeframe.
Why Are Energy Transitions Creating a Copper Supply Crisis?
Electrification as the Primary Demand Multiplier
The fundamental physics of electrical systems create copper intensity requirements that cannot be reduced through substitution or efficiency improvements. Electric vehicle manufacturing demonstrates this reality starkly – battery electric vehicles contain approximately 83 kilograms of copper per vehicle, compared to 23 kilograms in traditional internal combustion engine vehicles.
This 3.6x multiplication factor applies across transportation electrification, from passenger cars to commercial vehicles to electric buses and trains. As governments implement internal combustion engine phase-out timelines, the global demand for copper from transportation electrification becomes inevitable rather than cyclical.
Renewable energy infrastructure exhibits even more dramatic copper intensity differentials:
- Onshore wind farms: 4.7 tonnes copper per MW installed capacity
- Offshore wind projects: 9.6 tonnes copper per MW
- Solar photovoltaic installations: 4.0 tonnes copper per MW
- Coal power plants: 1.1 tonnes copper per MW (for comparison)
These intensity ratios mean renewable energy deployment inherently multiplies copper consumption compared to fossil fuel generation replacement.
The Infrastructure Bottleneck Challenge
Power grid modernisation represents the largest single source of incremental copper demand through 2030. The United States Department of Energy estimates domestic grid infrastructure requires 60% expansion to support electrification objectives, while China's State Grid Corporation allocated over $320 billion for infrastructure investments during 2021-2025.
Grid modernisation alone accounts for the majority of projected copper demand growth through 2030, with simultaneous expansion programmes across developed economies creating unprecedented infrastructure investment cycles.
High-voltage transmission lines consume 10-20 tonnes of copper per kilometre, while distribution transformers require 30-50 kilograms per unit. Smart grid technologies add 15-20% additional copper requirements compared to traditional infrastructure, driven by digital monitoring and control systems.
The temporal concentration of these infrastructure programmes creates supply chain bottlenecks, as multiple regions pursue similar electrification timelines simultaneously rather than sequentially.
How Is Artificial Intelligence Reshaping Copper Consumption Patterns?
Data Centre Copper Requirements in the AI Era
Artificial intelligence computing infrastructure represents an entirely new category of copper consumption with exponential growth characteristics. Global data centre electricity consumption reached 460 TWh in 2022 and projects toward 1,050 TWh by 2026, driven primarily by AI workload expansion.
Data centres require 4-6 tonnes of copper per MW of installed capacity, distributed across multiple systems:
- Power distribution systems: 50-60% of total copper content
- Cooling infrastructure: 20-25%
- Computing hardware: 15-20%
- Backup power systems: 5-10%
Major technology corporations announce unprecedented capital expenditure programmes focused on AI infrastructure development. These investments translate directly into copper demand through data centre construction and electrical infrastructure requirements.
The geographic concentration of data centre development in specific regions creates localised copper demand spikes that strain regional supply chains and electrical grid capacity simultaneously.
Defence Spending and Strategic Metal Demand
Geopolitical tensions drive defence sector modernisation programmes requiring advanced electrical systems and communications infrastructure. Military technology development increasingly relies on sophisticated electronics, radar systems, and communications equipment with substantial copper requirements.
Strategic considerations also influence government stockpiling policies, creating additional demand beyond immediate consumption requirements. Defence applications often specify high-purity copper grades, competing with industrial users for premium material supplies.
What Does the Supply-Demand Imbalance Really Look Like?
The Looming 2030s Supply Deficit
Current global mined copper production operates at approximately 22 million tonnes annually, with projections suggesting peak output around 30-33 million tonnes in the early 2030s. However, ore grade degradation and mine depletion thereafter create declining production profiles despite continued investment.
The International Copper Study Group forecasts refined copper market deficits of 167,000 tonnes in 2024 and 92,000 tonnes in 2025, establishing near-term supply constraints. Bloomberg Intelligence projects cumulative supply shortfalls reaching 7.8 million tonnes between 2025-2035, representing massive structural imbalances.
Global mined copper production faces fundamental constraints from ore grade decline and mine life limitations, creating supply ceilings precisely when demand acceleration requires maximum output expansion.
Average copper ore grades declined from 0.8% to 0.6% over the past two decades, requiring increased processing volumes to maintain metal output. This grade degradation trend continues across major producing regions, increasing energy requirements and processing costs while reducing effective supply.
Recycling Limitations and Secondary Supply Constraints
Secondary copper supply currently provides approximately 9 million tonnes annually, representing 35% of total copper supply through recycling operations. End-of-life recycling rates achieve 53-67% efficiency depending on product categories, indicating substantial recovery potential exists.
However, recycling capacity faces inherent limitations from scrap availability cycles. Copper-containing products typically maintain 25-30 year lifespans before entering recycling streams, creating temporal delays between consumption growth and scrap generation.
Urban mining potential remains constrained by collection infrastructure inadequacy and energy-intensive secondary processing requirements. Recycled copper production consumes 10-15% of primary production energy levels, providing efficiency advantages but requiring substantial processing capacity expansion.
Even optimistic recycling projections toward 10 million tonnes by 2040 cannot address the magnitude of projected supply-demand imbalances.
Are We Facing a Copper Shortage in 2026?
Conflicting Market Forecasts for Near-Term Balance
Copper market balance predictions for 2026 vary significantly among institutional forecasters, reflecting uncertainty around Chinese demand trajectories and mine production ramp schedules. For instance, understanding copper price collapse scenarios helps explain this forecasting complexity:
| Forecasting Institution | 2026 Market Projection | Supply-Demand Balance |
|---|---|---|
| International Copper Study Group | 150,000 tonne deficit | Shortage conditions |
| Goldman Sachs Research | Balanced market conditions | Adequate supply |
| CRU Group Analysis | Tight supply conditions | Deficit potential |
These forecast variations stem from different assumptions regarding Chinese economic growth rates, inventory drawdown patterns, and new mine production timing. Chinese consumption represents 56% of global demand, making economic policy decisions in China disproportionately influential on worldwide market balance.
LME warehouse stocks currently maintain approximately 120,000 tonnes, while Shanghai Futures Exchange inventories hold 270,000 tonnes. Combined visible inventories represent just 1.5% of annual global consumption, indicating minimal buffer capacity against supply disruptions.
From Cyclical to Structural Demand Patterns
Traditional copper market cycles responded to construction activity and manufacturing output fluctuations, creating predictable demand elasticity during economic downturns. Contemporary demand drivers operate differently, driven by policy mandates and technology adoption curves rather than economic cycles.
Energy transition targets create demand floors below which consumption cannot decline regardless of economic conditions. Electric vehicle sales mandates, renewable energy capacity requirements, and carbon emission reduction commitments generate copper consumption independent of traditional economic indicators.
Technology infrastructure development follows adoption curves rather than economic cycles, creating persistent demand growth even during economic uncertainty periods. Consequently, the global demand for copper maintains structural support mechanisms previously absent from commodity cycles.
The next major ASX story will hit our subscribers first
Which Regions Are Driving Global Copper Demand Growth?
Asia-Pacific as the Dominant Consumption Hub
Asia-Pacific consumption patterns dominate global copper demand dynamics, with China alone accounting for 14.5 million tonnes annually (56% of worldwide consumption). Chinese infrastructure development programmes drive substantial incremental demand through the 14th Five-Year Plan allocation of $1.57 trillion for power grid infrastructure.
Urban rail transit expansion plans exceed 3,000 kilometres of new metro lines during 2025-2030, requiring substantial copper content for electrical systems and power distribution. Industrial manufacturing capacity expansion continues despite economic moderation, maintaining copper intensity across production facilities.
India emerges as the primary growth market beyond China, with consumption increasing from 820,000 tonnes in 2023 toward projected 1.2 million tonnes by 2030. The National Electricity Plan targets 500 GW renewable capacity by 2030, requiring massive copper infrastructure investment.
Southeast Asian manufacturing expansion creates additional demand growth as supply chain diversification accelerates across the region.
North American and European Infrastructure Renewal
The United States Infrastructure Investment and Jobs Act allocates $65 billion specifically for power grid improvements, representing systematic infrastructure renewal after decades of deferred maintenance. Electric vehicle charging infrastructure deployment requires an estimated 400,000-500,000 tonnes of copper through 2030.
European Green Deal implementation drives continental infrastructure transformation, with the REPowerEU programme establishing renewable energy capacity targets requiring substantial copper investment. Grid interconnection projects across European Union member states create additional infrastructure demand.
Regional demand growth occurs simultaneously rather than sequentially, creating global supply chain pressure as multiple economic regions pursue similar electrification timelines.
What Are the Long-Term Investment Implications?
Strategic Bottleneck Metal Status
Copper achieves strategic bottleneck status within the energy transition framework, where supply constraints could potentially delay net-zero carbon emission targets across entire economies. Unlike other commodities with substitution alternatives, copper's electrical conductivity properties remain irreplaceable across critical applications.
Supply concentration risks compound strategic concerns, with Chile producing 24% of global mined copper, Peru contributing 11%, and the top ten producers controlling 75% of worldwide output. Geopolitical supply disruption potential creates strategic vulnerability for copper-dependent industries.
Investment implications extend beyond direct copper exposure toward entire value chains dependent on reliable copper supply, including automotive manufacturers, renewable energy developers, and electrical equipment producers. Furthermore, copper investment strategies require consideration of these structural market changes.
Market Value Projections Through 2030
Global copper market valuation currently operates at approximately $250 billion annually based on consumption volumes and average pricing. Supply constraint scenarios project potential market values exceeding $450 billion by 2030, assuming price increases driven by deficit conditions.
New mining investment requirements reach $150-200 billion by 2035 to meet projected demand growth, with individual major projects requiring $4-6 billion capital investment over 12-17 year development timelines. Exploration success rates below 1% create additional supply development challenges.
Mining equity performance correlates strongly with copper price movements, creating investment opportunities across the development spectrum from exploration companies to established producers. However, copper prices record highs demonstrate the volatility inherent in these markets.
How Can Supply Constraints Be Addressed?
New Mine Development Challenges
Mining permit approval timelines create significant supply development bottlenecks across major producing jurisdictions:
- United States: 7-10 year average permitting process
- Australia: 3-5 year approval timeline
- Canada: 5-7 year regulatory process
- Chile: 4-6 year permitting duration
Environmental and social governance requirements add complexity and duration to project development, while community engagement and social licence considerations create additional approval criteria beyond technical and financial feasibility.
Project pipeline analysis reveals 62 major copper developments in various stages representing 8.5 million tonnes potential annual capacity. However, only 15-20% of feasibility-stage projects typically reach production within projected timelines.
Technology and Efficiency Solutions
Ore sorting technology improvements offer 15-30% processing efficiency gains, potentially extending mine life and improving economics of lower-grade deposits. Advanced extraction techniques and processing optimisation can increase effective supply from existing operations.
Copper substitution possibilities exist in specific applications, though electrical conductivity requirements limit alternatives in critical energy transition technologies. Aluminium substitution works in some applications but requires design modifications and performance trade-offs.
Circular economy approaches focus on extending product lifecycles and improving end-of-life recovery rates, though these solutions require decades to achieve meaningful scale given product longevity characteristics.
What Does This Mean for Global Economic Stability?
Systemic Risk Assessment
Technology sector vulnerability to copper shortages creates cascade effects across digital infrastructure, renewable energy deployment, and transportation electrification. Supply disruptions in copper markets could delay climate change mitigation efforts and economic decarbonisation timelines.
Manufacturing supply chains demonstrate increasing copper dependency as electrification accelerates across industrial processes. Cost volatility and availability constraints threaten production continuity across multiple economic sectors simultaneously.
Energy security considerations intersect with copper supply security, as renewable energy infrastructure development requires reliable metal supply chains to achieve energy independence objectives. This intersection becomes particularly relevant when evaluating global copper supply forecast scenarios.
Policy Response Requirements
Strategic reserve considerations become increasingly relevant as copper achieves critical material status for economic and environmental objectives. International cooperation mechanisms may require development to address supply security concerns across allied economies.
Trade policy implications affect copper-dependent industries through tariff structures, export restrictions, and supply chain diversification initiatives. Resource diplomacy becomes integral to securing long-term supply agreements and development partnerships.
Investment incentives for domestic mining development, recycling infrastructure expansion, and technology innovation require policy coordination across environmental, economic, and security priorities. For instance, copper and uranium investments often require coordinated policy frameworks supporting strategic mineral development.
The global demand for copper represents more than a commodity cycle – it signals a fundamental structural shift in how modern economies function and develop. As technological advancement accelerates across multiple sectors simultaneously, copper's role as the backbone of electrical infrastructure becomes increasingly critical to economic stability and environmental objectives.
This analysis is based on publicly available industry research and market data. Commodity market projections involve significant uncertainty and should not be considered investment advice. Readers should consult qualified professionals before making investment decisions based on commodity market analysis.
Looking to Capitalise on the Copper Supply Crunch?
Discovery Alert's proprietary Discovery IQ model delivers instant notifications on significant ASX mineral discoveries, helping subscribers identify actionable opportunities in copper exploration and mining companies ahead of the broader market. Understand why historic mineral discoveries can generate substantial returns by exploring major copper finds and begin your 30-day free trial today to position yourself ahead of this structural demand transformation.