June 12, 2026
The Commodity That Reads the Global Economy Before Anyone Else Does
Before equity markets reprice growth expectations, before central banks pivot, and before trade data confirms what manufacturers already feel, copper moves. The metal's extraordinary sensitivity to industrial activity, construction cycles, and energy transition demand has earned it a reputation as the commodity world's most reliable leading indicator. When institutional money managers collectively shift their positioning in copper futures, they are not simply expressing a view on metal prices. They are placing a macro bet on the trajectory of global growth itself.
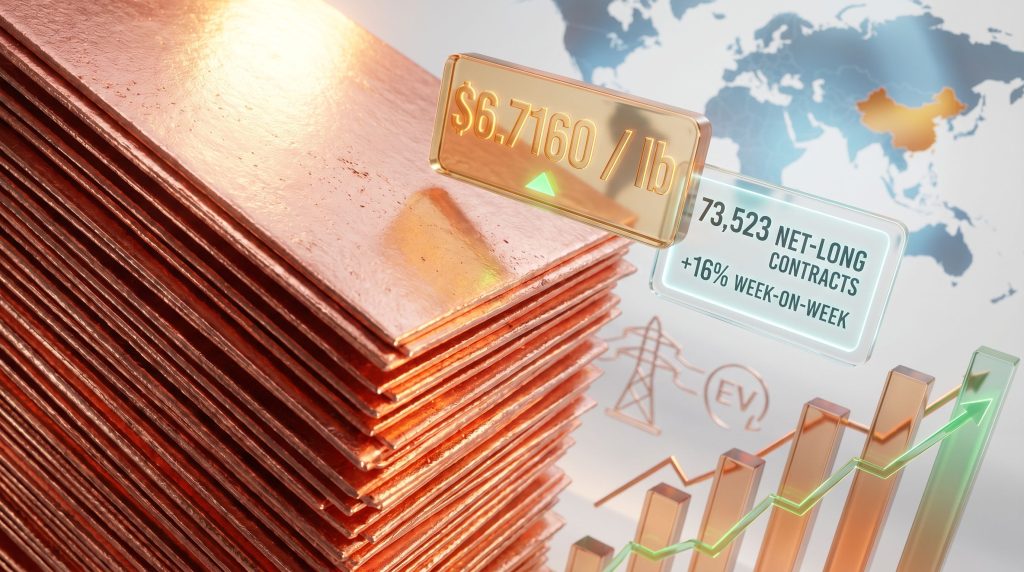
That context makes the latest positioning data from the US Commodity Futures Trading Commission particularly significant. For the week ended May 12, 2026, hedge funds bullish copper wagers lifted their net-long copper contracts by 16%, reaching 73,523 contracts — the highest level recorded in 20 weeks. Days later, Comex copper printed a fresh all-time high of $6.7160 per pound. The convergence of aggressive institutional positioning and record price action is not coincidental. It reflects something deeper about where the smart money believes the copper market is heading.
When big ASX news breaks, our subscribers know first
Understanding What Net-Long Positioning Actually Represents
For investors who do not trade commodity futures directly, CFTC positioning data can appear abstract. However, decoding it correctly is essential for understanding what institutional sentiment is communicating.
Each week, the CFTC publishes its Commitment of Traders report, which breaks down futures market participation by trader category. The "Managed Money" category captures hedge funds, commodity trading advisors, and large speculative accounts. When this group holds more long contracts (bets on rising prices) than short contracts (bets on falling prices), the net figure is positive, indicating collective bullish conviction.
"Net-long positioning in commodity futures reflects speculative conviction, not guaranteed demand. When money managers increase net-long contracts, they are expressing a directional price view rather than purchasing physical copper. This distinction is critical for interpreting what institutional positioning actually signals about market fundamentals."
The key metrics from the most recent data cycle are summarised below:
| Metric | Value |
|---|---|
| Net-long contracts (week ended May 12, 2026) | 73,523 contracts |
| Week-over-week change | +16% |
| Last time positioning was this elevated | December 2025 (20 weeks prior) |
| Comex copper all-time high (May 14, 2026) | $6.7160 per pound |
What makes this positioning shift notable is not just the magnitude of the move but its timing. The 20-week gap between the December 2025 peak and the current level suggests that institutional confidence in copper had been subdued for much of early 2026, making the sudden surge in net-long exposure a meaningful directional signal rather than routine rotation. Furthermore, hedge funds boosting bullish copper wagers to these levels historically coincides with periods of genuine fundamental reassessment rather than short-cycle speculation alone.
The Dual Catalyst Architecture Driving the Current Copper Rally
Commodity rallies with genuine staying power rarely emerge from a single catalyst. The current copper bull cycle appears to be supported by two distinct but reinforcing forces operating simultaneously on opposite ends of the supply-demand equation.
China's Demand Recovery and What the Restocking Cycle Signals
China consumes approximately half of global refined copper output, making its demand trajectory the single most important variable in global copper price formation. When Chinese industrial activity expands through infrastructure investment, property sector stabilisation, or manufacturing PMI acceleration, copper prices typically respond with force.
The current cycle reflects evidence of restocking activity in China, where copper inventories at monitored warehouses had drawn down significantly in the months preceding the May positioning surge. Restocking demand of this nature is distinct from genuine end-use consumption growth, though the two often occur concurrently. The key investor question is whether the current Chinese demand signal represents a durable recovery or a short-cycle inventory rebuild that will fade once warehouse levels normalise.
Supply-Side Risk Premiums and the Mine-to-Market Bottleneck
On the supply side, the copper supply crunch presents structural constraints that are increasingly difficult to resolve within short timeframes. Several factors contribute to the current supply risk premium embedded in prices:
-
Treatment charge compression: Smelters in China have faced extremely low treatment and refining charges (TC/RCs), signalling that copper concentrate supply is tight relative to smelting capacity. TC/RCs serve as an important behind-the-scenes indicator of mine supply health that many non-specialist investors overlook entirely.
-
Project development timelines: New copper mines take between 15 and 20 years from discovery to production at scale. This structural lag means that even if copper prices incentivise new investment today, meaningful new supply cannot reach markets until well into the 2030s.
-
Geopolitical disruption risk: Major copper-producing jurisdictions including Chile, Peru, and the Democratic Republic of Congo have all faced operational disruptions in recent years through labour disputes, regulatory changes, or political instability. The risk premium for potential supply interruptions remains elevated.
"Commodity markets rarely move on a single catalyst. The current copper rally reflects a convergence of Chinese restocking activity, constrained mine-to-market supply pipelines, and macro risk repricing — a combination that historically produces durable price moves rather than short-lived speculative spikes."
Is This a Policy-Driven Trade or a Genuine Demand Story?
One of the more nuanced debates circulating among copper market participants involves the role of US trade policy in amplifying the current price move. The Comex premium over London Metal Exchange pricing has been a focal point, as copper tariff fears have historically created structural dislocations between the two benchmarks.
When US copper import tariffs are anticipated, traders accelerate physical delivery into Comex-registered warehouses to capture the expected price differential. This behaviour inflates Comex prices relative to LME, encourages speculative long positioning, and creates the appearance of tighter supply conditions than may genuinely exist.
Lessons From the 2025 Tariff Positioning Cycle
The 2025 tariff-driven positioning episode provides an instructive case study in how policy anticipation reshapes copper futures markets:
- In early 2025, net-long copper positions climbed to multi-month highs as traders positioned ahead of anticipated US copper import tariffs
- CFTC data confirmed that the primary driver of price appreciation was speculative positioning rather than physical demand acceleration
- When tariff implementation timelines shifted, long positions unwound rapidly, demonstrating how quickly policy-driven trades can reverse
"Policy-driven commodity trades carry elevated reversal risk. When the regulatory trigger fails to materialise on schedule, speculative positions unwind quickly, often faster than they were built. Investors should distinguish between structural demand tailwinds and event-driven positioning cycles."
The current positioning surge appears to blend both dynamics. The Chinese demand recovery component provides fundamental underpinning, while tariff-related Comex premiums may be amplifying the speculative overlay. Consequently, separating these two forces requires close monitoring of LME inventory data alongside Comex positioning figures.
How Quickly Can Bullish Positioning Reverse?
History demonstrates that copper positioning can shift from extreme bullishness to net-short territory with remarkable speed when fundamental catalysts disappoint. In 2023, money managers moved to a net-short position in copper futures for the first time in approximately three years, driven by concerns over Chinese demand disappointment and rising global recession risks. That positioning episode serves as a reference point for how fragile speculative conviction can be when the underlying narrative breaks down.
The table below outlines the key scenarios and their likely impact on positioning:
| Scenario | Likely Positioning Response | Key Trigger |
|---|---|---|
| China demand accelerates | Net-long positions extend higher | PMI expansion, infrastructure spend |
| Tariffs implemented as expected | Comex premium widens, longs hold | US policy confirmation |
| Tariff delay or reversal | Rapid long liquidation | Policy uncertainty |
| China demand disappoints | Net-short risk re-emerges | Inventory builds, weak imports |
| Supply disruption materialises | Renewed bullish surge | Mine closures, export restrictions |
LME warehouse inventory levels function as a particularly useful early warning system for positioning shifts. When inventories build unexpectedly, it signals that physical demand is not absorbing available supply at the current price, creating conditions for long liquidation. Conversely, sustained inventory drawdowns confirm that fundamental demand is running ahead of available supply, providing fuel for positioning to extend further.
How to Read CFTC Copper Positioning Data Step by Step
For investors who want to integrate CFTC data into their copper market analysis, the following framework provides a systematic approach:
- Locate the Managed Money category in the weekly Commitment of Traders report, available free from the CFTC website every Friday afternoon
- Calculate the net-long position by subtracting the total short contracts from total long contracts held by money managers
- Compare the current reading to historical averages to determine whether positioning is elevated, neutral, or depressed relative to the prior 12 to 24 months
- Cross-reference with price action because divergence between rising positioning and flat or falling prices often signals an inflection point where either prices catch up or positioning reverses
- Track the rate of change weekly since the velocity of positioning shifts often reveals more about market conviction than the absolute level alone
- Integrate physical market context including LME inventory levels, Chinese copper import volumes, and TC/RC trends to assess whether speculative positioning aligns with fundamental conditions
Understanding the difference between speculative managed money positioning and longer-term real-money institutional allocation is equally important. Pension funds and sovereign wealth vehicles that invest in copper through physical ETFs or long-dated futures represent a structurally different form of demand than short-cycle hedge fund positioning. The former creates more durable price support; the latter is more volatile and sentiment-dependent. In addition, copper investment strategies that integrate both positioning data and fundamental analysis tend to produce more consistent outcomes than approaches relying on either signal alone.
The next major ASX story will hit our subscribers first
The Green Energy Demand Floor That Changes the Long-Term Equation
What makes the current copper market structurally different from previous commodity cycles is the presence of a demand floor created by the global energy transition. Copper's physical properties make it irreplaceable across the electrification spectrum. A single electric vehicle requires roughly two to four times more copper than a conventional internal combustion engine vehicle. Offshore wind installations are extraordinarily copper-intensive, requiring an estimated 8,000 kilograms per megawatt of installed capacity.
Grid infrastructure upgrades, which are essential prerequisites for absorbing variable renewable generation, require vast quantities of copper conductor. Multiple independent research projections suggest that energy transition demand alone could absorb the equivalent of multiple new large-scale copper mines worth of production annually through 2035 and beyond. This structural demand layer means that even during periods of speculative positioning retreat, physical buyers — including utilities, grid operators, and EV manufacturers — continue to absorb available copper supply, providing a price support mechanism that purely financial commodities cannot access.
"The global energy transition will require copper demand to increase substantially through 2035 and beyond. This structural demand floor means that even during periods of speculative positioning retreat, fundamental buyers continue to absorb physical supply, providing a price support mechanism that purely financial commodities lack."
The cut-off grade economics dimension also matters here in ways that are underappreciated by generalist investors. Global average copper ore grades have declined steadily over the past several decades as the highest-grade deposits were developed first. Many currently operating mines process ore grades below 0.5% copper, compared to historical operations that regularly exceeded 1% to 2%. Lower grades mean more rock must be processed per tonne of copper produced, driving up energy consumption, water usage, and per-unit costs. This geological reality is a structural cost escalator that supports higher long-term price floors regardless of demand cycles.
Copper Price Outlook and Key Levels to Watch
The all-time Comex high of $6.7160 per pound established on May 14, 2026 now functions as both a psychological milestone and a technical reference point. Whether this level represents a ceiling or a launching pad depends on how the competing bullish and bearish catalysts resolve over the coming months.
Key factors that could extend the current rally include sustained evidence of Chinese manufacturing recovery, physical inventory drawdowns at both LME and Comex warehouses, and confirmation of tariff implementation that narrows the arbitrage window. However, factors that could cap or reverse the move include a deterioration in Chinese demand indicators, a shift in US trade policy timelines, or a broad-based macro risk-off episode driven by conflict escalation affecting global growth expectations.
The critical insight for longer-term investors is that even if near-term speculative positioning pulls back, the structural copper deficit narrative — supported by declining ore grades, extended project development timelines, and energy transition demand growth — does not disappear. As Sprott's analysis of copper's bullish inflection notes, tactical volatility in hedge funds bullish copper wagers should not be conflated with a change in the underlying multi-year supply-demand trajectory.
Frequently Asked Questions: Hedge Funds and Copper Market Dynamics
What does it mean when hedge funds increase bullish copper bets?
When large speculative funds raise their net-long positions in copper futures, it signals that institutional traders collectively expect copper prices to rise. This is tracked through CFTC Commitment of Traders data, published weekly and capturing managed money positioning across all major US commodity futures markets.
Why did copper hit an all-time high on Comex in May 2026?
Comex copper reached a record $6.7160 per pound as recovering Chinese demand, tightening global supply conditions, and geopolitical risk premiums converged simultaneously, creating conditions that encouraged aggressive speculative buying alongside genuine physical demand.
Can hedge fund copper positioning predict future prices?
Positioning data functions as a sentiment indicator rather than a price predictor. Extreme net-long positioning can signal both momentum continuation and contrarian reversal risk depending on whether the underlying fundamental catalysts remain intact and whether positioning has become technically crowded.
What is the difference between Comex and LME copper pricing?
Comex is the primary US copper futures exchange while the London Metal Exchange sets the global benchmark. When US tariff risks emerge, Comex prices can trade at a significant premium to LME, creating arbitrage dynamics that attract physical metal flows into the US and further amplify speculative positioning.
Why do declining ore grades matter for long-term copper prices?
As global average copper ore grades decline, producers must process more material per unit of output, raising costs and limiting the supply response to higher prices. This geological constraint supports a structurally higher long-term copper price floor and makes new high-grade discoveries disproportionately valuable.
Key Takeaways: What the Positioning Surge Really Signals
-
Hedge fund net-long copper contracts rose 16% in a single week to reach a 20-week high of 73,523 contracts
-
Comex copper achieved a new all-time high of $6.7160 per pound, reflecting both speculative conviction and genuine fundamental buying pressure
-
The current bullish cycle reflects a convergence of Chinese demand recovery, supply-side constraints, and macro risk repricing rather than a single policy event
-
Historical precedent from 2023 and early 2025 shows copper positioning can reverse rapidly when demand signals disappoint or policy triggers shift
-
Declining global ore grades and energy transition demand create a structural long-term demand floor that distinguishes copper from commodities driven purely by sentiment cycles
-
TC/RC compression at Chinese smelters provides an early warning signal of mine supply tightness that most generalist investors fail to monitor
This article is intended for informational and educational purposes only and does not constitute financial advice. Commodity markets involve significant risk, and futures positioning data reflects speculative sentiment rather than guaranteed price outcomes. Past positioning patterns are not reliable predictors of future price movements. Readers should seek independent financial advice before making investment decisions.
Want To Stay Ahead of the Next Major Copper Discovery on the ASX?
Discovery Alert's proprietary Discovery IQ model scans ASX announcements in real time, instantly identifying significant mineral discoveries across copper and 30+ other commodities — the same kind of structural opportunities that major price moves like the current copper bull cycle tend to surface. Explore historic discovery returns on Discovery Alert's dedicated discoveries page and begin your 14-day free trial to position yourself ahead of the broader market.