June 23, 2026
What Economic Forces Could Drive Copper to $15,000 Per Tonne?
The fundamental drivers behind extreme copper price scenarios extend far beyond traditional industrial demand patterns. Contemporary analysis reveals multiple convergent forces creating unprecedented pressure on global copper supply through both accelerated consumption requirements and constrained supply response capabilities.
Furthermore, market participants increasingly focus on scenarios where copper to hit $15 000/t within three years becomes a realistic possibility. These projections reflect growing recognition that current market structures may prove inadequate for managing supply-demand imbalances driven by structural economic transformation rather than cyclical demand patterns.
Structural Demand Transformation in the Digital Economy
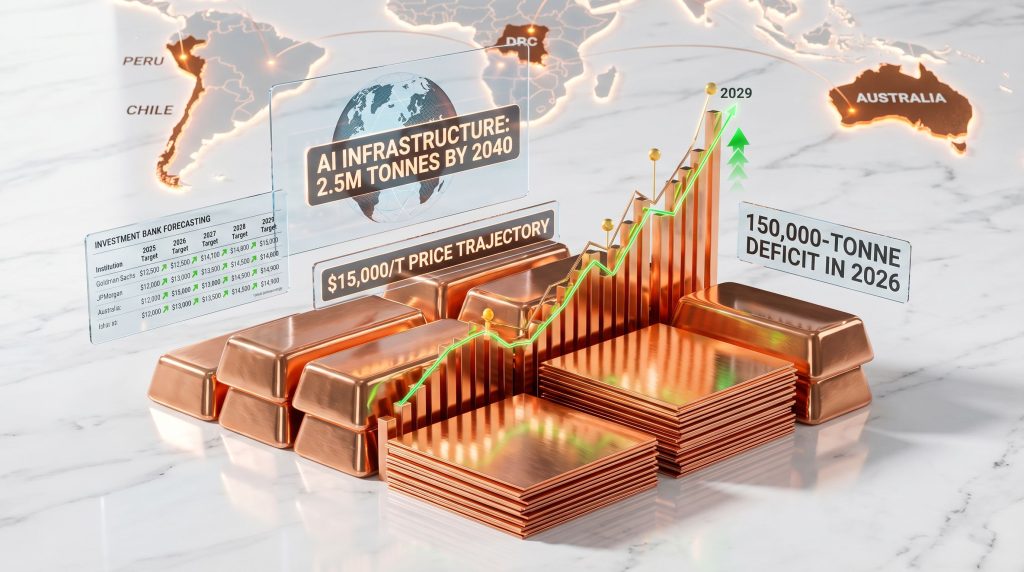
Artificial intelligence infrastructure development represents a paradigmatic shift in copper consumption patterns that traditional forecasting models struggle to capture accurately. Data processing facilities require substantially higher copper intensities compared to conventional building applications, with some estimates suggesting 3-5 times greater copper content per square foot due to advanced cooling systems, high-density electrical distribution, and specialised grounding requirements.
The rapid expansion of AI-driven infrastructure creates compounding demand pressures as organisations race to establish competitive advantages in machine learning and data analytics capabilities. This technological arms race translates directly into accelerated copper consumption timelines that outpace traditional infrastructure development cycles.
Fifth-generation wireless network deployment introduces additional complexity through requirements for specialised copper applications in small cell installations, distributed antenna systems, and enhanced backhaul capacity. Unlike previous network generations, 5G infrastructure demands significantly higher copper grades and more sophisticated conductor specifications to manage increased power requirements and signal integrity standards.
Energy Transition Copper Requirements
Electric vehicle production scaling presents one of the most quantifiable drivers of future copper demand, with industry projections indicating potential growth from approximately 10 million units annually to 30 million units by 2030. Each electric vehicle requires substantially more copper than conventional vehicles, with estimates ranging from 50-80 kilograms per unit depending on battery capacity and motor specifications.
Grid modernisation initiatives across developed economies introduce massive copper requirements for smart grid infrastructure, renewable energy integration, and energy storage systems. These projects typically feature long development timelines but concentrated copper consumption during construction phases, creating potential demand spikes that could overwhelm supply chain capacity.
Renewable energy infrastructure copper intensity metrics reveal another dimension of transition-driven demand. Solar installations, wind farms, and associated transmission infrastructure require substantial copper quantities for electrical connectivity, grounding systems, and power conditioning equipment.
Critical Performance Indicators for Demand Assessment
Monitoring extreme price scenario development requires tracking several key indicators:
- Monthly data centre construction permits and associated electrical infrastructure requirements
- Electric vehicle production capacity announcements from major manufacturers
- Grid modernisation project awards and their specified copper tonnage requirements
- 5G network deployment timelines and infrastructure specifications
- Renewable energy project pipeline development and permitting progress
When big ASX news breaks, our subscribers know first
How Do Supply Chain Vulnerabilities Support Extreme Price Scenarios?
Global copper supply chains exhibit structural vulnerabilities that amplify price volatility risks during periods of heightened demand. These vulnerabilities stem from geographic concentration, extended development timelines, and increasing operational complexity across major producing regions.
In addition, the US–China trade war copper dynamics demonstrate how geopolitical tensions can further constrain supply availability. Consequently, understanding these vulnerabilities becomes crucial for assessing extreme price scenario probability.
Geographic Concentration Risks
Four nations—Chile, Peru, the Democratic Republic of Congo, and Australia—maintain dominant positions in global copper production, collectively controlling significant portions of both current output and proven reserves. This concentration creates systemic vulnerability to regional disruptions, policy changes, and operational challenges that can rapidly affect global supply availability.
Chilean copper production faces ongoing challenges from aging mine infrastructure, declining ore grades, and water availability constraints in the Atacama Desert region. Peruvian operations contend with political instability, community relations challenges, and complex permitting environments that can delay expansion projects or disrupt existing operations.
The Democratic Republic of Congo's copper production occurs within a complex political and regulatory environment where policy changes, infrastructure limitations, and international sanctions concerns create ongoing uncertainty for supply chain planning. Australian operations, while generally more stable, face increasing environmental compliance requirements and community consultation processes that extend project timelines.
Production Deficit Projections and Timeline Analysis
According to Mark Kristoff, CEO of Traxys, copper prices may reach $15,000 per tonne within the next 24 to 36 months, representing a significant premium to current market levels. This timeline suggests that supply-demand imbalances could intensify more rapidly than traditional market adjustment mechanisms can accommodate.
The International Copper Study Group's analytical framework provides structured assessment of potential deficit scenarios, though specific deficit projections require ongoing validation against actual consumption and production data. Market observers note increasing evidence of structural supply constraints that traditional mine expansion cannot address within compressed timeframes.
Mine Development and Expansion Constraints
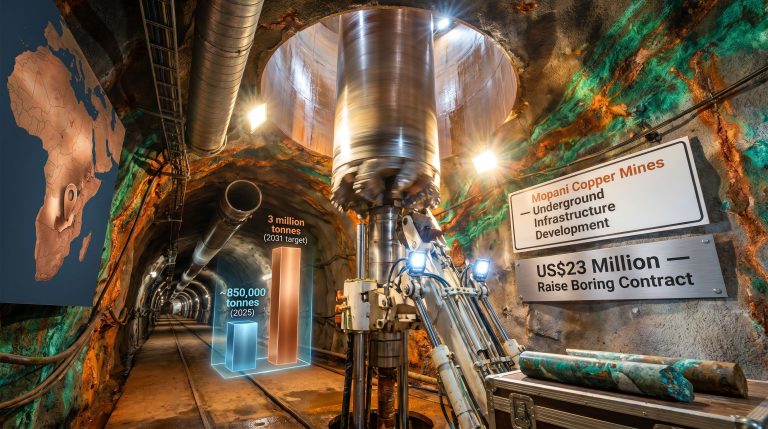
Copper mine development timelines typically span 10-26 years from initial exploration through commercial production, creating fundamental mismatches between demand acceleration and supply response capabilities. Environmental impact assessments, community consultation processes, permitting requirements, and infrastructure development contribute to extended timelines that prevent rapid capacity additions during periods of supply shortage.
Mining project economics face increasing complexity from environmental, social, and governance (ESG) compliance requirements that reduce the number of economically viable projects and increase development costs. These factors particularly affect marginal deposits that might otherwise provide supply flexibility during high-price periods.
What Do Investment Bank Models Reveal About Price Ceilings?
Major financial institutions approach copper price forecasting through sophisticated modelling frameworks that incorporate supply-demand dynamics, macroeconomic variables, and scenario analysis capabilities. These models provide insights into potential price trajectories while highlighting key uncertainty factors.
However, Goldman Sachs forecasts suggest that whilst copper prices may experience significant volatility, they anticipate eventual moderation from peak levels. Nevertheless, the potential for extreme price scenarios remains a critical consideration for market participants.
Consensus Forecast Analysis and Methodology Variations
Investment bank copper price models employ diverse methodological approaches that reflect different analytical priorities and risk assessment frameworks:
| Analytical Framework | Primary Focus | Key Variables | Timeline Horizon |
|---|---|---|---|
| Deficit-Based Modelling | Supply-demand imbalances | Production capacity vs consumption growth | 2-5 years |
| Demand Destruction Analysis | Price sensitivity thresholds | Substitution economics and elasticity | 1-3 years |
| Scenario Planning | Multiple outcome pathways | Policy variables and technology adoption | 5-10 years |
| Macroeconomic Integration | Broader economic cycles | GDP growth, monetary policy, trade flows | 3-7 years |
These modelling approaches produce varying price forecasts based on their underlying assumptions about demand growth, supply response, and market adjustment mechanisms. The divergence between methodologies highlights the inherent uncertainty in extreme price scenario assessment.
Federal Reserve Policy and Monetary Transmission Effects
Federal Reserve monetary policy decisions create complex transmission effects throughout commodity markets via multiple channels. Interest rate adjustments influence:
- Mining project financing costs and investment return thresholds
- Real commodity prices through inflation expectations and dollar strength
- Industrial demand patterns in rate-sensitive sectors such as construction and manufacturing
- Financial market positioning and speculative activity in commodity futures markets
Higher interest rates typically reduce present value calculations for long-term mining projects, potentially constraining future supply additions. Conversely, lower rates can stimulate industrial demand while making commodity investments more attractive relative to fixed-income alternatives.
Currency Dynamics and International Trade Implications
Copper prices denominated in US dollars face significant influence from exchange rate fluctuations that affect both supply and demand dynamics. Dollar strength typically reduces copper affordability for international buyers, potentially dampening demand growth, while dollar weakness can stimulate international purchasing activity.
Major copper-consuming economies maintain diverse currency exposure profiles that create varying price sensitivity based on local exchange rates. Chinese copper demand, representing approximately 50% of global consumption, shows particular sensitivity to yuan-dollar exchange rate movements that can amplify or dampen demand responses to dollar-denominated price changes.
Which Demand Destruction Mechanisms Could Prevent $15,000/t?
Extreme copper price scenarios face natural constraining forces through demand destruction mechanisms that activate at various price thresholds. Understanding these mechanisms provides insight into potential price ceiling dynamics and market adjustment processes, particularly in relation to trade war impact on copper markets.
Industrial Substitution Thresholds and Economic Trade-offs
Aluminium substitution represents the most significant potential demand destruction mechanism, though substitutability varies dramatically across applications. In electrical applications, aluminium offers approximately 61% of copper's conductivity while providing substantial cost advantages at elevated copper prices.
The substitution threshold depends on multiple factors including:
- Engineering specifications and performance requirements for specific applications
- Installation and maintenance costs for alternative materials
- Regulatory approval timelines for substitute materials in critical applications
- Supply chain availability and delivery timelines for alternative materials
Recycling economics become increasingly attractive at elevated price levels, though recycled copper supply faces constraints from scrap collection infrastructure, processing capacity limitations, and quality specifications for high-performance applications.
Economic Recession Probability and Cyclical Demand Patterns
Interest rate sensitivity in copper-intensive sectors creates vulnerability to monetary policy tightening that could trigger demand destruction before prices reach extreme levels. Construction activity, manufacturing investment, and infrastructure development show strong correlation with credit availability and financing costs.
China's infrastructure spending patterns exhibit cyclical characteristics tied to policy stimulus cycles, credit availability, and economic growth targets. Given China's dominant position in global copper consumption, policy shifts toward infrastructure restraint or economic slowdown could significantly impact demand growth projections.
Historical Price Elasticity and Consumer Adaptation
Previous commodity price spikes provide insights into demand destruction patterns and market adjustment timelines. The 2008 copper peak of approximately $8,940 per tonne (in 2008 dollars) triggered various adaptation responses including:
- Design optimisation to reduce copper content per unit in manufacturing applications
- Accelerated substitution research and development programmes
- Temporary demand deferral through inventory management and project delays
- Enhanced recycling activities and scrap collection initiatives
Consumer adaptation strategies during extreme price periods typically follow predictable patterns: initial price absorption, followed by substitution evaluation, design optimisation, and potential demand deferrals or cancellations.
How Do Geopolitical Factors Influence Extreme Copper Pricing?
Geopolitical considerations increasingly influence copper market dynamics through strategic resource policies, trade relationships, and supply chain security initiatives. These factors create additional volatility potential while affecting long-term supply-demand balancing mechanisms.
Moreover, the copper-uranium investment outlook becomes particularly relevant as nations seek to secure strategic mineral supplies. Consequently, understanding these geopolitical dimensions is essential for assessing extreme price scenarios.
Strategic Resource Security and National Policies
The United States has implemented critical mineral initiatives through the Defense Production Act and related legislation that prioritise domestic copper supply chain development. These policies include funding for exploration activities, processing capacity development, and strategic stockpile considerations.
European Union raw materials independence strategies, formalised through the Critical Raw Materials Act, establish copper as a strategic material requiring supply security measures. EU policies emphasise diversified sourcing, domestic processing capabilities, and recycling infrastructure development to reduce import dependencies.
Japan and South Korea maintain active resource diplomacy programmes that secure long-term copper supply agreements through investment partnerships, technical cooperation, and trade financing arrangements with major producing nations.
Supply Chain Control and Trade Policy Implications
China's position in global copper refining—controlling approximately 50% of refined copper production capacity—creates strategic leverage over global supply chains regardless of mine production locations. Chinese processing capacity concentration affects copper availability even when mine production occurs in geographically diverse regions.
Trade policy developments including tariffs, export restrictions, and sanctions create additional complexity for global copper flows. Recent examples include:
- Indonesian export policies affecting copper concentrate availability
- Peruvian political developments influencing mining policy stability
- Democratic Republic of Congo regulatory changes affecting cobalt-copper production
- US-China trade relations impacting processed copper market access
Resource Diplomacy and Investment Patterns
Major consuming nations pursue resource security through foreign direct investment in mining projects, technology partnerships, and long-term supply agreements. These strategies create preferential access arrangements that can affect market availability during supply shortage periods.
Chinese investment in copper mining projects across Africa, South America, and Asia creates integrated supply chains that may prioritise Chinese domestic demand during periods of global shortage. Similar patterns exist with Japanese and South Korean resource investments, though at smaller scales.
What Historical Precedents Support or Refute $15,000/t Scenarios?
Historical commodity price behaviour provides important context for evaluating extreme price scenario plausibility, though structural changes in global economic patterns limit direct comparability with previous cycles.
Previous Commodity Supercycle Analysis and Price Pattern Recognition
The 2008 commodity supercycle peak saw copper reach approximately $8,940 per tonne (LME three-month prices), driven by Chinese infrastructure investment, supply chain disruptions, and financial market speculation. This peak represented roughly a 400% increase from 2003 price levels, demonstrating copper's potential for extreme price movements during periods of structural demand growth.
However, the 2008 peak also illustrated rapid correction mechanisms once demand destruction activated. Copper prices declined approximately 70% over six months as global recession reduced industrial demand and high prices triggered substitution behaviours.
Key lessons from the 2008 experience include:
- Demand destruction occurs rapidly once price thresholds exceed industrial economics
- Financial speculation amplifies both upward and downward price movements
- Supply response timelines remain extended regardless of price signals
- Central bank interventions can dramatically affect commodity market dynamics
Comparative Analysis with Other Commodity Markets
Oil market behaviour during supply crises provides relevant insights for copper price scenario analysis. The 1979-1980 oil crisis demonstrated how supply disruptions combined with strategic stockpiling can drive prices to extreme levels that persist for extended periods before demand destruction mechanisms restore market balance.
Rare earth element price volatility between 2010-2012 illustrates how concentrated production combined with strategic demand can create extreme price scenarios. Rare earth prices increased by over 1000% during peak periods before alternative supply sources and demand destruction restored market stability.
Central Bank and Policy Response Precedents
Historical precedents suggest that extreme commodity price scenarios typically trigger policy responses designed to mitigate economic disruption. These responses can include:
- Strategic reserve releases to increase supply availability
- Monetary policy adjustments to address inflation concerns
- Trade policy modifications to facilitate import access
- Emergency substitution approvals for critical applications
The effectiveness of these responses varies based on the underlying cause of price increases, the availability of alternative supply sources, and the timeline required for market adjustment mechanisms to function.
The next major ASX story will hit our subscribers first
Key Investment Implications for Copper's Price Trajectory
Investment strategies must account for multiple scenarios ranging from continued price appreciation to rapid correction possibilities. The extreme price potential combined with high volatility creates complex risk-return considerations across different investment vehicles and time horizons.
Furthermore, developing effective copper investment strategies requires careful consideration of both upside potential and downside risks. In addition, investors must prepare for various scenario outcomes when positioning for potential copper to hit $15 000/t within three years.
Portfolio Allocation Strategies and Risk Management
Direct copper exposure through exchange-traded products provides pure price exposure but requires careful consideration of storage costs, rollover mechanics, and liquidity characteristics. Physical copper investments face storage and insurance costs that reduce effective returns while providing inflation protection benefits.
Mining equity investments offer leveraged exposure to copper prices but introduce company-specific risks including operational challenges, financial leverage, jurisdictional concerns, and management execution capabilities. Major copper producers typically exhibit 2-4x price sensitivity, meaning equity values may increase or decrease by 200-400% for each 100% change in underlying copper prices.
Currency hedging considerations become particularly important for international copper investments given the dollar-denominated nature of copper pricing and potential exchange rate volatility during periods of extreme price movement.
Timing Strategies and Scenario Planning
Investment timing for extreme price scenarios requires consideration of multiple probability-weighted outcomes rather than single-point forecasts. Scenario-based approaches might include:
Base Case Scenario (70% probability):
- Price range: $10,000-$13,500 per tonne through 2029
- Driven by gradual demand growth and modest supply constraints
- Investment approach: steady accumulation of diversified copper exposure
Bull Case Scenario (25% probability):
- Price range: $13,500-$15,000 per tonne during peak periods
- Triggered by supply disruptions combined with accelerated demand
- Investment approach: increased position sizing with profit-taking strategies
Extreme Case Scenario (5% probability):
- Prices exceeding $15,000 per tonne for sustained periods
- Caused by severe supply disruptions or demand acceleration beyond current projections
- Investment approach: maximum position sizing with careful risk management
Industrial Consumer Risk Management
Companies with significant copper input requirements face strategic decisions regarding price hedging, inventory management, and operational adaptation strategies. Long-term contract structuring becomes critical for managing extreme price volatility while maintaining operational flexibility.
Alternative sourcing strategies may include:
- Vertical integration through mine investment or long-term supply partnerships
- Material substitution research for price risk mitigation
- Geographic diversification of supplier relationships
- Recycling infrastructure development for partial supply security
Inventory management optimisation requires balancing storage costs against price risk exposure, with consideration for working capital requirements and facility capacity constraints.
Conclusion: Probability Assessment of $15,000/t by 2029
The convergence of structural demand transformation, supply chain vulnerabilities, and geopolitical factors creates plausible scenarios for extreme copper price movements within compressed timeframes. While copper to hit $15 000/t within three years represents a significant premium to current levels, multiple precedents exist for rapid commodity price appreciation during periods of supply-demand imbalance.
Critical Monitoring Indicators and Decision Frameworks
Market participants should monitor several key indicators for early warning signals of extreme price scenario development:
- Monthly International Copper Study Group deficit/surplus data and inventory levels
- Artificial intelligence infrastructure deployment rates and associated copper requirements
- Major mine production disruption frequency and duration patterns
- Central bank monetary policy shifts and their transmission to commodity markets
- Electric vehicle production scaling versus planned capacity timelines
Risk Assessment and Investment Preparedness
The extreme price scenario probability matrix suggests that whilst base case outcomes remain most likely, the potential impact of bull and extreme case scenarios justifies careful scenario planning and risk management preparation. Investment strategies should account for asymmetric risk-return profiles where extreme upside potential comes with significant volatility and correction risks.
Market dynamics supporting extreme price scenarios appear more credible than in previous cycles due to structural rather than cyclical demand drivers. However, demand destruction mechanisms, substitution possibilities, and policy intervention capabilities provide natural constraints that limit extreme price sustainability over extended periods.
Disclaimer: This analysis contains forward-looking statements and projections that involve significant uncertainties and risks. Commodity prices are influenced by numerous factors that may not be accurately predicted. Investment decisions should be made based on individual circumstances and risk tolerance, with consideration for professional financial advice. Past performance does not guarantee future results.
Ready to Capitalise on the Next Major Copper Discovery?
Discovery Alert instantly identifies significant ASX copper discoveries using its proprietary Discovery IQ model, transforming complex mineral data into actionable investment insights that could prove crucial as copper markets face potential extreme price scenarios. Understand how major discoveries can generate exceptional returns by exploring Discovery Alert's dedicated discoveries page, showcasing historic examples, then begin your 14-day free trial today to position yourself ahead of potentially volatile market conditions.