August 1, 2026

Industrial metals markets face unprecedented volatility as global economic forces converge to reshape commodity pricing mechanisms. The copper price increase 2026 reflects this complex environment where traditional supply-demand fundamentals interact with sophisticated financial instruments and speculative positioning. Furthermore, the energy transition, coupled with evolving geopolitical tensions and monetary policy divergence across major economies, has created unique market dynamics.
What Economic Forces Are Driving Copper's Historic Bull Run?
Macroeconomic Catalysts Behind the 46% Annual Surge
Currency dynamics have emerged as a primary driver of copper price movements, with the U.S. dollar index reaching multi-month lows during early 2026. This dollar weakness reduces commodity costs for investors operating in non-USD currencies, amplifying demand across international markets. The weekly copper price surge of 3.5% to close at $6.06 per pound reflects this currency-driven momentum, contributing to an accumulated annual increase of 46% with an average price of $5.94 per pound.
Central bank policy divergence across major economies has created arbitrage opportunities in commodity markets. When monetary authorities pursue different interest rate trajectories, capital flows shift toward assets offering superior risk-adjusted returns. Industrial metals benefit from this environment as institutional portfolios seek inflation protection and real asset exposure.
Geopolitical uncertainty has reinforced the attractiveness of physical assets as portfolio hedges. Market participants increasingly view copper as both an industrial input and a store of value during periods of macroeconomic instability. This dual function creates price premiums that extend beyond fundamental supply-demand calculations.
Structural Supply-Demand Imbalances Reshaping Price Discovery
Global refined copper markets face persistent deficits as consumption growth outpaces production expansion. Mine supply constraints limit annual production increases to approximately 1.4%, while demand acceleration from energy infrastructure projects creates sustained pressure on available inventories. Moreover, the global copper supply forecast indicates continued tightness throughout 2026.
Energy transition infrastructure requires substantial copper quantities for grid modernisation, renewable energy installations, and electric vehicle manufacturing. These applications demonstrate minimal price elasticity, meaning demand persists even at elevated commodity prices. Unlike traditional industrial uses where substitution becomes viable at higher costs, energy transition applications often lack technical alternatives to copper's conductivity and durability characteristics.
Data centre proliferation adds another demand layer as cloud computing infrastructure requires extensive copper wiring for power distribution and cooling systems. The expansion of artificial intelligence computing capabilities further amplifies these requirements, creating sustained industrial demand beyond traditional construction and manufacturing sectors.
When big ASX news breaks, our subscribers know first
How Are Supply Chain Disruptions Amplifying Price Volatility?
Critical Production Bottlenecks in Major Copper Regions
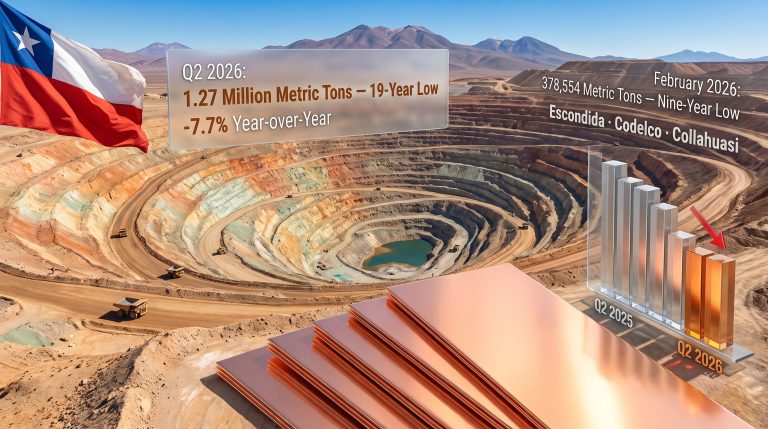
Labour disputes continue affecting Chilean operations, with the Mantoverde mine remaining under strike conditions. This facility produced approximately 95,000 tonnes of cathodes and concentrates during 2025, representing a material portion of global refined copper supply. While agreements at Escondida and Zaldívar operations normalised access, the Mantoverde situation demonstrates how localised disruptions create global price impacts. Additionally, the Morenci mine recovery provides insight into North American production challenges.
Regional Supply Risk Assessment:
| Region | Risk Level | Production Impact | Key Vulnerabilities |
|---|---|---|---|
| Chile | High | 95,000 tonnes affected | Labour disputes, operational access |
| Peru | Medium | Moderate disruptions | Political instability, community relations |
| Indonesia | High | Grasberg resolution pending | Regulatory transitions, infrastructure |
| DRC | Medium | Cobalt co-production issues | Artisanal mining, export logistics |
Supply chain resilience faces additional challenges from infrastructure limitations and regulatory uncertainties. Mining operations require sustained capital investment for expansion, yet permitting delays and environmental reviews extend project timelines. This regulatory complexity creates supply inelasticity that amplifies price volatility when demand surges occur.
Inventory Dynamics and Market Liquidity Constraints
Exchange inventories totalling 929,731 tonnes reflect a 25.2% annual increase, yet market participants perceive tightness in available supplies. This apparent contradiction arises from inventory concentration patterns and regional distribution imbalances. While absolute inventory levels appear adequate, accessible supplies in key consumption regions remain constrained.
Weekly inventory fluctuations indicate underlying market tension despite nominal stock increases. A 2.5% weekly inventory rise coinciding with continued price strength suggests that available copper remains below comfortable operating levels for major industrial consumers. This dynamic creates price volatility as purchasing managers compete for limited spot availability.
Scrap supply responsiveness provides some market flexibility, though recovery rates depend heavily on price levels and collection infrastructure. Historical patterns suggest meaningful scrap increases require sustained price elevation above $5.50 per pound to incentivise collection and processing activities.
What Role Does Speculative Activity Play in Current Valuations?
Asian Financial Markets Driving Price Discovery
Shanghai Futures Exchange activity reached historically elevated levels for January trading periods, amplifying price movements through concentrated speculative positioning. This volume surge coincides with the copper price reaching an intraweek peak of $6.28 per pound, suggesting financial flows significantly influence short-term price action. Notably, New York copper price record levels reflect similar momentum across global exchanges.
However, this financial market dynamism lacks equivalent physical demand recovery. The divergence between speculative enthusiasm and industrial consumption creates valuation questions about price sustainability at current levels. Financial flows respond to expectations and momentum factors that may not align with underlying supply-demand fundamentals.
Chinese import premiums declining to $20-25 per tonne despite international price strength provides concrete evidence of this financial-physical disconnect. Import premiums typically reflect willingness to pay for immediate physical supply, making their decline during a price rally indicative of limited genuine consumption urgency.
Investment Flow Analysis and Market Positioning
Professional investors increasingly view copper through a portfolio diversification lens rather than pure commodity exposure. This perspective creates demand patterns that respond to broader market sentiment and risk appetite rather than specific industrial requirements. Consequently, copper investment strategies must account for these financial market dynamics.
ETF structures allow retail and institutional investors to gain copper exposure without physical storage complications. These investment vehicles can create price momentum that extends beyond fundamental justification, particularly when combined with systematic trend-following strategies employed by quantitative funds.
Options market activity provides additional insight into market expectations and hedging behaviour. High implied volatility levels suggest professional traders anticipate continued price swings, while put-call ratios indicate whether institutional positioning favours upside or downside scenarios.
How Do 2026 Price Forecasts Compare Across Major Investment Banks?
Consensus Price Target Analysis
Major financial institutions project copper prices reaching $11,000-$12,500 per tonne during 2026, reflecting expectations of continued supply-demand imbalances. These forecasts incorporate assumptions about global economic growth, energy transition timelines, and supply response capabilities. Furthermore, analysis from Goldman Sachs suggests that current record high prices may face sustainability challenges.
Investment Bank Copper Price Forecasts for 2026:
| Institution | Average Target ($/tonne) | Peak Projection | Key Assumptions |
|---|---|---|---|
| JP Morgan | $12,075 | $12,500 (Q2) | 330k tonne deficit, 1.4% supply growth |
| Citigroup | $12,000 | $15,000 (bull case) | Persistent shortage scenarios |
| Goldman Sachs | $11,200 (Q4) | $13,000 (Q1) | Scrap supply response, tariff impacts |
| UBS | $11,000 | Not specified | Demand outpacing supply growth |
| Deutsche Bank | >$10,000 | Not specified | China recovery catalyst |
Disclaimer: These price forecasts represent analyst opinions and are subject to significant uncertainty. Actual copper prices may vary substantially from these projections due to unforeseen economic, political, or supply chain developments.
Scenario Modelling and Risk Assessment
Bull case scenarios envision accelerated energy transition timelines creating exponential demand growth that overwhelms supply response capabilities. Under these conditions, prices could reach $15,000 per tonne or higher as industrial consumers compete for limited available copper.
Base case projections assume steady economic growth and gradual supply expansion, supporting prices in the $11,000-$12,000 per tonne range. These scenarios incorporate expected scrap supply increases and modest mine production growth offsetting demand growth.
Bear case risks include demand destruction at elevated price levels, successful substitution efforts in key applications, or economic recession reducing industrial consumption. Such scenarios could drive prices below $9,000 per tonne despite structural supply constraints.
Which Demand Sectors Are Creating Structural Price Support?
Energy Transition Infrastructure Requirements
Electric vehicle manufacturing consumes approximately 475,000 tonnes of copper annually, a figure projected to double by 2030 as adoption accelerates globally. Each electric vehicle requires roughly four times the copper content of conventional internal combustion vehicles, creating exponential demand growth that responds minimally to price increases.
Renewable energy installations demand substantial copper quantities for wind turbine generators, solar panel electrical systems, and grid connection infrastructure. Unlike traditional industrial applications, these uses cannot substitute alternative materials without compromising performance characteristics.
Energy storage systems represent an emerging demand category as grid stabilisation becomes critical for renewable energy integration. Battery installations, particularly utility-scale projects, require extensive copper wiring for power conditioning and distribution equipment.
Technology Sector Consumption Patterns
5G network infrastructure deployment creates sustained copper demand for telecommunications equipment and small cell installations. The densification of wireless networks requires significantly more copper per coverage area compared to previous generation technologies.
Data centre expansion driven by cloud computing and artificial intelligence applications consumes copper through power distribution systems, cooling infrastructure, and server manufacturing. These facilities operate continuously, requiring robust electrical systems that prioritise reliability over cost optimisation.
Semiconductor manufacturing equipment incorporates copper in specialised applications where performance requirements justify premium pricing. As chip production capacity expands globally, this demand category provides price-insensitive consumption growth.
What Are the Key Technical Price Levels to Monitor?
Critical Support and Resistance Analysis
Primary support has established at $5.10 per pound ($11,244 per tonne), representing the level where institutional accumulation historically emerges during price corrections. This support level coincides with the 50-day moving average and previous resistance that converted to support.
Resistance zones appear at $6.20-$7.00 per pound ($13,700-$15,400 per tonne), where profit-taking historically occurs and supply response potentially emerges. Breaking through this resistance range would signal continuation toward higher price targets and potentially trigger additional speculative interest.
Moving average convergence patterns indicate trend strength, with the 20-day average maintaining distance above the 50-day average. This technical configuration typically supports continued upward momentum until convergence signals potential reversal conditions.
Chart Pattern Recognition and Momentum Indicators
Higher highs and higher lows confirm the bullish trend structure remains intact despite periodic volatility. This pattern indicates buying interest emerges during price corrections, supporting the overall upward trajectory.
Relative strength index positioning suggests copper maintains momentum without reaching severely overbought conditions that typically precede major corrections. RSI levels between 60-80 historically support continued price appreciation in commodity bull markets.
Volume analysis reveals institutional accumulation patterns during price strength, contrasting with retail distribution during corrections. This professional buying interest provides underlying support for continued price appreciation.
The next major ASX story will hit our subscribers first
How Might Trade Policy Changes Affect Copper Pricing?
US Tariff Implementation Timeline and Market Impact
A proposed 15% refined copper tariff scheduled for mid-2026 implementation creates short-term stockpiling incentives and long-term supply chain restructuring requirements. Industrial consumers may accelerate purchasing schedules to avoid tariff costs, creating artificial demand spikes preceding implementation dates. The tariff impact on copper stocks demonstrates how policy changes influence market dynamics.
Regional price differentials will emerge as tariff structures create arbitrage opportunities between markets. Domestic U.S. copper prices could trade at persistent premiums to international levels, incentivising increased domestic production and recycling activities.
Supply chain reconfiguration efforts require substantial lead times, meaning immediate market impacts focus on inventory positioning rather than fundamental supply adjustments. Long-term effects depend on whether domestic production capacity can expand sufficiently to replace imports.
Global Trade Flow Restructuring Implications
Alternative supply routes development requires infrastructure investments and relationship building that extend beyond immediate tariff implementation periods. These adjustments create temporary supply tightness as logistics networks adapt to new trade patterns.
Regional processing capacity expansion becomes economically viable when tariff costs exceed processing differentials. This dynamic could reshape global copper refining patterns, potentially creating new supply bottlenecks during transition periods.
Currency hedging strategies become critical for international transactions as trade policy uncertainty creates exchange rate volatility. Companies require sophisticated risk management approaches to maintain profitability amid changing trade cost structures.
What Investment Strategies Are Best Positioned for Copper's Trajectory?
Direct Commodity Exposure Vehicles
Copper futures contracts provide leveraged exposure to price movements with standardised specifications and margin requirements. Standard contracts represent 25,000 pounds of copper, requiring margin deposits typically ranging from $3,000-$8,000 per contract depending on volatility conditions.
Exchange-traded funds offer liquid copper exposure without futures rollover complexity or storage requirements. Major copper ETFs track futures prices or copper mining equity baskets, providing different risk-return profiles for various investment objectives. However, insights from Trading Economics suggest investors should monitor fundamental data alongside technical indicators.
Physical copper investment remains challenging for individual investors due to storage costs and authentication requirements. However, allocated storage programs and copper-backed securities provide alternatives for investors seeking direct metal exposure.
Sector Rotation and Portfolio Allocation Strategies
Mining equity selection requires analysing production costs, reserve quality, geographic diversification, and operational efficiency metrics. Companies with production costs below $3.50 per pound typically generate substantial margins at current price levels.
Market capitalisation considerations affect volatility and liquidity characteristics. Large-cap miners provide stability and dividend income, while small-cap exploration companies offer leveraged exposure to price movements with increased risk.
Geographic diversification across copper-producing regions reduces political and operational risks while maintaining commodity exposure. Balanced portfolios might include Chilean, Peruvian, Australian, and North American mining operations.
How Should Investors Prepare for Potential Price Corrections?
Volatility Management and Risk Mitigation
Historical copper bull markets experience 20-30% corrections during upward trends, requiring position sizing that accommodates significant temporary losses. Professional traders typically limit commodity exposure to 5-10% of total portfolio value to manage volatility impact.
Correlation analysis shows copper prices maintain 0.6-0.8 correlation with equity markets during stress periods, reducing diversification benefits when most needed. Investors should consider this correlation when determining overall portfolio risk exposure.
Options strategies including protective puts or covered calls can provide downside protection or income generation during consolidation periods. However, options premiums increase during high volatility periods, affecting strategy cost-effectiveness.
Market Timing Considerations and Entry Strategies
Dollar-cost averaging approaches reduce timing risk for long-term copper exposure by spreading purchases across multiple price levels. This strategy works particularly well for ETF investments where transaction costs remain minimal.
Technical indicator monitoring including RSI divergences, moving average crossovers, and volume patterns can signal potential entry points for tactical position adjustments. However, commodity markets often remain in trending modes longer than technical indicators suggest.
Seasonal patterns historically show copper strength during spring months as construction activity increases in northern hemisphere markets. While these patterns lack reliability, they provide context for timing investment decisions.
Strategic Positioning for Copper's 2026 Outlook
Key Investment Thesis Summary
The copper price increase 2026 scenario reflects converging factors including supply constraints, energy transition demand, and speculative positioning amplified by dollar weakness and geopolitical uncertainty. With production bottlenecks affecting approximately 95,000 tonnes from Chilean operations alone, and inventory levels despite 25.2% growth remaining tight outside the United States, fundamental support for elevated pricing appears robust.
Financial market dynamics, particularly the divergence between Shanghai Futures Exchange volume increases and declining Chinese import premiums, suggest that speculative activity significantly influences current valuations. This creates both opportunity and risk as prices may disconnect from underlying industrial demand patterns.
Risk-Adjusted Return Expectations
Investment strategies should balance copper's structural demand drivers against volatility from concentrated speculative positioning and potential trade policy disruptions. The proposed 15% U.S. tariff on refined copper adds policy uncertainty that could create both short-term price spikes and long-term supply chain restructuring opportunities.
Disclaimer: Copper market analysis involves substantial uncertainty due to volatile economic conditions, changing trade policies, and unpredictable supply disruptions. These projections should not be considered investment advice, and actual results may differ materially from forecasts presented. Investors should conduct independent research and consult qualified financial advisors before making investment decisions.
Professional allocation should emphasise diversification across exposure methods, including direct futures positions, mining equity selections, and ETF vehicles, while maintaining flexibility for tactical adjustments as fundamental and technical conditions evolve throughout 2026.
Ready to Position Yourself Ahead of Copper's Next Major Move?
Discovery Alert's proprietary Discovery IQ model delivers real-time alerts on significant ASX mineral discoveries, instantly empowering subscribers to identify actionable copper and mining opportunities ahead of the broader market. Begin your 14-day free trial today and secure your market-leading advantage in this volatile commodity environment.

