July 23, 2026
Copper Price Near Record High: What the 2026 Rally Is Really Telling Investors
Every major commodity bull market in history has been shaped by the same underlying tension: the world wants more of something than the ground can immediately provide. In copper's case, that tension has been building for years across multiple demand vectors simultaneously. By May 2026, it has pushed the copper price near record high territory, within striking distance of prices that would have seemed extraordinary just eighteen months ago. Understanding why requires looking beyond the headlines and into the structural mechanics of a market that increasingly reflects the physical realities of a decarbonising, digitising global economy.
When big ASX news breaks, our subscribers know first
Where Copper Prices Stand as of May 2026
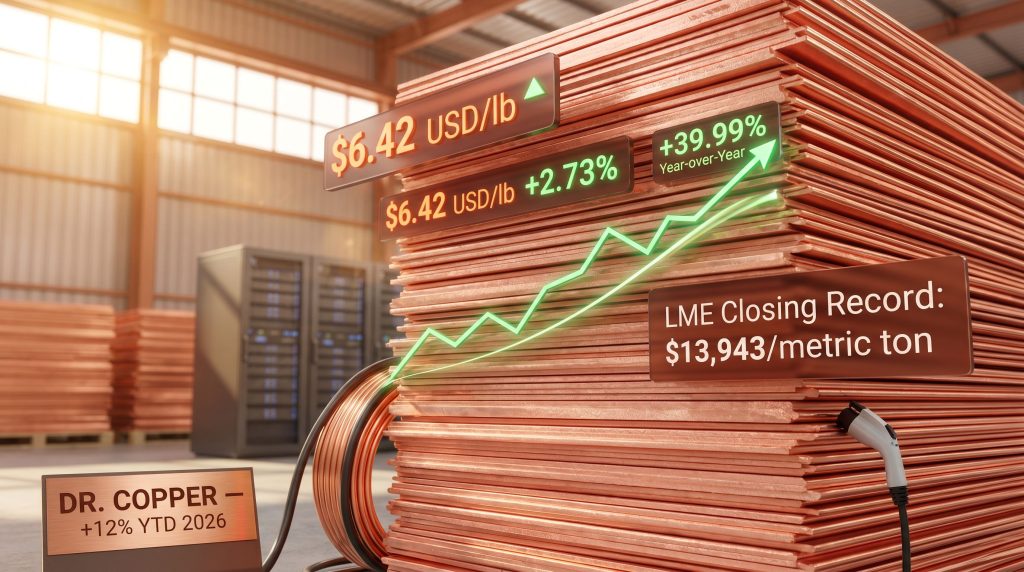
The copper price near record high territory is no longer a speculative thesis but a measurable market reality. On May 11, 2026, LME copper settled at $13,943 per metric ton, surpassing the previous closing record of $13,618 per metric ton set on January 29, 2026. The single-session gain of 2.7% represented the largest daily move in more than a month, arriving despite an active geopolitical flashpoint in the Middle East that had rattled broader commodity markets earlier in the year.
On the COMEX, where copper is quoted in US dollars per pound, the metal has been trading near $6.42/lb, approaching the exchange's all-time intraday high of $6.61/lb. The gap between current prices and that record stands at roughly 3%, a margin that market participants increasingly view as a matter of timing rather than probability.
| Metric | Value |
|---|---|
| LME Closing Price (May 11, 2026) | $13,943 / metric ton |
| Previous LME Closing Record | $13,618 / metric ton (January 29, 2026) |
| COMEX Spot Price | ~$6.42 USD/lb |
| COMEX All-Time High | $6.61 USD/lb |
| LME All-Time High | $14,527.50 / metric ton |
| 2026 Year-to-Date Performance | +12% |
The week preceding May 11 saw the LME's combined base metals price gauge close at an all-time high, meaning copper's surge is not occurring in isolation. Zinc, aluminium, nickel, and other industrial metals have all posted meaningful gains in 2026, confirming that the bullish thesis extends across the broader complex rather than representing a single-commodity anomaly.
Three Structural Forces Pushing Copper Toward Historic Highs
Copper's 2026 rally stands apart from previous bull markets because it is being driven by at least three independent demand accelerants operating simultaneously, while supply-side responses remain constrained by factors that cannot be resolved quickly. Furthermore, the copper supply crunch continues to intensify across multiple fronts, adding further urgency to these structural dynamics.
The Clean Technology Export Boom
China's export machine has shifted decisively toward copper-intensive clean technology products. In April 2026, China's overall export volume rose 14% year-over-year, with a significant share of that growth concentrated in electric vehicles, solar panels, grid equipment, and battery storage systems. Each of these product categories carries substantially higher copper content per unit than the manufactured goods that historically dominated Chinese export flows.
Consider the copper intensity of key clean energy technologies:
- A battery electric vehicle contains three to four times more copper than a conventional internal combustion engine vehicle
- Offshore wind installations require an estimated 8,000 kg of copper per MW of installed capacity
- Grid-scale battery storage systems, solar inverters, and high-voltage transmission infrastructure all depend heavily on refined copper for conductivity and thermal management
The implication is significant: as clean technology production scales globally, each additional unit of output adds a disproportionately large copper demand increment relative to the industrial base it is replacing. In addition, energy transition demand is accelerating these consumption patterns well beyond traditional forecasting models.
Artificial Intelligence Infrastructure: A Demand Driver Without Historical Precedent
Previous copper bull markets had no equivalent to the AI infrastructure buildout now underway. Data centres, which serve as the physical foundation for large-scale AI model training and deployment, require substantial copper in their power distribution systems, liquid cooling loops, and high-density cabling architectures. As hyperscale technology firms race to expand capacity, their procurement needs are creating forward demand commitments that provide visibility into copper consumption well beyond current spot market transactions.
This represents a structural demand increment that was entirely absent from commodity pricing models used in the 2011 or 2022 copper cycles. Analysts modelling the current rally who rely exclusively on historical demand elasticities risk underestimating how much incremental consumption AI infrastructure alone could absorb over the next decade.
Supply Tightness: Scrap Markets, Inventory Depletion, and the Financing Crackdown
On the supply side, the picture is defined by compounding constraints rather than a single bottleneck. Global warehouse inventory levels across LME and COMEX-registered facilities remain critically low, with buyer withdrawal requests outpacing replenishment. Declining copper inventories held within Chinese warehouses have been specifically identified by market participants as a key price signal, given China's role as the world's dominant copper consumer.
A regulatory crackdown in China on metals-backed financing has created an additional and less widely understood supply disruption. In this financing structure, physical copper serves as collateral for short-term credit facilities. When regulators moved against this practice, it triggered forced selling and inventory dislocation, but it also constrained the flow of scrap copper into the refined market.
The result has been a narrowing of the traditional discount between scrap copper prices and refined copper prices, a spread that commodity traders monitor closely as an indicator of genuine physical tightness. Consequently, the global copper supply gap is widening in ways that headline production statistics alone do not fully capture.
When the scrap-to-refined copper spread narrows sharply, it signals that buyers have exhausted cheaper secondary supply options and are being forced into the more expensive primary market. This is one of the clearest forward indicators of sustained price pressure in the copper complex.
The structural gap between mine supply growth and demand growth cannot be closed quickly. New copper deposits take 7 to 15 years from discovery through permitting, construction, and ramp-up to first production. This long lead time means that even a significant increase in exploration investment today would not deliver meaningful supply relief until the early 2030s.
Geopolitical Risk and the Remarkable Resilience of the Copper Price
The US-Iran conflict and the closure of the Strait of Hormuz created genuine uncertainty across commodity markets in the opening weeks of 2026. Industrial metals including copper experienced sharp price dislocations during that initial period as investors priced in tail-risk scenarios. What has emerged since is arguably more important than the initial shock: copper has demonstrated a consistent capacity to recover and advance through ongoing geopolitical uncertainty.
On May 11, 2026, despite US President Donald Trump publicly rejecting Iran's latest peace proposal as entirely unacceptable, copper prices rose sharply alongside stabilising equity markets. The decoupling of copper from day-to-day conflict escalation signals has been noted explicitly by market practitioners.
Jia Zheng, trading manager at Suzhou Chuangyuan Harmony-Win Capital Management Co., observed that the market had moved past the influence of the US-Iran conflict and that copper was now operating according to its own distinct price dynamics, primarily anchored in supply tightness and declining Chinese inventories (Bloomberg News, May 11, 2026).
How the Strait of Hormuz Closure Affects Different Metals
Not all industrial metals respond to Middle East disruptions in the same way. The Hormuz closure creates differential impacts depending on each metal's exposure to Gulf-region supply chains.
| Metal | Hormuz Exposure | 2026 Price Behaviour |
|---|---|---|
| Copper | Indirect (logistics, energy costs) | Rising to closing records |
| Aluminum | High (Gulf smelters reliant on regional energy) | Underperforms on de-escalation days |
| Nickel | Moderate (sulfur supply dependency from the region) | Gained approximately 1.9% alongside copper |
| Zinc | Moderate | Broadly positive with LME index |
| Silver | Elevated investment and industrial demand | +7.47% in a recent session |
| Gold | Safe-haven flows | +3.84% in a recent session |
Morgan Stanley analysts led by Amy Gower highlighted that aluminium's tendency to underperform on conflict de-escalation days may represent a buying opportunity, given the extended timeframe required to restart idled smelters. The bank further noted that a prolonged Strait of Hormuz closure could deliver additional support to LME aluminium prices or regional premiums if Middle East curtailments deepen (Bloomberg News, May 11, 2026).
Citigroup analysts have separately argued that energy transition demand and defence-sector metals consumption provide a structural buffer for copper even in a worst-case scenario involving an extended Hormuz closure (Bloomberg News, May 11, 2026).
China's Dual Role as Demand Anchor and Supply Disruptor
China's position in the global copper market is unique in that it simultaneously amplifies both demand pressure and supply constraints. The country accounts for approximately 55 to 60% of global refined copper demand, meaning that domestic inventory trends in China function as a leading indicator for global price formation.
The combination of accelerating clean-tech export growth, declining warehouse inventories, and the scrap financing regulatory disruption means China is currently applying pressure from both sides of the supply-demand equation. Buyers globally are competing for a physical market that is tighter than headline mine production figures suggest, because secondary supply through the scrap channel has been partially disrupted.
This is a dynamic that receives relatively limited attention in mainstream commodity coverage but carries significant implications for price forecasting. Models that treat Chinese copper consumption as a single demand variable without accounting for the secondary supply dimension risk generating overly optimistic price trajectories.
What Institutional Forecasts Say About Copper's Price Ceiling
The structural case for copper is compelling; however, institutional analysts have introduced important caveats about the sustainability of current price levels. Understanding the key copper price drivers is therefore essential for any investor seeking to navigate the current environment with confidence.
Goldman Sachs Research has estimated copper's fair value at approximately $11,500 per metric ton, implying a meaningful premium of roughly 21% embedded in current prices above $13,900/metric ton. The bank's Q4 2026 forecast of $11,200 per metric ton suggests a potential price moderation of approximately 20% from May 2026 levels, though structural demand factors could delay the timing and reduce the magnitude of any correction.
Commerzbank has flagged a self-limiting mechanism already at work: record-high prices are beginning to suppress demand from price-sensitive industrial buyers and to encourage substitution, particularly in applications where aluminium or fibre optics can replace copper at an acceptable technical trade-off.
| Institution | Fair Value Estimate | Q4 2026 Forecast |
|---|---|---|
| Goldman Sachs Research | ~$11,500 / metric ton | $11,200 / metric ton |
| Commerzbank | Not specified | Cautions on demand destruction at record levels |
Factors That Could Accelerate a Price Correction
- A diplomatic resolution to the US-Iran conflict that normalises Strait of Hormuz shipping
- Demand destruction from sustained high prices in price-sensitive manufacturing sectors
- A slower-than-expected progression of AI infrastructure capital expenditure
- Easing of Chinese scrap financing regulations, restoring secondary supply flow
Factors That Could Drive Copper to New All-Time Highs
- A prolonged Hormuz closure that compounds supply chain disruption across multiple industrial metals
- An AI infrastructure buildout that materially exceeds current demand projections
- Continued depletion of LME and COMEX registered warehouse inventories without corresponding supply response
- Tighter Chinese regulatory enforcement reducing secondary copper availability further
The next major ASX story will hit our subscribers first
The "Dr. Copper" Signal in a New Economic Context
Copper earned the informal title of "Dr. Copper" through its historical accuracy as a leading indicator of global industrial activity. The metal's pervasive use across construction, power generation, transportation, manufacturing, and consumer electronics made its price a reliable proxy for the health of the broader economy. When copper rose, economic expansion typically followed.
The 2026 rally raises an interesting interpretive question: is the current copper price near record high signal reading genuine economic acceleration, or is it capturing a structural transition that operates somewhat independently of the traditional economic cycle? The answer is likely both, with a heavier weighting toward structural transition.
The demand for copper in energy transition infrastructure and AI deployment does not follow the same cyclical rhythm as housing construction or consumer electronics manufacturing. It is driven by long-duration capital investment decisions made by governments, utilities, and technology companies with ten-to-twenty-year horizons. For those considering exposure, exploring copper investment strategies suited to a multi-decade structural shift may prove more valuable than relying on traditional cyclical timing models.
This means the traditional "Dr. Copper" framework may need updating. Copper's 2026 price behaviour reflects not just near-term economic conditions but a multi-decade rewiring of global energy and data infrastructure, a signal whose full implications extend well beyond the current commodity cycle.
Key Data Points at a Glance
- Copper settled at a fresh LME closing record of $13,943 per metric ton on May 11, 2026, up 2.7% in a single session
- Year-to-date performance stands at +12% with the 2026 rally substantially outpacing the March 2025 benchmark
- China's April 2026 export growth of 14% year-over-year reflects the clean-tech manufacturing surge underpinning copper demand
- The LME combined base metals index recorded an all-time high in the week preceding May 11, 2026, confirming broad industrial metals strength
- Goldman Sachs' Q4 2026 target of $11,200 per metric ton implies potential price moderation, though structural supply constraints complicate the timeline
- Copper remains within approximately 3% of its COMEX all-time intraday high, with the LME having already registered a new closing record
This article is for informational purposes only and does not constitute financial advice. Commodity markets carry significant volatility and risk. Price forecasts referenced from institutional analysts represent their views at the time of publication and are subject to revision. Past performance of commodity prices is not indicative of future results. Readers should seek independent financial advice before making any investment decisions.
Want to Capitalise on the Next Major Copper Discovery Before the Market Does?
Discovery Alert's proprietary Discovery IQ model scans ASX announcements in real time, instantly identifying significant mineral discoveries — including copper — and translating complex data into actionable investment insights for traders and long-term investors alike. Explore how historic mineral discoveries have generated substantial returns or start your 14-day free trial today to position yourself ahead of the next major find.