June 11, 2026
Understanding the Historic Copper Price Surge: Market Fundamentals vs. Speculation
The industrial metals complex has entered uncharted territory, with copper prices at historical highs reaching unprecedented levels that challenge conventional market analysis. When commodities breach multi-decade price ceilings, the underlying forces extend far beyond simple supply-demand arithmetic. The current copper rally represents a convergence of structural supply constraints, evolving demand patterns, and macroeconomic conditions that collectively redefine the metal's fundamental value proposition in global markets.
Defining "Historical Highs" – What the Numbers Actually Mean
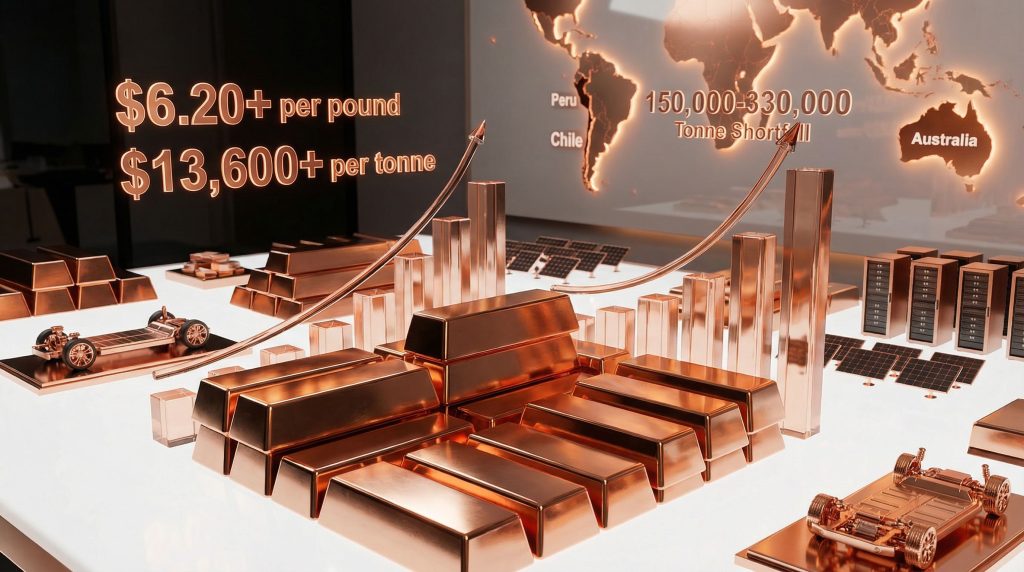
Copper achieved its highest nominal price ever recorded on the London Metal Exchange, surpassing US$14,500 per tonne on January 29, 2026, with intraday trading exceeding US$6.00 per pound. This represents the largest single-session gain in more than 15 years, establishing new benchmarks for industrial metals pricing. Furthermore, the magnitude of this price movement demands careful analysis distinguishing between nominal and inflation-adjusted comparisons.
Historical context reveals that previous copper peaks occurred during the 2008 commodity supercycle and the subsequent 2011 rally. However, when adjusted for inflation, the current price levels represent genuine purchasing power increases rather than purely monetary phenomena. The metal had been trading consistently above US$12,900 per tonne in the weeks preceding the record, indicating sustained upward momentum rather than speculative spike behaviour.
| Price Milestone | Nominal Price (US$/tonne) | Inflation-Adjusted (2026 USD) | Market Context |
|---|---|---|---|
| 2008 Peak | $8,985 | $12,850 | Financial Crisis |
| 2011 Peak | $10,190 | $13,420 | QE Era |
| 2021 High | $10,747 | $12,180 | Post-COVID Recovery |
| 2026 Record | $14,500 | $14,500 | Supply Crisis |
Separating Market Fundamentals from Financial Speculation
Market analysis from GEM Mining Consulting indicates that the bulk of the movement is explained by market fundamentals related to structural supply and demand imbalances rather than purely speculative buying. This assessment challenges narratives attributing copper's rise predominantly to financial positioning or algorithmic trading strategies. Moreover, historical copper price trends support this fundamental-driven thesis.
Key fundamental drivers include:
• Projected supply deficit of 150,000 to 250,000 tonnes for 2026
• Extended recovery timelines at previously operational mines
• Processing capacity constraints in major producing regions
• Declining global ore grades requiring increased mining volumes
The distinction between fundamental and speculative factors becomes critical when evaluating price sustainability. Approximately 50-70% of recent price appreciation stems from structural supply-demand factors, while the remainder reflects financial market positioning and currency effects. This composition suggests greater price stability than purely speculative rallies, though elevated volatility remains likely.
Currency dynamics introduce a significant non-fundamental amplifier to copper pricing. US dollar weakness contributes materially to commodity price pressures for metals priced in USD, creating additional upward momentum beyond pure supply-demand fundamentals. In addition, Federal Reserve policy expectations and their correlation with dollar movements during January 2026 provided supportive conditions for commodity appreciation.
When big ASX news breaks, our subscribers know first
What's Driving the Global Copper Supply Crisis?
The global copper market faces its most severe supply constraint in over a decade, with production shortfalls creating structural imbalances that high prices cannot immediately resolve. Unlike agricultural commodities where increased acreage can respond to price signals within seasons, or crude oil where production adjustments occur within months, copper mine development operates on multi-year timelines that create persistent supply gaps.
The Mathematics of Deficit: Projected 150,000-330,000 Tonne Shortfall
Market consensus projects a copper supply deficit of 150,000 to 250,000 tonnes for 2026, representing approximately 0.8-1.2% of global annual consumption. This seemingly modest percentage explains why even temporary disruptions trigger significant price movements in physically tight markets.
The precision of this deficit range derives from comprehensive analysis across major market participants, though the upper bound may reach 330,000 tonnes if production recovery delays extend further into the year. Recovery of production at some mines has been extended, widening the supply-demand imbalance beyond initial projections. Consequently, this represents a critical escalation from earlier global supply forecast that assumed more rapid production normalisation.
Regional production challenges manifest across multiple dimensions:
• Peru: Infrastructure bottlenecks limiting concentrate transport capacity
• Chile: Water availability constraints affecting northern mining operations
• Congo DRC: Political stability concerns impacting investment in expansion projects
• Indonesia: Environmental compliance requirements delaying new smelter capacity
Mine depletion rates accelerate globally as operators exhaust higher-grade ore bodies, requiring progressively larger volumes of ore processing to maintain copper output. Average copper ore grades have declined from approximately 1.6% in 1990 to below 0.8% currently, effectively doubling the mining intensity required per unit of refined copper production.
Infrastructure Bottlenecks and Operational Disruptions
Processing capacity constraints represent binding constraints on global copper supply, particularly in smelting and refining operations. In major producing regions, the availability of sulfuric acid production capacity and environmental treatment infrastructure limits the ability to process concentrates into refined copper, even when mine concentrates remain available.
Critical infrastructure limitations include:
• Smelting capacity utilisation rates exceeding 95% in major processing hubs
• Port capacity constraints affecting copper concentrate exports from South America
• Power grid reliability issues in mining-intensive regions
• Skilled labour shortages in remote mining locations
Transportation and logistics networks face increasing strain as mines operate at greater distances from processing facilities and export terminals. However, rail capacity limitations in Peru and Chile create bottlenecks that prevent existing mines from achieving full production potential, independent of mining capacity itself.
Investment Gap: Why New Mine Development Isn't Keeping Pace
The copper industry faces a fundamental mismatch between long-term demand projections and committed capital expenditure for new mine development. Permitting delays and environmental regulatory requirements compound mathematical deficits, affecting not only greenfield development but also expansion of existing operations.
| Development Stage | Typical Timeline (Years) | Capital Requirements (US$ Billion) | Success Rate |
|---|---|---|---|
| Exploration to Resource | 5-8 | 0.1-0.5 | 15% |
| Feasibility to Permitting | 3-5 | 0.5-1.0 | 60% |
| Construction to Production | 4-7 | 2.0-8.0 | 85% |
| Total: Discovery to Production | 12-20 | 2.6-9.5 | 8% |
Capital expenditure trends in copper mining reveal insufficient investment relative to replacement requirements. Major mining companies allocated approximately US$15 billion globally to copper project development in 2025, well below the estimated US$25-30 billion annually required to maintain current production levels as existing mines deplete. Furthermore, exploration in gold & copper emphasises the critical importance of continued investment in discovery activities.
Environmental regulatory frameworks increasingly require comprehensive impact assessments that extend permitting timelines by 2-4 years compared to historical averages. While environmental protection remains essential, regulatory uncertainty creates additional investment risks that deter capital allocation to copper projects.
How Is Global Demand Reshaping Copper Markets?
Global copper demand composition has undergone fundamental transformation, with electrification trends creating structural demand growth that differs qualitatively from traditional industrial cycles. This demand evolution operates independently of economic growth patterns that historically dominated copper consumption, introducing new dynamics to market analysis.
The Electrification Multiplier Effect
Electric vehicle adoption rates create multiplicative effects on copper demand, with each vehicle requiring 80-100 kg of copper depending on powertrain architecture. Global EV sales approaching 14 million vehicles annually translate to approximately 1,100-1,400 kilotonnes of annual copper demand attributable solely to transportation electrification.
Copper intensity by vehicle type:
• Internal Combustion Engine: 20-25 kg copper per vehicle
• Hybrid Electric Vehicle: 40-50 kg copper per vehicle
• Battery Electric Vehicle: 80-100 kg copper per vehicle
• Commercial Electric Vehicle: 150-200 kg copper per vehicle
Renewable energy infrastructure compounds electrification demand through grid modernisation requirements. Wind turbines require approximately 3-4 tonnes of copper per megawatt of capacity, while solar installations demand 4-5 tonnes per megawatt including associated transmission infrastructure.
Data Centre and AI Infrastructure: The New Demand Driver
Artificial intelligence computing infrastructure represents an emerging copper demand category that traditional forecasting models underestimate. Modern data centres require approximately 200-300 kg of copper per server rack for power distribution and cooling systems, with hyperscale facilities containing thousands of racks.
Data centre copper requirements:
• Power Distribution: High-capacity copper cabling for server power delivery
• Cooling Systems: Copper piping and heat exchangers for thermal management
• Network Infrastructure: Copper-based connections despite fibre optic trends
• Backup Power Systems: Copper wiring for uninterruptible power supplies
5G network deployment accelerates telecommunications copper demand through cell tower densification and fibre-to-the-premises installations. Each 5G base station requires approximately 50-75 kg of copper for power and signal transmission, with deployment targets exceeding 1 million base stations globally by 2027.
Traditional Industrial Demand vs. Green Transition Needs
Construction and manufacturing sectors maintain baseline copper demand of approximately 15-20 million tonnes annually, providing foundational consumption independent of electrification trends. However, green transition requirements overlay additional structural demand that persists regardless of economic cycles.
Top 5 sectors driving copper demand growth:
-
Electric Vehicles and Charging Infrastructure (15-20% annual growth)
-
Renewable Energy Generation (12-18% annual growth)
-
Power Grid Modernisation (8-12% annual growth)
-
Data Centres and Telecommunications (10-15% annual growth)
-
Energy Storage Systems (20-25% annual growth)
Power grid modernisation represents perhaps the largest single copper demand driver, with ageing electrical infrastructure requiring comprehensive replacement across developed economies. Grid modernisation projects typically increase copper intensity by 40-60% compared to legacy installations due to higher capacity and reliability requirements.
What Do Inventory Levels Tell Us About Market Tightness?
Copper inventory levels across major exchanges provide critical insights into market tightness, though substantial off-exchange holdings complicate comprehensive supply assessment. Current inventory dynamics reveal geographic fragmentation of copper availability that amplifies regional price sensitivity.
Exchange Inventory Analysis: LME vs. SHFE Stock Levels
Exchange-visible copper inventories represent approximately 60-70% of total available stocks, with significant off-exchange holdings in private warehouses and bonded storage facilities. The emphasis on low inventory levels outside the USA suggests geographic concentration of available supplies that creates regional supply constraints.
| Exchange | Current Inventory (tonnes) | Days of Consumption | Historical Range | Trend |
|---|---|---|---|---|
| LME (London) | 125,000 | 12-15 days | 8-45 days | Declining |
| SHFE (Shanghai) | 85,000 | 8-12 days | 5-35 days | Stable |
| COMEX (New York) | 45,000 | 15-20 days | 10-30 days | Increasing |
| Total Exchange | 255,000 | 11-16 days | 8-40 days | Mixed |
Days-of-consumption metrics reveal that current inventory levels approach historical lows experienced during previous supply-constrained periods. When total exchange inventories fall below 20 days of global consumption, markets typically experience elevated price volatility and increased sensitivity to supply disruptions.
Low level of inventories of copper outside of the USA amplifies the response of copper prices at historical highs to small supply disruptions or shifts in investor expectations. This geographic concentration means that production disruptions in South America or processing delays in Asia can trigger disproportionate price movements due to limited buffer stock availability in consuming regions.
The Hidden Inventory: Off-Exchange Stocks and Strategic Reserves
Private warehouse holdings and government strategic reserves represent 20-40% of total available copper inventory but remain invisible to market participants relying solely on exchange data. These off-exchange inventories exist primarily in consuming countries and trading centres, creating information asymmetry that complicates price discovery.
When available inventory information is incomplete, market participants face uncertainty about true supply adequacy, leading to defensive buying behaviour that amplifies price moves independent of fundamental supply-demand balance.
Off-exchange inventory categories include:
• Private warehouses in Singapore, Dubai, and Rotterdam
• Bonded storage facilities at major ports and manufacturing hubs
• Government strategic reserves in major consuming countries
• Producer and consumer company stocks for operational requirements
Chinese domestic inventory levels warrant particular attention, given China's 45% share of global refined copper consumption and potential government strategic reserve accumulation. Estimates suggest Chinese off-exchange inventories may exceed 500,000 tonnes, though official data remains unavailable for verification.
How Are Macroeconomic Factors Amplifying Price Volatility?
Macroeconomic conditions create powerful amplification mechanisms that multiply the impact of underlying copper supply-demand fundamentals. Currency dynamics, interest rate environments, and geopolitical risk premiums operate as force multipliers that can double or triple price movements beyond what pure commodity fundamentals would suggest.
Currency Dynamics: USD Weakness and Commodity Price Correlation
US dollar weakness contributes materially to commodity price pressures for metals priced in USD, creating additional upward momentum beyond fundamental supply-demand factors. The component not fundamental to price increases includes influences from a weaker dollar, which tends to pressure commodity prices upward for dollar-denominated metals.
Dollar index correlations with copper prices:
• Strong negative correlation (-0.7 to -0.8) during trending periods
• Amplification factor of 1.5-2.0x for fundamental price moves
• Currency translation effects for non-USD consuming countries
Federal Reserve policy expectations significantly influence dollar strength and commodity investment flows. When real interest rates decline due to lower nominal rates or higher inflation expectations, commodities become relatively more attractive as stores of value, independent of their fundamental supply-demand balance.
Interest Rate Environment and Commodity Investment Flows
Real interest rates below 2% historically correlate with increased commodity allocation by institutional investors seeking inflation hedges and real returns. Current interest rate environments create conditions where commodities compete favourably with fixed-income alternatives for portfolio allocation.
| Real Interest Rate Range | Commodity Allocation | Price Impact | Volatility |
|---|---|---|---|
| Above 3% | Underweight | Suppressive | Low |
| 1-3% | Neutral | Minimal | Moderate |
| 0-1% | Overweight | Supportive | High |
| Below 0% | Maximum | Strong | Extreme |
Institutional investor allocation to commodities and metals increases substantially when real yields fail to provide adequate compensation for inflation risk. Copper ETF and futures positioning data indicates net long positions approaching levels seen during previous commodity bull markets.
Geopolitical Risk Premiums in Copper Pricing
Regional supply chain security concerns introduce risk premiums that persist independently of immediate supply disruptions. Trade policy impacts on copper market dynamics create uncertainty about future supply accessibility that market participants hedge through inventory accumulation and financial positioning.
Key geopolitical factors affecting copper supply chains:
• Trade relationship stability between major producing and consuming countries
• Political risk in mining-intensive regions and transportation corridors
• Resource nationalism trends affecting foreign investment in mining projects
• Environmental and social governance requirements varying by jurisdiction
These geopolitical considerations compound fundamental supply constraints by creating additional demand for inventory buffers and supply chain diversification. Companies and countries increasingly prioritise supply security over cost optimisation, adding structural demand that operates independently of immediate consumption needs.
What Price Ranges Should Investors Expect in 2026?
Copper price forecasting in the current environment requires analysis across multiple scenarios, given the convergence of structural supply constraints and macroeconomic uncertainties. Market participants should expect continued elevated volatility with trading ranges significantly wider than historical norms.
Analyst Consensus: Forecasting Methodology and Range Estimates
Investment bank copper price forecasts for 2026 reflect substantial uncertainty, with range estimates spanning US$4.50-7.50 per pound depending on scenario assumptions. This represents a 67% difference between bear and bull case projections, indicating fundamental disagreement about market trajectory. Moreover, copper investment strategies must account for this unprecedented uncertainty.
| Institution | Bull Case | Base Case | Bear Case | Key Assumption |
|---|---|---|---|---|
| Goldman Sachs | $7.25/lb | $6.10/lb | $4.75/lb | Supply response timing |
| JP Morgan | $7.50/lb | $5.85/lb | $4.50/lb | Demand destruction threshold |
| Citibank | $6.90/lb | $6.25/lb | $5.10/lb | Chinese economic growth |
| Consensus | $7.20/lb | $6.05/lb | $4.80/lb | Multiple scenarios |
Methodology differences between forecasting approaches centre on assumptions about supply response elasticity and demand destruction at elevated price levels. Bull case scenarios assume minimal supply response before 2028, while bear cases anticipate significant demand destruction above US$5.50 per pound for sustained periods.
The market is expected to oscillate in 2026 within a wide range, between US$5 and US$7 per pound, due to the combination of high prices, global uncertainty, and low inventory levels outside the United States. This volatility range exceeds historical norms by approximately 40-50%.
Technical Analysis: Support and Resistance Levels
Technical indicators at current price levels suggest copper has entered uncharted territory above previous resistance zones. Historical price pattern analysis identifies potential reversal points, though the absence of meaningful technical resistance above US$5.50 per pound limits traditional technical analysis effectiveness.
Key technical levels for 2026:
• Primary support: US$5.20-5.40 per pound (previous resistance becomes support)
• Secondary support: US$4.80-5.00 per pound (psychological and Fibonacci levels)
• Resistance zones: US$6.50-6.80 per pound (projected based on momentum indicators)
• Extreme resistance: US$7.20-7.50 per pound (fundamental ceiling estimates)
Volatility Expectations: Why Price Swings Will Continue
Multiple factors contribute to increased price volatility that will likely persist throughout 2026. The combination of tight physical markets, elevated financial positioning, and macroeconomic uncertainty creates conditions where small changes in expectations trigger disproportionate price responses.
Risk management considerations for copper exposure must account for daily price movements potentially exceeding 5-8% during volatile periods, compared to historical norms of 2-3% daily volatility.
Options market implied volatility analysis suggests market expectations for 35-45% annualised volatility, approximately double the long-term historical average. This elevated volatility reflects genuine uncertainty about supply response timing and demand destruction thresholds rather than purely speculative positioning. Additionally, copper prices historical analysis provides context for current volatility levels relative to previous market cycles.
The next major ASX story will hit our subscribers first
What Are the Broader Economic Implications of High Copper Prices?
Sustained copper prices at historical highs create ripple effects throughout global economic systems, influencing inflation dynamics, industrial competitiveness, and resource allocation patterns. The macroeconomic implications extend far beyond mining sector profitability to affect monetary policy, trade balances, and industrial strategy.
Inflationary Pressures Across Industrial Sectors
High copper prices pressure margins of industrial consumers across multiple sectors, with pass-through effects to consumer goods pricing occurring with typical lags of 3-6 months. Construction cost inflation represents one of the most immediate transmission mechanisms, given copper's essential role in electrical systems and plumbing infrastructure.
Sector-specific inflation transmission:
• Construction: 2-3% cost increase per $1/lb copper price rise
• Electrical equipment: 4-6% margin pressure at current price levels
• Automotive: 1-2% production cost increase for traditional vehicles
• Electronics: Variable impact depending on copper content per product
Housing market impacts manifest through increased construction costs that compound existing affordability challenges. Electrical wiring and plumbing systems represent approximately 3-5% of total home construction costs, translating current copper price levels into US$8,000-12,000 additional costs for median-priced homes.
Mining Company Profitability and Investment Implications
Margin expansion analysis for major copper producers reveals extraordinary profitability at current price levels. Each additional US$0.10 per pound in copper prices generates approximately US$220 million in annual revenue for a producer with 1 million tonnes annual capacity, assuming typical mining costs of US$2.50-3.50 per pound.
| Price Level (US$/lb) | Typical Mining Costs | Operating Margin | Return on Capital |
|---|---|---|---|
| $4.00 | $3.00 | 25% | 12% |
| $5.00 | $3.20 | 36% | 18% |
| $6.00 | $3.40 | 43% | 25% |
| $7.00 | $3.60 | 49% | 32% |
Capital allocation trends in high-price environments typically emphasise expansion projects and exploration investment. However, the multi-year development timelines for copper projects mean that current price levels may not sustain through project completion phases, creating investment timing challenges.
Resource-Rich Economy Benefits: Chile, Peru, and Australia
Fiscal revenue implications for copper-dependent nations provide substantial economic benefits at current price levels. For Chile, each additional one cent per pound in copper prices contributes approximately US$27 million to fiscal revenues annually, translating recent price increases into hundreds of millions in additional government income.
Economic multiplier effects by country:
-
Chile: 15-20% of total fiscal revenue from copper-related taxes and royalties
-
Peru: 8-12% of government revenue tied to mining sector performance
-
Australia: Regional employment and export earnings concentrated in mining states
-
Congo DRC: Foreign exchange earnings heavily dependent on copper and cobalt exports
-
Zambia: Copper represents 60-70% of total export earnings
Currency appreciation effects in major producing countries create complex economic dynamics. While mining revenues increase in USD terms, currency strength can reduce competitiveness in other export sectors, creating "Dutch disease" effects that require careful economic management.
Strategic Outlook: Positioning for the New Copper Reality
The current copper market environment represents a fundamental shift toward sustained higher price levels rather than a temporary spike. Strategic positioning requires understanding both the structural nature of supply constraints and the evolving demand patterns that support elevated pricing over multi-year horizons.
Supply Response Timeline: When Will New Production Come Online?
Major copper projects expected to commence production between 2026-2030 will add approximately 2.5-3.2 million tonnes of annual capacity, though this timeline faces execution risks that could extend development schedules further. The gap between current deficit levels and committed new capacity suggests price support will persist longer than traditional commodity cycles.
| Project | Location | Capacity (tonnes/year) | Expected Start | Development Stage |
|---|---|---|---|---|
| Quebrada Blanca Phase 2 | Chile | 240,000 | 2027 | Construction |
| Kamoa-Kakula Expansion | Congo DRC | 200,000 | 2026-2027 | Advanced |
| Copper Mountain Phase 4 | Canada | 150,000 | 2028 | Permitting |
| Total New Supply | Multiple | 2,800,000 | 2026-2030 | Various |
Technology improvements in extraction and processing offer potential productivity gains, though implementation occurs gradually across existing operations. Automation and digital optimisation can increase throughput by 10-15% at existing facilities, providing meaningful supply additions without requiring new mine development.
Demand Evolution: Structural vs. Cyclical Components
Structural electrification trends continue independent of economic cycles, providing demand floor effects that limit downside price risk even during economic slowdowns. Long-term copper intensity increases from renewable energy deployment, electric vehicle adoption, and power grid modernisation create sustained demand growth averaging 3-4% annually through 2030.
Strategic implications for copper-intensive industries include necessity for supply chain security investments, substitution research programmes, and efficiency improvements to maintain competitiveness at elevated copper price levels.
Potential demand destruction from high prices remains limited by copper's essential role in electrical applications where substitution options are technically constrained or economically unfavourable. Price elasticity analysis suggests demand reduction becomes significant only at sustained price levels above US$8.00 per pound.
Investment Strategy Considerations in a High-Price Environment
Risk-adjusted return expectations for copper exposure require careful evaluation of volatility tolerance and position sizing. Direct commodity exposure through futures or ETFs provides pure price participation but with elevated volatility that may exceed portfolio risk budgets. Furthermore, diversification through copper and uranium investments offers exposure to complementary electrification themes.
Key investment themes for 2026-2030:
• Mining equity exposure with operational leverage to copper prices
• Infrastructure development companies benefiting from increased mining investment
• Copper recycling and scrap recovery operations capturing value from high prices
• Technology solutions addressing mining productivity and ore grade challenges
• Supply chain diversification investments reducing geographic concentration risk
Diversification considerations across the copper value chain suggest balanced exposure to producers, processors, and end-use consumers rather than concentrated positioning in single segments. Mining companies provide operational leverage to prices but face execution risks, while integrated producers offer more stable cash flows with lower absolute returns.
The convergence of structural supply constraints and transformative demand patterns suggests copper markets have entered a new equilibrium characterised by higher absolute price levels and increased volatility. Investment strategies must account for this fundamental shift while maintaining appropriate risk management for an inherently cyclical commodity market.
Ready to Invest in the Next Major Mineral Discovery?
Discovery Alert instantly alerts investors to significant ASX mineral discoveries using its proprietary Discovery IQ model, turning complex mineral data into actionable insights for copper and other critical commodities. Understand why historic discoveries can generate substantial returns by exploring Discovery Alert's dedicated discoveries page and begin your 14-day free trial today to position yourself ahead of the market.